Carlisle City Council elections

One third of Carlisle City Council in Cumbria, England, is elected each year, followed by one year without election. Since the last boundary changes in 1999, 52 councillors have been elected from 22 wards.[1]
Political control[]
Since the first election to the council in 1973 political control of the council has been held by the following parties:[2]
| Party in control | Years |
|---|---|
| Labour | 1973 - 1976 |
| No overall control | 1976 - 1979 |
| Labour | 1979 - 1999 |
| Conservative | 1999 - 2003 |
| No overall control | 2003 - 2012 |
| Labour | 2012 – 2019 |
| No overall control | 2019–2021 |
| Conservative[3] | 2021–Present |
Council elections[]
Summary of the council composition after recent council elections, click on the year for full details of each election. Boundary changes took place for the 1999 election which increased the number of seats by one, leading to the whole council being elected in that year.[4]
- (New ward boundaries)[5]
- (City boundary changes took place but the number of seats remained the same)[6]
- (City boundary changes took place but the number of seats remained the same)[7]
| Year | Labour | Conservative | Independent | Liberal Democrats | Green Party | UKIP | Vacant | Notes |
|---|---|---|---|---|---|---|---|---|
| [8] | 30 | 18 | 1 | 2 | 0 | 0 | 0 | |
| [9] | 27 | 20 | 1 | 3 | 0 | 0 | 0 | |
| [10] | 30 | 17 | 1 | 3 | 0 | 0 | 0 | |
| [11] | 33 | 14 | 1 | 3 | 0 | 0 | 0 | |
| 1998[12] | 33 | 14 | 1 | 3 | 0 | 0 | 0 | |
| 1999[4] | 16 | 28 | 2 | 6 | 0 | 0 | 0 | New ward boundaries[13] |
| 2000[14] | 14 | 30 | 2 | 6 | 0 | 0 | 0 | |
| 2002[15] | 18 | 27 | 2 | 5 | 0 | 0 | 0 | |
| 2003[16] | 22 | 24 | 1 | 5 | 0 | 0 | 0 | |
| 2004[17] | 24 | 20 | 1 | 7 | 0 | 0 | 0 | |
| 2006[18] | 24 | 19 | 1 | 8 | 0 | 0 | 0 | |
| 2007[19] | 25 | 19 | 1 | 7 | 0 | 0 | 0 | |
| 2008[20] | 21 | 21 | 1 | 7 | 0 | 0 | 2 | |
| 2010[21] | 23 | 22 | 2 | 5 | 0 | 0 | 0 | |
| 2011[22] | 24 | 22 | 2 | 4 | 0 | 0 | 0 | |
| 2012[23] | 27 | 20 | 2 | 2 | 0 | 0 | 1 | |
| 2014[2] | 29 | 19 | 2 | 2 | 0 | 0 | 0 | |
| 2015[24] | 29 | 20 | 2 | 1 | 0 | 0 | 0 | |
| 2019[25] | 15 | 17 | 4 | 1 | 1 | 1 | 0 | New ward boundaries[26] |
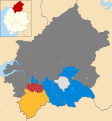
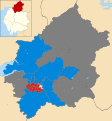
District result maps[]

2002 results map
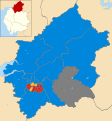
2003 results map

2004 results map

2006 results map

2007 results map

2008 results map

2010 results map

2011 results map
2012 results map
2014 results map


By-election results[]
By-elections occur when seats become vacant between council elections. Below is a summary of recent by-elections;[27] full by-election results can be found by clicking on the by-election name.
| By-election | Date | Incumbent party | Winning party | ||
|---|---|---|---|---|---|
| Trinity | 17 October 1996 | Liberal Democrats | Liberal Democrats | ||
| Belle Vue | 2 October 1997 | Labour | Labour | ||
| Stanwix Rural | 2 October 1997 | Conservative | Conservative | ||
| Castle by-election | 19 April 2001 | Liberal Democrats | Labour | ||
| Castle by-election | 24 November 2005 | Liberal Democrats | Liberal Democrats | ||
| Upperby by-election (2 seats) | 12 June 2008 | Labour | Labour | ||
| Belah by-election | 5 March 2009 | Conservative | Conservative | ||
| Castle by-election | 5 March 2009 | Liberal Democrats | Liberal Democrats | ||
| Stanwix Urban by-election | 16 September 2010 | Conservative | Conservative | ||
| Harraby by-election | 21 June 2012 | Labour | Labour | ||
| Yewdale by-election | 5 September 2013 | Labour | Labour | ||
| Dalston by-election | 17 October 2013 | Conservative | Liberal Democrats | ||
| Castle by-election | 11 September 2014 | Labour | Labour | ||
| Castle & Cathedral | 6 May 2021 | Labour | Labour | ||
| Harraby South & Parklands | 6 May 2021 | Labour | Conservative | ||
| Newtown & Morton North | 6 May 2021 | Labour | Conservative | ||
| Currock & Upperby[28] | 28 October | UKIP | Labour | ||
A detailed breakdown of recent by elections can be found below:
| Election | Political result | Candidate | Party | Votes | % | ±% | ||
|---|---|---|---|---|---|---|---|---|
| Castle & Cathedral by-election, 6 May 2021[29] triggered by the resignation of Cllr. Chris Robinson Turnout: 1,713 (25.9%) | Labour hold Majority: 74 (39.3%) 4.3 | Pete Sunter | Labour | 673 | 39.3 | +4.7 | ||
| Hugh McKerrell | Conservative | 599 | 35 | +19.6 | ||||
| Gavin Hawkton | Green | 299 | 17.5 | -0.7 | ||||
| Stuart Kelly | Liberal Democrats | 95 | 5.5 | -3.0 | ||||
| Harraby South and Parklands by-election, 6 May 2021[30] Electorate: 6,628 Turnout: 1,926 (29.06%) | Conservative gain from Labour Party (UK) Majority: 276 (53.4%) | Linda Mitchell | Conservative | 1028 | 53.4 | |||
| Abdul Harid | Labour | 752 | 39 | |||||
| Anne Gadsden | Green | 132 | 6.9 | |||||
| Newton & Morton North by-election, 6 May 2021[31] Electorate: 6,844 Turnout: 1,805 (26.37%) | Conservative gain from Labour Party (UK) Majority: 116 (48.9%) | Neville Lishman | Conservative | 883 | 48.9 | |||
| David Graham | Labour | 767 | 42.5 | |||||
| Fiona Prior | Green | 101 | 5.6 | |||||
| Brent Kennedy | TUSC | 40 | 2.2 | |||||
| Currock & Upperby by-election, 28 October 2021[32] triggered by the death of incumbent Cllr. John Denholm Electorate: 6,550 Turnout: 1,111 (16.96%) | Labour gain from UK Independence Party Majority: 224 (57.5%) +20.7 | Chris Wills | Labour | 636 | 57.5 | +20.7 | ||
| Geoff Mitchell | Conservative | 412 | 57.5 | +22.2 | ||||
| Tom Adams | Green | 59 | 5.3 | -6.3 | ||||
References[]
- ^ "Voting". Carlisle City Council. Archived from the original on 7 April 2010. Retrieved 24 March 2010.
- ^ a b "Carlisle". BBC News Online. Retrieved 11 April 2015.
- ^ "Labour councillor defects and joins the Tories". News and Star. Retrieved 2021-11-13.
- ^ a b "Carlisle". BBC News Online. Retrieved 27 November 2011.
- ^ The City of Carlisle (Electoral Arrangements) Order 1979
- ^ The Allerdale and Carlisle (Areas) Order 1983
- ^ legislation.gov.uk - The Cumbria, Northumberland and North Yorkshire (County Boundaries) Order 1989. Retrieved on 5 November 2015.
- ^ "Local election results 1992". The Times. 9 May 1992.
- ^ "Non Metropolitan Districts". The Times. 7 May 1994.
- ^ "Complete list of results from thursday's council elections". The Times. 6 May 1995.
- ^ "Election Results Round-Up". The Times. 3 May 1996.
- ^ "Policy and politics: Local Elections: Analysis: Council poll results". The Guardian. 9 May 1998. p. 16.
- ^ "The City of Carlisle (Electoral Changes) Order 1998]". HM Government. Retrieved 4 October 2015.
- ^ "Carlisle". BBC News Online. Retrieved 27 November 2011.
- ^ "Carlisle". BBC News Online. Retrieved 27 November 2011.
- ^ "Local elections". BBC News Online. Retrieved 27 November 2011.
- ^ "Carlisle council". BBC News Online. 11 June 2004. Retrieved 27 November 2011.
- ^ "Local elections: Carlisle". BBC News Online. 4 May 2006. Retrieved 27 November 2011.
- ^ "Carlisle". BBC News Online. 4 May 2007. Retrieved 27 November 2011.
- ^ "Election Results 2008". Carlisle City Council. Archived from the original on 17 November 2011. Retrieved 3 December 2011.
- ^ "Carlisle". BBC News Online. 7 May 2010. Retrieved 27 November 2011.
- ^ "England council elections". BBC News Online. 10 May 2011. Retrieved 27 November 2011.
- ^ "Election results 2012: Non-Metro". The Guardian. 5 May 2012.
- ^ "Carlisle City Council Elections -2015". Carlisle City Council. Archived from the original on 8 May 2015. Retrieved 8 May 2015.
- ^ "Carlisle City Council Elections -2019". Carlisle City Council. Retrieved 5 July 2019.
- ^ "Carlisle". Local Government Boundary Commission for England. Retrieved 5 July 2019.
- ^ "Local Authority Byelection Results". Archived from the original on 29 March 2010. Retrieved 28 November 2011.
- ^ "Results for city council by-election revealed". News and Star. Retrieved 2022-01-29.
- ^ "Conservatives hail 'extraordinary results' in city council by-elections".
- ^ "Results of by-elections. Carlisle City Council".
- ^ "Results of by-elections. Carlisle City Council".
- ^ "Declaration of Result of Poll. Carlisle City Council".
External links[]
- Carlisle City Council elections
- Council elections in Cumbria