2005 Cumbria County Council election
| |||||||||||||||||||||||||||||||||||||||||||||||||||||
All 84 seats of Cumbria County Council 43 seats needed for a majority | |||||||||||||||||||||||||||||||||||||||||||||||||||||
|---|---|---|---|---|---|---|---|---|---|---|---|---|---|---|---|---|---|---|---|---|---|---|---|---|---|---|---|---|---|---|---|---|---|---|---|---|---|---|---|---|---|---|---|---|---|---|---|---|---|---|---|---|---|
| |||||||||||||||||||||||||||||||||||||||||||||||||||||
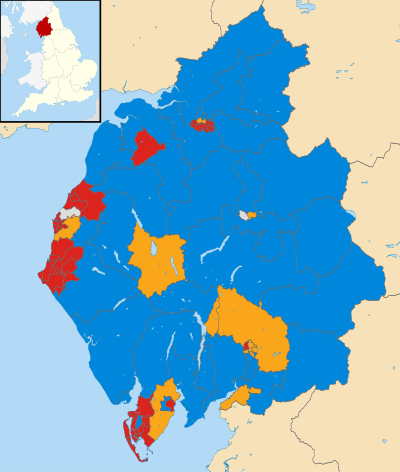 Map showing the results of the 2005 Cumbria County Council elections. | |||||||||||||||||||||||||||||||||||||||||||||||||||||
| |||||||||||||||||||||||||||||||||||||||||||||||||||||
Elections to Cumbria County Council were held on 5 May 2005. This was on the same day as other UK county council elections. The Labour Party lost their majority and the council fell under no overall control.
Results[]
| Party | Seats | Gains | Losses | Net gain/loss | Seats % | Votes % | Votes | +/− | |
|---|---|---|---|---|---|---|---|---|---|
| Labour | 39 | 3 | 4 | 46.4 | 36.1% | 84,482 | |||
| Conservative | 32 | 3 | 3 | 38.1 | 38.7% | 90,794 | |||
| Liberal Democrats | 11 | 3 | 3 | 13.1 | 19.6% | 45,885 | |||
| Independent | 2 | 1 | 0 | 2.4 | 4.7% | 11,035 | |||
| Socialist People's Party | 0 | 0 | 0 | 0.0 | 0.4% | 826 | |||
| Green | 0 | 0 | 0 | 0.0 | 0.2% | 499 | |||
| UKIP | 0 | 0 | 0 | 0.0 | 0.1% | 312 | New | ||
| English Democrat | 0 | 0 | 0 | 0.0 | 0.1% | 269 | New | ||
| Local Community Party | 0 | 0 | 0 | 0.0 | 0.1% | 224 | New | ||
Results by electoral division[]
Allerdale District[]
Aspatria & Wharrels[]
| Party | Candidate | Votes | % | |
|---|---|---|---|---|
| Conservative | James Buchanan | 1,609 | 48.4% | |
| Labour | Carneen McCarron-Holmes | 997 | 30.0% | |
| Liberal Democrats | Eric Burgess | 717 | 21.6% | |
| Majority | 612 | 18.4% | ||
| Turnout | 3,323 | 64.1% | ||
| Conservative hold | ||||
Bowness Thursby & Caldbeck[]
| Party | Candidate | Votes | % | |
|---|---|---|---|---|
| Conservative | Duncan Fairbairn | 1,969 | 62.2% | |
| Liberal Democrats | Olwyn Luckley | 1,195 | 37.8% | |
| Majority | 774 | 24.5% | ||
| Turnout | 3,164 | 64.0% | ||
| Conservative hold | ||||
Cockermouth East[]
| Party | Candidate | Votes | % | |
|---|---|---|---|---|
| Conservative | Eric Nicholson | 1,789 | 54.9% | |
| Labour | Alan Smith | 1,471 | 45.1% | |
| Majority | 318 | 9.8% | ||
| Turnout | 3,260 | 67.4% | ||
| Conservative hold | ||||
Cockermouth West[]
| Party | Candidate | Votes | % | |
|---|---|---|---|---|
| Conservative | Timothy Heslop | 1,550 | 55.9% | |
| Labour | William Bacon | 1,221 | 44.1% | |
| Majority | 329 | 11.9% | ||
| Turnout | 2,771 | 65.6% | ||
| Conservative hold | ||||
Dearham and Broughton[]
| Party | Candidate | Votes | % | |
|---|---|---|---|---|
| Labour | Alan Clark | 2,031 | 59.0% | |
| Conservative | Christopher Harris | 1,412 | 41.0% | |
| Majority | 619 | 18.0% | ||
| Turnout | 3,443 | 64.9% | ||
| Labour hold | ||||
Harrington, Clifton and Stainburn[]
| Party | Candidate | Votes | % | |
|---|---|---|---|---|
| Liberal Democrats | Allan Caine | 1,603 | 52.5% | |
| Labour | Joseph Holliday | 1,450 | 47.5% | |
| Majority | 153 | 5.0% | ||
| Turnout | 3,053 | 60.3% | ||
| Liberal Democrats gain from Labour | ||||
Keswick & Derwent[]
| Party | Candidate | Votes | % | |
|---|---|---|---|---|
| Liberal Democrats | Elizabeth Barraclough | 1,602 | 45.6% | |
| Conservative | Ronald Munby | 1,099 | 31.3% | |
| Labour | Denstone Kemp | 810 | 23.1% | |
| Majority | 503 | 14.3% | ||
| Turnout | 3,511 | 66.3% | ||
| Liberal Democrats gain from Conservative | ||||
Maryport East[]
| Party | Candidate | Votes | % | |
|---|---|---|---|---|
| Labour | Keith Little | 2,044 | 82.9% | |
| Conservative | Derick Pattinson | 421 | 17.1% | |
| Majority | 1,623 | 65.8% | ||
| Turnout | 2,465 | 54.6% | ||
| Labour hold | ||||
Maryport West[]
| Party | Candidate | Votes | % | |
|---|---|---|---|---|
| Labour | William Cameron | 1,706 | 73.5% | |
| Conservative | Neville Lishman | 615 | 26.5% | |
| Majority | 1,091 | 47.0% | ||
| Turnout | 2,321 | 58.1% | ||
| Labour hold | ||||
Moorclose[]
| Party | Candidate | Votes | % | |
|---|---|---|---|---|
| Labour | Gerald Humes | 1,358 | 71.1% | |
| Liberal Democrats | Christine Johanssen | 551 | 28.9% | |
| Majority | 807 | 42.3% | ||
| Turnout | 1,909 | 57.4% | ||
| Labour hold | ||||
Moss Bay[]
| Party | Candidate | Votes | % | |
|---|---|---|---|---|
| Labour | Barbara Cannon | 1,172 | 78.8% | |
| Liberal Democrats | Robert Hardon | 316 | 21.2% | |
| Majority | 856 | 57.5% | ||
| Turnout | 1,488 | 49.5% | ||
| Labour hold | ||||
Seaton[]
| Party | Candidate | Votes | % | |
|---|---|---|---|---|
| Independent | Trevor Fee | 1,202 | 51.3% | |
| Labour | John Ardron | 1,140 | 48.7% | |
| Majority | 62 | 2.6% | ||
| Turnout | 2,342 | 59.1% | ||
| Independent gain from Labour | ||||
Solway Coast[]
| Party | Candidate | Votes | % | |
|---|---|---|---|---|
| Conservative | Anthony Markley | 1,269 | 40.3% | |
| Labour | Robert Allison | 1,127 | 35.8% | |
| Independent | William Jefferson | 749 | 23.8% | |
| Majority | 142 | 4.5% | ||
| Turnout | 3,145 | 63.0% | ||
| Conservative gain from Labour | ||||
St John's[]
| Party | Candidate | Votes | % | |
|---|---|---|---|---|
| Labour | James Samson | 1,345 | 57.8% | |
| Conservative | John Heathcote | 984 | 42.2% | |
| Majority | 361 | 15.5% | ||
| Turnout | 2,329 | 59.5% | ||
| Labour hold | ||||
St Michaels[]
| Party | Candidate | Votes | % | |
|---|---|---|---|---|
| Labour | Alan Barry | 1,282 | 62.7% | |
| Liberal Democrats | Ian Francis | 763 | 37.3% | |
| Majority | 519 | 25.4% | ||
| Turnout | 2,045 | 59.4% | ||
| Labour hold | ||||
Wigton[]
| Party | Candidate | Votes | % | |
|---|---|---|---|---|
| Labour | John Crouch | 856 | 32.1% | |
| Conservative | Stuart Moffat | 804 | 33.9% | |
| Independent | George Scott | 711 | 30.0% | |
| Liberal Democrats | Jacqueline Forsyth | 299 | 12.6% | |
| Majority | 52 | 1.9% | ||
| Turnout | 2,670 | 56.6% | ||
| Labour gain from Conservative | ||||
Barrow-in-Furness[]
Dalton North[]
| Party | Candidate | Votes | % | |
|---|---|---|---|---|
| Labour | Peter Phizacklea | 1,495 | 54.5% | |
| Conservative | William James Crosthwaite | 1,246 | 45.5% | |
| Majority | 249 | 9.1% | ||
| Turnout | 2,741 | 58.1% | ||
| Labour hold | ||||
Dalton South[]
| Party | Candidate | Votes | % | |
|---|---|---|---|---|
| Labour | William Smith | 1,215 | 47.7% | |
| Conservative | Frank Murray | 985 | 38.7% | |
| Independent | Helene Young | 348 | 13.7% | |
| Majority | 230 | 9.0% | ||
| Turnout | 2,548 | 57.9% | ||
| Labour hold | ||||
Hawcoat[]
| Party | Candidate | Votes | % | |
|---|---|---|---|---|
| Conservative | John Richardson | 1,924 | 67.3% | |
| Labour | Tricia Kegg | 935 | 32.7% | |
| Majority | 989 | 34.6% | ||
| Turnout | 2,859 | 67.9% | ||
| Conservative hold | ||||
Hindpool[]
| Party | Candidate | Votes | % | |
|---|---|---|---|---|
| Conservative | Anne Burns | 1,327 | 73.2% | |
| Labour | John Murray | 485 | 26.8% | |
| Majority | 842 | 46.5% | ||
| Turnout | 1,812 | 46.5% | ||
| Conservative hold | ||||
Newbarns[]
| Party | Candidate | Votes | % | |
|---|---|---|---|---|
| Labour | John Murphy | 1,106 | 44.8% | |
| Conservative | William Pears | 1,067 | 43.2% | |
| Independent | James Tongue | 295 | 12.0% | |
| Majority | 39 | 1.6% | ||
| Turnout | 2,468 | 60.0% | ||
| Labour gain from Conservative | ||||
Old Barrow[]
| Party | Candidate | Votes | % | |
|---|---|---|---|---|
| Labour | Clive Kitchen | 657 | 43.4% | |
| Independent | Eric Wood | 645 | 42.6% | |
| Socialist People's Party | Rosemarie Hamezeian | 211 | 13.9% | |
| Majority | 12 | 0.8% | ||
| Turnout | 1,513 | 47.9% | ||
| Labour hold | ||||
Ormsgill[]
| Party | Candidate | Votes | % | |
|---|---|---|---|---|
| Labour | Ernest Wilson | 954 | 49.0% | |
| Socialist People's Party | Jim Hamezeian | 615 | 31.6% | |
| Conservative | Tina Macur | 376 | 19.3% | |
| Majority | 339 | 17.4% | ||
| Turnout | 1,945 | 50.8% | ||
| Labour hold | ||||
Parkside[]
| Party | Candidate | Votes | % | |
|---|---|---|---|---|
| Labour | Alan Nicholson | 1,307 | 58.9% | |
| Conservative | Shirley Richardson | 913 | 41.1% | |
| Majority | 394 | 17.7% | ||
| Turnout | 2,220 | 58.0% | ||
| Labour hold | ||||
Risedale[]
| Party | Candidate | Votes | % | |
|---|---|---|---|---|
| Labour | Kevin Hamilton | 1,654 | 71.9% | |
| Conservative | Desmond English | 645 | 28.1% | |
| Majority | 1,009 | 43.9% | ||
| Turnout | 2,299 | 49.3% | ||
| Labour hold | ||||
Roosecote[]
| Party | Candidate | Votes | % | |
|---|---|---|---|---|
| Labour | Norman Shaw | 1,057 | 38.5% | |
| Conservative | Kenneth Williams | 1,052 | 38.3% | |
| Liberal Democrats | Alan Titcombe | 635 | 23.1% | |
| Majority | 5 | 0.2% | ||
| Turnout | 2,744 | 63.2% | ||
| Labour hold | ||||
Walney North[]
| Party | Candidate | Votes | % | |
|---|---|---|---|---|
| Labour | Jane Murphy | 1,315 | 58.6% | |
| Conservative | Brenda Lauderdale | 632 | 28.2% | |
| Independent | Kenneth Arts | 298 | 13.3% | |
| Majority | 683 | 30.4% | ||
| Turnout | 2,245 | 54.8% | ||
| Labour hold | ||||
Walney South[]
| Party | Candidate | Votes | % | |
|---|---|---|---|---|
| Labour | Jeffrey Garnett | 1,211 | 50.1% | |
| Conservative | Graham Pritchard | 786 | 32.5% | |
| Independent | Stephen Smart | 315 | 13.0% | |
| Independent | Thomas Weall | 103 | 4.3% | |
| Majority | 425 | 17.6% | ||
| Turnout | 2,415 | 58.5% | ||
| Labour hold | ||||
Carlisle[]
Belah[]
| Party | Candidate | Votes | % | |
|---|---|---|---|---|
| Conservative | Alan Toole | 1,644 | 53.9% | |
| Labour | Joseph Hendry | 1,284 | 42.1% | |
| Local Community Party | Mark Gibson | 124 | 4.1% | |
| Majority | 360 | 11.8% | ||
| Turnout | 3,052 | 63.4% | ||
| Conservative hold | ||||
Belle Vue[]
| Party | Candidate | Votes | % | |
|---|---|---|---|---|
| Labour | Cyril Weber | 1,200 | 49.7% | |
| Conservative | George Bain | 745 | 30.9% | |
| Liberal Democrats | James Tootle | 411 | 17.0% | |
| Local Community Party | John Peacock | 57 | 2.4% | |
| Majority | 455 | 18.9% | ||
| Turnout | 2,413 | 57.4% | ||
| Labour hold | ||||
Botcherby[]
| Party | Candidate | Votes | % | |
|---|---|---|---|---|
| Labour | Anne Glendinning | 1,456 | 71.1% | |
| Conservative | Teresa Cartner | 591 | 28.9% | |
| Majority | 865 | 42.3% | ||
| Turnout | 2,047 | 45.5% | ||
| Labour hold | ||||
Brampton & Gilsland[]
| Party | Candidate | Votes | % | |
|---|---|---|---|---|
| Conservative | Philip Howard | 1,370 | 47.8% | |
| Labour | Alex Faulds | 809 | 28.2% | |
| Liberal Democrats | Alan Marsden | 689 | 24.0% | |
| Majority | 561 | 19.6% | ||
| Turnout | 2,868 | 55.1% | ||
| Conservative hold | ||||
Castle[]
| Party | Candidate | Votes | % | |
|---|---|---|---|---|
| Liberal Democrats | Thomas Hodgson | 937 | 43.8% | |
| Labour | Jessica Riddle | 853 | 39.9% | |
| Conservative | Pamela Smith | 349 | 16.3% | |
| Majority | 84 | 3.9% | ||
| Turnout | 2,139 | 50.6% | ||
| Liberal Democrats hold | ||||
Currock[]
| Party | Candidate | Votes | % | |
|---|---|---|---|---|
| Labour | Heather Bradley | 1,414 | 61.7% | |
| Conservative | Lawrence Fisher | 510 | 22.3% | |
| Liberal Democrats | Marjorie Richardson | 366 | 16.0% | |
| Majority | 904 | 39.5% | ||
| Turnout | 2,290 | 52.7% | ||
| Labour hold | ||||
Dalston & Cummersdale[]
| Party | Candidate | Votes | % | |
|---|---|---|---|---|
| Conservative | John Collier | 2,057 | 50.6% | |
| Labour | Ann Warwick | 1,042 | 25.6% | |
| Liberal Democrats | William Wyllie | 968 | 23.8% | |
| Majority | 1,015 | 25.0% | ||
| Turnout | 4,067 | 68.4% | ||
| Conservative hold | ||||
Denton Holme[]
| Party | Candidate | Votes | % | |
|---|---|---|---|---|
| Labour | Hugh McDevitt | 1,587 | 61.7% | |
| Conservative | Doreen Parsons | 543 | 21.1% | |
| Liberal Democrats | Ronald Struthers | 442 | 17.2% | |
| Majority | 1,044 | 40.6% | ||
| Turnout | 2,572 | 55.1% | ||
| Labour hold | ||||
Harraby[]
| Party | Candidate | Votes | % | |
|---|---|---|---|---|
| Labour | Michael Richardson | 1,423 | 56.1% | |
| Conservative | Andrew Stevenson | 691 | 27.2% | |
| Liberal Democrats | Olive Hall | 423 | 16.7% | |
| Majority | 732 | 28.9% | ||
| Turnout | 2,537 | 55.1% | ||
| Labour hold | ||||
Longtown & Bewcastle[]
| Party | Candidate | Votes | % | |
|---|---|---|---|---|
| Conservative | Geoffrey Prest | 1,417 | 52.6% | |
| Labour | Robert Dodds | 769 | 28.5% | |
| Liberal Democrats | Jennifer Gallagher | 509 | 18.9% | |
| Majority | 648 | 24.0% | ||
| Turnout | 2,695 | 53.1% | ||
| Conservative hold | ||||
Morton[]
| Party | Candidate | Votes | % | |
|---|---|---|---|---|
| Labour | John Bell | 1,540 | 49.9% | |
| Conservative | John Farmer | 1,102 | 35.7% | |
| Liberal Democrats | John Farmer | 404 | 13.1% | |
| Local Community Party | Lezley Gibson | 43 | 1.4% | |
| Majority | 438 | 14.2% | ||
| Turnout | 3,089 | 63.9% | ||
| Labour gain from Liberal Democrats | ||||
St Aidans[]
| Party | Candidate | Votes | % | |
|---|---|---|---|---|
| Labour | Reginald Watson | 1,518 | 63.3% | |
| Conservative | James Bainbridge | 880 | 36.7% | |
| Majority | 638 | 26.6% | ||
| Turnout | 2,398 | 53.1% | ||
| Labour hold | ||||
Stanwix & Irthington[]
| Party | Candidate | Votes | % | |
|---|---|---|---|---|
| Conservative | John Mallinson | 1,760 | 51.9% | |
| Independent | William Graham | 1,632 | 48.1% | |
| Majority | 128 | 3.8% | ||
| Turnout | 3,392 | 66.5% | ||
| Conservative hold | ||||
Stanwix Urban[]
| Party | Candidate | Votes | % | |
|---|---|---|---|---|
| Conservative | Elizabeth Mallinson | 1,736 | 54.1% | |
| Labour | George Stothard | 1,475 | 45.9% | |
| Majority | 261 | 8.1% | ||
| Turnout | 3,211 | 66.8% | ||
| Conservative hold | ||||
Upperby[]
| Party | Candidate | Votes | % | |
|---|---|---|---|---|
| Labour | Stewart Young | 1,297 | 60.5% | |
| Conservative | Michael Clarke | 448 | 20.9% | |
| Liberal Democrats | James Osler | 398 | 18.6% | |
| Turnout | 849 | 39.6% | ||
| Majority | 2,143 | 53.2% | ||
| Labour hold | ||||
Wetheral[]
| Party | Candidate | Votes | % | |
|---|---|---|---|---|
| Conservative | John Robinson | 2,206 | 64.7% | |
| Labour | Roger Horne | 1,205 | 35.3% | |
| Majority | 1,001 | 29.3% | ||
| Turnout | 3,411 | 61.3% | ||
| Conservative hold | ||||
Yewdale[]
| Party | Candidate | Votes | % | |
|---|---|---|---|---|
| Labour | Helen Marion Horne | 1,890 | 61.1% | |
| Conservative | Gareth Ellis | 1,202 | 38.9% | |
| Majority | 688 | 22.3% | ||
| Turnout | 3,092 | 63.1% | ||
| Labour hold | ||||
Copeland[]
Bransty[]
| Party | Candidate | Votes | % | |
|---|---|---|---|---|
| Labour | Bernard William Kirk | 1,746 | 64.4% | |
| Conservative | David Hill | 964 | 35.6% | |
| Majority | 782 | 28.9% | ||
| Turnout | 2,710 | 55.7% | ||
| Labour hold | ||||
Cleator Moor North and Frizington[]
| Party | Candidate | Votes | % | |
|---|---|---|---|---|
| Labour | Timothy Knowles | 2,082 | 71.4% | |
| Conservative | Alexander Carroll | 834 | 28.6% | |
| Majority | 1,248 | 42.8% | ||
| Turnout | 2,916 | 55.0% | ||
| Labour hold | ||||
Cleator Moor South & Egremont[]
| Party | Candidate | Votes | % | |
|---|---|---|---|---|
| Labour | Simon Leyton | 1,990 | 63.9% | |
| Conservative | Jean Lewthwaite | 1,126 | 36.1% | |
| Majority | 864 | %27.7% | ||
| Turnout | 3,116 | 59.8% | ||
| Labour hold | ||||
Distington & Moresby[]
| Party | Candidate | Votes | % | |
|---|---|---|---|---|
| Labour | Archibald Ross | 1,522 | 65.1% | |
| Conservative | George Higgins | 817 | 34.9% | |
| Majority | 705 | 30.1% | ||
| Turnout | 2,339 | 55.5% | ||
| Labour hold | ||||
Gosforth & Ennerdale[]
| Party | Candidate | Votes | % | |
|---|---|---|---|---|
| Conservative | Norman Clarkson | 1,467 | 50.2% | |
| Labour | Peter Watson | 897 | 30.7% | |
| Liberal Democrats | Mike Minogue | 56,119.2% | ||
| Majority | 570 | 19.5% | ||
| Turnout | 2,925 | 68.0% | ||
| Conservative hold | ||||
Hensingham & Arlecdon[]
| Party | Candidate | Votes | % | |
|---|---|---|---|---|
| Labour | Ronald Calvin | 1,712 | 67.2% | |
| Conservative | Marie Simpson | 836 | 32.8% | |
| Majority | 876 | 34.4% | ||
| Turnout | 2,548 | 57.0% | ||
| Labour hold | ||||
Hillcrest[]
| Party | Candidate | Votes | % | |
|---|---|---|---|---|
| Labour | Judith Andersen | 1,237 | 46.9% | |
| Conservative | Alistair Norwood | 984 | 37.3% | |
| Liberal Democrats | Francis Hollowell | 419 | 15.9% | |
| Majority | 253 | 9.6% | ||
| Turnout | 2,640 | 59.7% | ||
| Labour hold | ||||
Kells and Sandwith[]
| Party | Candidate | Votes | % | |
|---|---|---|---|---|
| Labour | Joseph McAllister | 1,367 | 65.8% | |
| Independent | Gordon Brown | 357 | 17.2% | |
| Conservative | Leah Higgins | 355 | 17.1% | |
| Majority | 1,010 | 48.6% | ||
| Turnout | 2,079 | 53.3% | ||
| Labour hold | ||||
Millom[]
| Party | Candidate | Votes | % | |
|---|---|---|---|---|
| Conservative | Raymond Cole | 1,700 | 50.03% | |
| Labour | Roland Woodward | 1,698 | 49.97% | |
| Majority | 2 | 0.06% | ||
| Turnout | 3,398 | 60.2% | ||
| Conservative hold | ||||
Mirehouse[]
| Party | Candidate | Votes | % | |
|---|---|---|---|---|
| Labour | John Woolley | 1,357 | 74.2% | |
| Conservative | Marcus Swift | 473 | 25.8% | |
| Majority | 884 | 48.3% | ||
| Turnout | 1,830 | 51.0% | ||
| Labour hold | ||||
Seascale & Whicham[]
| Party | Candidate | Votes | % | |
|---|---|---|---|---|
| Conservative | Susan Brown | 2,321 | 71.0% | |
| Labour | Allan Holliday | 946 | 29.0% | |
| Majority | 1,375 | 42.1% | ||
| Turnout | 67.63,267 | % | ||
| Conservative hold | ||||
St Bees & Egremont[]
| Party | Candidate | Votes | % | |
|---|---|---|---|---|
| Labour | David Southward | 1,411 | 53.9% | |
| Conservative | Adrian Davis-Johnston | 940 | 35.9% | |
| English Democrat | Alan Mossop | 269 | 10.3% | |
| Majority | 471 | 18.0% | ||
| Turnout | 2,620 | 60.6% | ||
| Labour hold | ||||
Eden[]
Alston and East Fellside[]
| Party | Candidate | Votes | % | |
|---|---|---|---|---|
| Conservative | Isa Henderson | 1,257 | 35.7% | |
| Independent | Bryan Metz | 1,028 | 29.2% | |
| Liberal Democrats | George Collinge | 775 | 22.0% | |
| Labour | Christopher Bagshaw | 463 | 13.1% | |
| Majority | 229 | 6.5% | ||
| Turnout | 3,523 | 71.5% | ||
| Conservative hold | ||||
Appleby[]
| Party | Candidate | Votes | % | |
|---|---|---|---|---|
| Conservative | Mary Warburton | 1,474 | 51.0% | |
| Liberal Democrats | Andrew Connell | 1,418 | 49.0% | |
| Majority | 56 | 1.9% | ||
| Turnout | 2,892 | 65.2% | ||
| Conservative hold | ||||
Eden Lakes[]
| Party | Candidate | Votes | % | |
|---|---|---|---|---|
| Conservative | Roger Bird | 1,315 | 44.8% | |
| Liberal Democrats | Neil Hughes | 1,152 | 39.2% | |
| Independent | Jean Wildish | 470 | 16.0% | |
| Majority | 163 | 5.5% | ||
| Turnout | 2,937 | 67.0% | ||
| Conservative hold | ||||
Greystoke and Hesket[]
| Party | Candidate | Votes | % | |
|---|---|---|---|---|
| Conservative | Albert Richardson | 1,775 | 54.9% | |
| Liberal Democrats | David Leonard | 1,063 | 32.9% | |
| Independent | Peter Huddleston | 395 | 12.2% | |
| Majority | 3,233 | 68.6% | ||
| Turnout | 712 | 22.0% | ||
| Conservative hold | ||||
Kirkby Stephen[]
| Party | Candidate | Votes | % | |
|---|---|---|---|---|
| Conservative | Timothy Stoddard | 1,334 | 42.4% | |
| Liberal Democrats | John Raw | 954 | 30.3% | |
| Independent | Jane Brook | 861 | 27.3% | |
| Majority | 3,149 | 64.8% | ||
| Turnout | 380 | 12.1% | ||
| Conservative hold | ||||
Penrith East[]
| Party | Candidate | Votes | % | |
|---|---|---|---|---|
| Liberal Democrats | Michael Ash | 1,129 | 45.1% | |
| Conservative | Gordon Nicolson | 765 | 30.6% | |
| Labour | Keith Dovaston | 467 | 18.7% | |
| Independent | John Nicholson | 141 | 5.6% | |
| Majority | 364 | 14.5% | ||
| Turnout | 2,502 | 55.7% | ||
| Liberal Democrats hold | ||||
Penrith North[]
| Party | Candidate | Votes | % | |
|---|---|---|---|---|
| Conservative | Philip Chappelhow | 1,132 | 39.0% | |
| Liberal Democrats | Andrew Bell | 1,034 | 35.6% | |
| Labour | Geoffrey Rockliffe-King | 432 | 14.9% | |
| Independent | Mary Robinson | 304 | 10.5% | |
| Majority | 98 | 3.4% | ||
| Turnout | 2,902 | 63.8% | ||
| Conservative hold | ||||
Penrith Rural[]
| Party | Candidate | Votes | % | |
|---|---|---|---|---|
| Conservative | Gary Strong | 1,793 | 57.7% | |
| Liberal Democrats | Stuart Hughes | 850 | 27.4% | |
| Labour | Alison Crompton | 464 | 14.9% | |
| Majority | 943 | 30.4% | ||
| Turnout | 3,107 | 69.4% | ||
| Conservative hold | ||||
Penrith West[]
| Party | Candidate | Votes | % | |
|---|---|---|---|---|
| Independent | Colin Nineham | 754 | 33.8% | |
| Conservative | John Thompson | 663 | 29.7% | |
| Liberal Democrats | Roger Burgin | 455 | 20.4% | |
| Labour | Eric Wilson | 360 | 16.1% | |
| Majority | 91 | 4.1% | ||
| Turnout | 2,232 | 54.3% | ||
| Independent hold | ||||
South Lakeland[]
Cartmel[]
| Party | Candidate | Votes | % | |
|---|---|---|---|---|
| Conservative | Edward Walsh | 1,332 | 44.3% | |
| Liberal Democrats | David Birchall | 1,302 | 43.3% | |
| Labour | Marilyn Molloy | 374 | 12.4% | |
| Majority | 30 | 1.0% | ||
| Turnout | 3,008 | 68.3% | ||
| Conservative gain from Liberal Democrats | ||||
Grange[]
| Party | Candidate | Votes | % | |
|---|---|---|---|---|
| Conservative | William Wearing | 1,973 | 53.7% | |
| Liberal Democrats | Jane Hall | 1,374 | 37.4% | |
| Labour | Laurence Scullard | 328 | 8.9% | |
| Majority | 599 | 16.3% | ||
| Turnout | 3,675 | 74.0% | ||
| Conservative hold | ||||
High Furness[]
| Party | Candidate | Votes | % | |
|---|---|---|---|---|
| Conservative | Oliver Pearson | 1,426 | 46.7% | |
| Liberal Democrats | Edward Davies | 1,265 | 41.5% | |
| Labour | Rae Cross | 360 | 11.8% | |
| Majority | 161 | 5.3% | ||
| Turnout | 3,051 | 71.8% | ||
| Conservative hold | ||||
Kendal Castle[]
| Party | Candidate | Votes | % | |
|---|---|---|---|---|
| Liberal Democrats | Thomas Clare | 1,941 | 57.6% | |
| Conservative | Enid Robinson | 1,034 | 30.7% | |
| Labour | Charles Batteson | 395 | 11.7% | |
| Majority | 907 | 26.9% | ||
| Turnout | 3,370 | 71.2% | ||
| Liberal Democrats hold | ||||
Kendal Highgate[]
| Party | Candidate | Votes | % | |
|---|---|---|---|---|
| Liberal Democrats | Geoffrey Cook | 1,167 | 43.6% | |
| Labour | Martyn Jowett | 900 | 33.6% | |
| Conservative | Jaine Chisholm Caunt | 611 | 22.8% | |
| Majority | 267 | 10.0% | ||
| Turnout | 2,678 | 62.5% | ||
| Liberal Democrats gain from Labour | ||||
Kendal Nether[]
| Party | Candidate | Votes | % | |
|---|---|---|---|---|
| Liberal Democrats | Leslie Lishman | 1,506 | 48.9% | |
| Labour | Paul Braithwaite | 791 | 25.7% | |
| Conservative | Karen Patrick | 781 | 25.4% | |
| Majority | 715 | 23.2% | ||
| Turnout | 3,078 | 66.0% | ||
| Liberal Democrats hold | ||||
Kendal South[]
| Party | Candidate | Votes | % | |
|---|---|---|---|---|
| Conservative | Alan Bobbett | 1,480 | 42.2% | |
| Liberal Democrats | Graham Vincent | 1,443 | 41.2% | |
| Labour | Robert Rothwell | 478 | 13.6% | |
| Independent | Andrew Billson-Page | 103 | 2.9% | |
| Majority | 37 | 1.1% | ||
| Turnout | 3,504 | 73.8% | ||
| Conservative hold | ||||
Kendal Strickland and Fell[]
| Party | Candidate | Votes | % | |
|---|---|---|---|---|
| Labour | David Clarke | 1,434 | 45.3% | |
| Liberal Democrats | Stephen Coleman | 1,149 | 36.3% | |
| Conservative | Melvin Mackie | 582 | 18.4% | |
| Majority | 285 | 9.0% | ||
| Turnout | 3,165 | 68.5% | ||
| Labour hold | ||||
Kent Estuary[]
| Party | Candidate | Votes | % | |
|---|---|---|---|---|
| Liberal Democrats | Ian Stewart | 2,038 | 52.5% | |
| Conservative | Andrew Coates | 1,526 | 39.3% | |
| Labour | Andrew Strang | 319 | 8.2% | |
| Majority | 512 | 13.2% | ||
| Turnout | 3,883 | 75.0% | ||
| Liberal Democrats hold | ||||
Lakes[]
| Party | Candidate | Votes | % | |
|---|---|---|---|---|
| Conservative | Brian Barton | 1,025 | 40.5% | |
| Liberal Democrats | Mandi Abrahams | 908 | 35.9% | |
| Independent | George Middleton | 324 | 12.8% | |
| Labour | Maureen Colquhoun | 275 | 10.9% | |
| Majority | 117 | 4.6% | ||
| Turnout | 2,532 | 61.0% | ||
| Conservative gain from Liberal Democrats | ||||
Low Furness[]
| Party | Candidate | Votes | % | |
|---|---|---|---|---|
| Conservative | John Hemingway | 1,636 | 53.4% | |
| Liberal Democrats | David Steel | 1,425 | 46.6% | |
| Majority | 211 | 6.9% | ||
| Turnout | 3,061 | 65.2% | ||
| Conservative hold | ||||
Lower Kentdale[]
| Party | Candidate | Votes | % | |
|---|---|---|---|---|
| Conservative | Roger Bingham | 2,209 | 64.5% | |
| Liberal Democrats | Antony Jolley | 925 | 27.0% | |
| Labour | Peter Horner | 292 | 8.5% | |
| Majority | 1,284 | 37.5% | ||
| Turnout | 3,426 | 74.3% | ||
| Conservative hold | ||||
Lyth Valley[]
| Party | Candidate | Votes | % | |
|---|---|---|---|---|
| Conservative | James Bland | 1,745 | 58.1% | |
| Liberal Democrats | Maureen Horner | 1,048 | 34.9% | |
| Labour | Robin Yates | 212 | 7.1% | |
| Majority | 697 | 23.2% | ||
| Turnout | 3,005 | 73.0% | ||
| Conservative hold | ||||
Sedbergh and Kirkby Lonsdale[]
| Party | Candidate | Votes | % | |
|---|---|---|---|---|
| Conservative | Joseph Nicholson | 1,914 | 57.1% | |
| Liberal Democrats | Sydney McLennan | 1,150 | 34.3% | |
| Labour | Diane Horner | 289 | 8.6% | |
| Majority | 764 | 22.8% | ||
| Turnout | 3,353 | 71.5% | ||
| Conservative hold | ||||
Ulverston East[]
| Party | Candidate | Votes | % | |
|---|---|---|---|---|
| Labour | Wendy Kolbe | 1,397 | 55.2% | |
| Conservative | Brian Wilkinson | 823 | 32.5% | |
| UKIP | Alan Beach | 312 | 12.3% | |
| Majority | 574 | 22.7% | ||
| Turnout | 2,532 | 57.5% | ||
| Labour hold | ||||
Ulverston West[]
| Party | Candidate | Votes | % | |
|---|---|---|---|---|
| Conservative | Pauline Halfpenny | 1,682 | 54.7% | |
| Labour | Bharath Rajan | 896 | 29.1% | |
| Green | Simon Filmore | 499 | 16.2% | |
| Majority | 786 | 25.5% | ||
| Turnout | 3,077 | 69.3% | ||
| Conservative hold | ||||
Upper Kent[]
| Party | Candidate | Votes | % | |
|---|---|---|---|---|
| Liberal Democrats | Stanley Collins | 1,755 | 54.5% | |
| Conservative | Patricia Bell | 1,189 | 36.9% | |
| Labour | Avril Dobson | 277 | 8.6% | |
| Majority | 566 | 17.6% | ||
| Turnout | 3,221 | 72.5% | ||
| Liberal Democrats hold | ||||
Windermere[]
| Party | Candidate | Votes | % | |
|---|---|---|---|---|
| Liberal Democrats | Joan Stocker | 1,858 | 55.0% | |
| Conservative | David Williams | 1,211 | 35.8% | |
| Labour | Yvonne Stewart-Taylor | 309 | 9.1% | |
| Majority | 647 | 19.2% | ||
| Turnout | 3,378 | 69.2% | ||
| Liberal Democrats hold | ||||
References[]
- ^ a b "Local Election Summaries 2005". The Elections Centre. Retrieved 19 October 2019.
- ^ a b Andrew Teale. "Local Election Results 2005 - Cumbria". Local Elections Archive Project. Retrieved 19 October 2019.
- ^ a b c d e f g h i j k l m n o p q r s t u v w x y z aa ab ac ad ae af ag ah ai aj ak al am an ao ap aq ar as at au av aw ax ay az ba bb bc bd be bf bg bh bi bj bk bl bm bn bo bp bq br bs bt bu bv bw bx by bz ca cb cc cd ce cf "Election 2005". Cumbria County Council. Archived from the original on 30 December 2005.
- ^ a b c d e f g h i j k l m n o p q r s t u v w x y z aa ab ac ad ae af ag ah ai aj ak al am an ao ap aq ar as at au av aw ax ay az ba bb bc bd be bf bg bh bi bj bk bl bm bn bo bp bq br bs bt bu bv bw bx by bz ca cb cc cd ce cf "Cumbria County Council Election Results 1973-2009" (PDF). Elections Centre. Retrieved 18 October 2019.
| County council elections | |
|---|---|
| Unitary authorities | |
| District councils (Northern Ireland) | |
| Sui generis | |
| Mayoral elections |
|
| |
Categories:
- 2005 English local elections
- Cumbria County Council elections
- 1980s in Cumbria