Allerdale Borough Council elections
The election of councillors to Allerdale Borough Council in Cumbria, England takes place every four years. At the 1999 boundary review, there were 56 councillors in 31 wards. This changed in 2019 following another boundary review. The number of councillors was reduced to 49 and the number of wards reduced to 23.[1][2]
Political control[]
Since the first election to the council in 1973 political control of the council has been held by the following parties:[3]
| Party in control | Years |
|---|---|
| No overall control | 1973 - 1991 |
| Labour | 1991 - 2003 |
| No overall control | 2003–present |
Council elections[]
- (New ward boundaries)[4]
- (District boundary changes took place but the number of seats remained the same)[5]
- 1999 Allerdale Borough Council election (New ward boundaries increased the number of seat by 1)[6][7]
- 2003 Allerdale Borough Council election
- 2007 Allerdale Borough Council election
- 2011 Allerdale Borough Council election
- 2015 Allerdale Borough Council election
- 2019 Allerdale Borough Council election
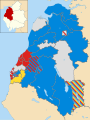
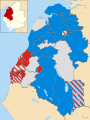
Borough result maps[]
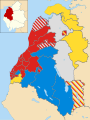
1999 results map

2003 results map
2007 results map
2011 results map


By-election results[]
1995-1999[]
| Party | Candidate | Votes | % | ±% | |
|---|---|---|---|---|---|
| Labour | 207 | 42.0 | |||
| Liberal Democrats | 148 | 30.0 | |||
| Independent | 138 | 28.0 | |||
| Majority | 59 | 12.0 | |||
| Turnout | 493 | 31.0 | |||
| Labour hold | Swing | ||||
| Party | Candidate | Votes | % | ±% | |
|---|---|---|---|---|---|
| Labour | 537 | 89.6 | |||
| Liberal Democrats | 62 | 10.4 | |||
| Majority | 475 | 79.2 | |||
| Turnout | 599 | 30.0 | |||
| Labour hold | Swing | ||||
| Party | Candidate | Votes | % | ±% | |
|---|---|---|---|---|---|
| Labour | 489 | 88.6 | |||
| Conservative | 63 | 11.4 | |||
| Majority | 426 | 77.2 | |||
| Turnout | 552 | 42.0 | |||
| Labour hold | Swing | ||||
| Party | Candidate | Votes | % | ±% | |
|---|---|---|---|---|---|
| Labour | 525 | 59.7 | -9.4 | ||
| Liberal Democrats | 355 | 40.3 | +9.4 | ||
| Majority | 170 | 19.4 | |||
| Turnout | 880 | 29.0 | |||
| Labour hold | Swing | ||||
| Party | Candidate | Votes | % | ±% | |
|---|---|---|---|---|---|
| Labour | 436 | 53.4 | -10.6 | ||
| Conservative | 381 | 46.6 | +10.6 | ||
| Majority | 55 | 6.8 | |||
| Turnout | 817 | 23.5 | |||
| Labour hold | Swing | ||||
| Party | Candidate | Votes | % | ±% | |
|---|---|---|---|---|---|
| Labour | 259 | 51.1 | -3.0 | ||
| Conservative | 248 | 48.9 | +3.0 | ||
| Majority | 11 | 2.2 | |||
| Turnout | 507 | 22.0 | |||
| Labour hold | Swing | ||||
| Party | Candidate | Votes | % | ±% | |
|---|---|---|---|---|---|
| Liberal Democrats | 648 | 45.7 | |||
| Conservative | 388 | 27.4 | |||
| Labour | 331 | 23.3 | |||
| Independent | 51 | 3.6 | |||
| Majority | 260 | 28.3 | |||
| Turnout | 1,418 | 34.2 | |||
| Liberal Democrats gain from Conservative | Swing | ||||
| Party | Candidate | Votes | % | ±% | |
|---|---|---|---|---|---|
| Labour | 658 | 74.2 | +2.9 | ||
| Conservative | 229 | 25.8 | +25.8 | ||
| Majority | 429 | 48.4 | |||
| Turnout | 887 | ||||
| Labour hold | Swing | ||||
| Party | Candidate | Votes | % | ±% | |
|---|---|---|---|---|---|
| Labour | unopposed | ||||
| Labour hold | Swing | ||||
1999-2003[]
| Party | Candidate | Votes | % | ±% | |
|---|---|---|---|---|---|
| Labour | Joan Minto | 906 | |||
| Labour | Peter Bales | 888 | |||
| Labour | Philip Tibble | 770 | |||
| Liberal Democrats | John Morley | 289 | |||
| Liberal Democrats | Mark Hayton | 255 | |||
| Liberal Democrats | Bertha Wright | 225 | |||
| Conservative | Simon Collins | 220 | |||
| Turnout | 3,553 | 24 | |||
| Labour hold | Swing | ||||
| Labour hold | Swing | ||||
| Party | Candidate | Votes | % | ±% | |
|---|---|---|---|---|---|
| Liberal Democrats | Patrick Short | 119 | 67.6 | +67.6 | |
| Independent | Gordon Hanning | 57 | 32.4 | -44.9 | |
| Majority | 62 | 35.2 | |||
| Turnout | 176 | 12.5 | |||
| Liberal Democrats gain from Independent | Swing | ||||
2003-2007[]
| Party | Candidate | Votes | % | ±% | |
|---|---|---|---|---|---|
| Conservative | James Buchanan | 274 | 57.3 | ||
| Independent | Dorothy Tinnion | 87 | 18.2 | ||
| Independent | Janice Nott | 69 | 14.4 | ||
| Labour | Mark Kidd | 48 | 10.0 | ||
| Majority | 187 | 39.1 | |||
| Turnout | 478 | 36.3 | |||
| Conservative gain from Labour | Swing | ||||
| Party | Candidate | Votes | % | ±% | |
|---|---|---|---|---|---|
| Conservative | Stuart Moffat | 308 | 69.7 | ||
| Liberal Democrats | Davis Black | 96 | 21.7 | ||
| Labour | Christine Smith | 38 | 8.6 | ||
| Majority | 212 | 48.0 | |||
| Turnout | 442 | 31.3 | |||
| Conservative gain from Liberal Democrats | Swing | ||||
| Party | Candidate | Votes | % | ±% | |
|---|---|---|---|---|---|
| Conservative | Jacqueline Mounsey | unopposed | |||
| Conservative hold | Swing | ||||
| Party | Candidate | Votes | % | ±% | |
|---|---|---|---|---|---|
| Conservative | John Hunter | 220 | 82.4 | +82.4 | |
| Independent | Charles Miles | 47 | 17.6 | -42.3 | |
| Majority | 173 | 64.8 | |||
| Turnout | 267 | 18.8 | |||
| Conservative gain from Independent | Swing | ||||
| Party | Candidate | Votes | % | ±% | |
|---|---|---|---|---|---|
| Conservative | Vaughan Hodgson | 213 | 61.9 | ||
| Liberal Democrats | Peter Barker | 131 | 38.1 | ||
| Majority | 82 | 23.8 | |||
| Turnout | 344 | 26.8 | |||
| Conservative gain from Liberal Democrats | Swing | ||||
| Party | Candidate | Votes | % | ±% | |
|---|---|---|---|---|---|
| Conservative | Chris Garrard | 220 | 72.6 | ||
| Labour | Bill Bacon | 83 | 27.4 | ||
| Majority | 137 | 45.2 | |||
| Turnout | 303 | 22.1 | |||
| Conservative hold | Swing | ||||
2007-2011[]
| Party | Candidate | Votes | % | ±% | |
|---|---|---|---|---|---|
| Conservative | Alan Tyson | 587 | 45.0 | -1.8 | |
| Labour | Christine Smith | 536 | 41.1 | -12.2 | |
| BNP | Paul Stafford | 99 | 7.6 | +7.6 | |
| Green | Helen Graham | 58 | 4.4 | +4.4 | |
| Independent | Eddie Woodthorpe | 25 | 1.9 | +1.9 | |
| Majority | 51 | 3.9 | |||
| Turnout | 1,305 | 36 | |||
| Conservative hold | Swing | ||||
| Party | Candidate | Votes | % | ±% | |
|---|---|---|---|---|---|
| Labour | Gerald Humes | 452 | 35.6 | -14.7 | |
| Conservative | Simon Collins | 394 | 31.0 | -18.7 | |
| BNP | Clive Jefferson | 257 | 20.2 | +20.2 | |
| Independent | John Bracken | 113 | 8.9 | +8.9 | |
| Green | Alistair Grey | 55 | 4.3 | +4.3 | |
| Majority | 58 | 4.6 | |||
| Turnout | 1,271 | 30.0 | |||
| Labour gain from Conservative | Swing | ||||
| Party | Candidate | Votes | % | ±% | |
|---|---|---|---|---|---|
| Conservative | Roy Swindells | 466 | 66.1 | +0.9 | |
| Liberal Democrats | Roger Peck | 131 | 18.6 | +18.6 | |
| Green | Bob Edwards | 108 | 15.3 | +15.3 | |
| Majority | 335 | 47.5 | |||
| Turnout | 705 | 24.1 | |||
| Conservative hold | Swing | ||||
2011-2015[]
| Party | Candidate | Votes | % | ±% | |
|---|---|---|---|---|---|
| Liberal Democrats | Martin Pugmire | 757 | 59.7 | ||
| Labour | Tony Lywood | 448 | 35.3 | ||
| Green | Flic Crowley | 63 | 5.0 | ||
| Majority | 309 | 24.4 | |||
| Turnout | 1,268 | 31.9 | |||
| Liberal Democrats gain from Independent | Swing | ||||
2016-present[]
s
| Party | Candidate | Votes | % | ±% | |
|---|---|---|---|---|---|
| Labour | Joan Ellis | 324 | 40.7 | +5.8 | |
| Liberal Democrats | Debbie Taylor | 234 | 29.4 | +20.0 | |
| Conservative | Simon Nicholson | 206 | 25.9 | -19.3 | |
| UKIP | Eric Atkinson | 32 | 4.0 | N/A | |
| Majority | 90 | 11.3 | |||
| Turnout | 800 | 36 | |||
| Labour gain from Conservative | Swing | ||||
The by-election was triggered by the resignation of Conservative Party Councillor Margaret Jackson.
References[]
- ^ "The Allerdale (Electoral Changes) Order 2017". legislation.gov.uk. Retrieved 24 September 2019.
- ^ "Boundary Review". Allerdale BC. 7 February 2018. Retrieved 24 September 2019.
- ^ "England council elections". BBC News Online. Archived from the original on 2011-05-19. Retrieved 14 May 2011.
- ^ The District of Allerdale (Electoral Arrangements) Order 1978
- ^ The Allerdale and Carlisle (Areas) Order 1983
- ^ "Allerdale". BBC Online. Retrieved 2008-06-08.
- ^ legislation.gov.uk - The Borough of Allerdale (Electoral Changes) Order 1998. Retrieved on 4 October 2015.
- ^ "Borough elections results 2007". Allerdale Borough Council. Archived from the original on 27 September 2011. Retrieved 14 May 2011.
- ^ "By-Election in Waver". Allerdale Borough Council. 26 September 2001. Archived from the original on 27 September 2011. Retrieved 14 May 2011.
- ^ "Election results 2003". Allerdale Borough Council. Archived from the original on 27 September 2011. Retrieved 14 May 2011.
- ^ "Wampool ward election result". Allerdale Borough Council. 6 April 2004. Archived from the original on 27 September 2011. Retrieved 14 May 2011.
- ^ "Borough elections results 2007". Allerdale borough council. Archived from the original on 27 September 2011. Retrieved 14 May 2011.
- ^ "John wins election for Tories". Cumbria Life. 23 September 2005. Archived from the original on 2011-07-23. Retrieved 14 May 2011.
- ^ "Lib Dems lose Allerdale seat". News and Star. 9 November 2005. Retrieved 14 May 2011.
- ^ "Tories hold Dalton ward". Cumbria Life. 2 December 2005. Archived from the original on 2011-07-23. Retrieved 14 May 2011.
- ^ "Elections 2011". Allerdale borough council. Archived from the original on 27 September 2011. Retrieved 14 May 2011.
- ^ "Labour takes Tory ward in Workington election". The Whitehaven News. 31 October 2008. Archived from the original on 2011-10-06. Retrieved 14 May 2011.
- ^ "News releases". Allerdale borough council. Archived from the original on 27 September 2011. Retrieved 14 May 2011.
- ^ "Liberal Democrats make a comeback to Allerdale Council". Times & Star. 2 September 2011. Archived from the original on 2012-04-01. Retrieved 2 September 2011.
- ^ Fallowfield, Carl (23 September 2016). "Cockermouth Christchurch Borough and Parish by-election results". Cumbria Crack. Barrnon Media Ltd. Archived from the original on 29 November 2016.
External links[]
Categories:
- Allerdale Borough Council elections
- Politics of Allerdale
- Council elections in Cumbria
- District council elections in England