Leicestershire County Council elections
This article uses bare URLs, which may be threatened by link rot. (May 2021) |
Leicestershire County Council in England is elected every four years.
Political control[]
Since 1973 political control of the council has been held by the following parties:[1]
| Party in control | Years |
|---|---|
| No overall control | 1973 - 1977 |
| Conservative | 1977 - 1981 |
| No overall control | 1981 - 2001 |
| Conservative | 2001–present |
Council elections[]
- (boundary changes took place for this election)[2]
- 2009 Leicestershire County Council election
- 2013 Leicestershire County Council election
- 2017 Leicestershire County Council election
- 2021 Leicestershire County Council election
County result maps[]
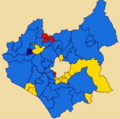
2009

2013

2017
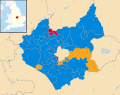
2021


Changes between elections[]
1993-1997[]
| Party | Candidate | Votes | % | ±% | |
|---|---|---|---|---|---|
| Liberal Democrats | 399 | 33.1 | |||
| Labour | 367 | 30.4 | |||
| Conservative | 189 | 15.7 | |||
| Militant Labour | 150 | 12.4 | |||
| Socialist Labour | 101 | 8.4 | |||
| Majority | 32 | 2.7 | |||
| Turnout | 1,206 | 21 | |||
| Liberal Democrats gain from Labour | Swing | ||||
1997-2001[]
| Party | Candidate | Votes | % | ±% | |
|---|---|---|---|---|---|
| Conservative | Peter Osborne | 1,064 | 72.0 | +21.5 | |
| Liberal Democrats | Helena Edwards | 414 | 28.0 | +0.5 | |
| Majority | 650 | 44.0 | |||
| Turnout | 1,478 | 21.8 | |||
| Conservative hold | Swing | ||||
| Party | Candidate | Votes | % | ±% | |
|---|---|---|---|---|---|
| Labour | Marylin Cowles | 751 | 52.3 | +0.9 | |
| Conservative | Richard Allen | 525 | 36.5 | +2.5 | |
| Liberal Democrats | Paul Tyler | 159 | 11.1 | -3.4 | |
| Majority | 226 | 15.8 | |||
| Turnout | 1,435 | 19.2 | |||
| Labour hold | Swing | ||||
2005-2009[]
| Party | Candidate | Votes | % | ±% | |
|---|---|---|---|---|---|
| Labour | Kevin Parler | 1,217 | 30.2 | -12.7 | |
| Conservative | Christine Radford | 1,074 | 26.6 | -10.2 | |
| Liberal Democrats | John Popley | 933 | 23.1 | +2.8 | |
| BNP | Julia Green | 807 | 20.0 | +20.0 | |
| Majority | 143 | 3.6 | |||
| Turnout | 4,031 | 37.3 | |||
| Labour hold | Swing | ||||
2009-2013[]
| Party | Candidate | Votes | % | ±% | |
|---|---|---|---|---|---|
| Conservative | Stephen John Hampson | 981 | 52.13 | -0.47 | |
| Labour | Colin Lovell | 490 | 26.04 | +6.64 | |
| BNP | Catherine Ann Mary Duffy | 279 | 14.82 | -4.58 | |
| Liberal Democrats | Richard John Miller | 132 | 7.01 | -10.39 | |
| Majority | 491 | ||||
| Turnout | 1,882 | ||||
| Conservative hold | Swing | ||||
2017-2021[]
Veteran Conservative councillor Ernie White (Stoney Stanton and Croft) died on 2 January 2018.[7] A by-election will be held on 3 May.[8]
References[]
- ^ "Leicestershire". BBC News Online. 2009-04-19. Retrieved 2009-09-11.
- ^ "Local election results: Leicestershire". BBC News Online. Retrieved 2009-09-11.
- ^ "Tories victorious". Leicester Mercury. 1999-09-10.
- ^ "Labour delight". Leicester Mercury. 1999-10-29.
- ^ "County Council By Election Result for Shepshed Electoral Division". Leicestershire County Council. Retrieved 2009-09-11.
- ^ "Leicestershire County Council | Serving the people of Leicestershire".
- ^ Richardson, Terry. "Ernie White". Blaby Council. Retrieved 10 Apr 2018.
- ^ "Page Moss: CTRL – DEL | LocalCouncils.co.uk". localcouncils.co.uk. Retrieved 2018-04-10.
Sources[]
External links[]
Categories:
- Leicestershire County Council elections
- Council elections in the East Midlands
- Council elections in Leicestershire
- County council elections in England