New Forest District Council elections
New Forest District Council in Hampshire, England is elected every four years.
Political control[]
Since the foundation of the council in 1973 political control of the council has been held by the following parties:[1]
| Party in control | Years |
|---|---|
| Independent | 1973 - 1976 |
| Conservative | 1976 - 1991 |
| No overall control | 1991 - 1995 |
| Liberal Democrats | 1995 - 1999 |
| Conservative | 1999–present |
Previously New Forest District Council was controlled by the Independent Group, however the Conservatives entered into talks with several independents and the Party later decided to field candidates for the 1973 Local Election. Subsequently, from 1976 to 1991 the Conservatives had the majority on New Forest District Council, although after the 1991 Local Election the Conservatives remained the largest Party but became a minority administration. This was due to two factors, firstly the unpopularity of the national Conservative Government, and secondly the rise of the Liberal Democrats after the merger of the SDP and Liberal Parties.
In 1995 the Lib Dems won control of the District Council and formed a majority administration, the first political party other than the Conservatives to do so. The result was a concern for local Conservatives who subsequently feared that the new parliamentary constituencies for the New Forest (NF East & NF West) could be lost to the Lib Dems at the upcoming 1997 General Election. Nevertheless, both seats were won by the Tories despite a crushing national defeat that resulted in a landslide Labour Government. Locally the Liberal Democrat administration in the New Forest became very unpopular. Firstly the Council increased taxes by upwards of 40% over four years and secondly the administration introduced car parking charges in Council owned car parks despite winning a majority on the promise not to do so.
In a surprising result that came as a shock to many, the Conservatives won a majority of two at NFDC after the 1999 Local Election. This was especially traumatic for the Lid Dems who expected to remain in control of the Council, not least because of the unpopularity of the national Conservative Party. At the 2003 Election the Conservatives increased their majority slightly, and by 2007 the Tories won a solid majority taking 46 of the 60 seats. At the 2011 Local Election, encouraged by the growing popularity of the Conservatives in Coalition Government, the Tories had their first landslide and won 54 of the 60 seats leaving the Lib Dems with only 6 representatives. In 2014 the Tories lost two Councillors after defections to UKIP.
In 2015 the Local Elections coincided with the General Election. Both New Forest Parliamentary constituencies were won with almost 60% of the popular vote. The Tories left the Lib Dems 'feeling blue' after a second landslide which resulted in 58 Conservative Councillors and only 2 Lib Dems. UKIP, who were expected to make significant gains in the New Forest, were unable to increase their numbers of representative and lost their only two Councillors, both of whom were formerly Conservative defectors.
Following the re-emergence of the Liberal Democrats following the European Union Referendum in 2016, the Liberal Democrats gained 11 seats from the Conservatives in the 2019 Local Election to take their total to 13. The Conservatives also lost a seat to an Independent candidate in Lymington Town to leave the final make-up of New Forest District Council as 46 Conservatives, 13 Lib Dems, and 1 Independent.
New boundaries are due to come into force in December 2020,[2] with the next local election due to take place in 2023.
| Political Party | 1995 | 1999 | 2003 | 2007 | 2011 | 2015 | 2019 |
|---|---|---|---|---|---|---|---|
| Conservative | 23 | 30 | 32 | 44 | 54 | 58 | 46 |
| Liberal Democrats | 31 | 25 | 27 | 14 | 6 | 2 | 13 |
| Independent | 4 | 3 | 1 | 2 | 0 | 0 | 1 |
Council elections[]
- (New ward boundaries)[3]
- (District boundary changes took place but the number of seats remained the same)[4]
- (District boundary changes took place but the number of seats remained the same)[5]
- 1999 New Forest District Council election
- 2003 New Forest District Council election (New ward boundaries increased the number of seats by 2)[6][7]
- 2007 New Forest District Council election
- 2011 New Forest District Council election (Some new ward boundaries)[8]
- 2015 New Forest District Council election
- 2019 New Forest District Council election
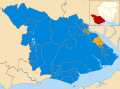
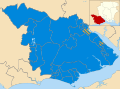
District results map[]


By-election results[]
1995-1999[]
| Party | Candidate | Votes | % | ±% | |
|---|---|---|---|---|---|
| Conservative | John Waddington | 503 | 61.6 | +21.4 | |
| Liberal Democrats | Veronica Sullivan | 313 | 38.4 | +1.4 | |
| Majority | 190 | 23.2 | |||
| Turnout | 816 | 21.1 | |||
| Conservative hold | Swing | ||||
1999-2003[]
| Party | Candidate | Votes | % | ±% | |
|---|---|---|---|---|---|
| Conservative | Jill Cleary | 2,186 | 57.1 | -7.5 | |
| Liberal Democrats | Margaret Newlands | 1,638 | 42.8 | +21.3 | |
| Majority | 548 | 14.3 | |||
| Turnout | 3,824 | 59.7 | |||
| Conservative hold | Swing | ||||
| Party | Candidate | Votes | % | ±% | |
|---|---|---|---|---|---|
| Conservative | Godfrey Beck | 692 | 61.0 | -7.6 | |
| Liberal Democrats | Margaret Newlands | 442 | 39.0 | +7.6 | |
| Majority | 250 | 22.0 | |||
| Turnout | 1,134 | 21.5 | |||
| Conservative hold | Swing | ||||
| Party | Candidate | Votes | % | ±% | |
|---|---|---|---|---|---|
| Conservative | Brian Pemberton | 781 | 74.0 | +2.4 | |
| Liberal Democrats | Jasqueline Szwaczka | 275 | 26.0 | +8.7 | |
| Majority | 506 | 48.0 | |||
| Turnout | 1,056 | 25.6 | |||
| Conservative hold | Swing | ||||
| Party | Candidate | Votes | % | ±% | |
|---|---|---|---|---|---|
| Liberal Democrats | Paul Hickman | 1,079 | 70.6 | +25.4 | |
| Conservative | Penelope Beasley | 449 | 29.4 | -11.2 | |
| Majority | 630 | 41.2 | |||
| Turnout | 1,528 | 34.8 | |||
| Liberal Democrats gain from Conservative | Swing | ||||
| Party | Candidate | Votes | % | ±% | |
|---|---|---|---|---|---|
| Conservative | Lorna Ford | 337 | 47.5 | -13.2 | |
| Independent | Stephen Wright | 203 | 28.6 | +28.6 | |
| Liberal Democrats | Peter Chambers | 169 | 23.8 | -2.0 | |
| Majority | 134 | 18.9 | |||
| Turnout | 709 | 18.2 | |||
| Conservative hold | Swing | ||||
2003-2007[]
| Party | Candidate | Votes | % | ±% | |
|---|---|---|---|---|---|
| Liberal Democrats | Lee Dunsdon | 772 | 75.2 | +3.5 | |
| Conservative | Robert Wappet | 210 | 20.4 | -7.9 | |
| Labour | Philip Annette | 45 | 4.4 | +4.4 | |
| Majority | 562 | 54.8 | |||
| Turnout | 1,027 | 21.4 | |||
| Liberal Democrats hold | Swing | ||||
| Party | Candidate | Votes | % | ±% | |
|---|---|---|---|---|---|
| Conservative | Christopher Treleaven | 953 | 64.4 | -11.6 | |
| Liberal Democrats | Peter Chambers | 527 | 35.6 | +11.6 | |
| Majority | 426 | 28.8 | |||
| Turnout | 1,480 | 68.8 | |||
| Conservative hold | Swing | ||||
| Party | Candidate | Votes | % | ±% | |
|---|---|---|---|---|---|
| Liberal Democrats | Leonard Harris | 535 | 48.1 | +0.3 | |
| Conservative | Diana Brooks | 498 | 44.8 | -7.4 | |
| Labour | Alan Goodfellow | 79 | 7.1 | +7.1 | |
| Majority | 37 | 3.3 | |||
| Turnout | 1,112 | 28.5 | |||
| Liberal Democrats gain from Conservative | Swing | ||||
| Party | Candidate | Votes | % | ±% | |
|---|---|---|---|---|---|
| Conservative | Frances Carpenter | 990 | 56.9 | -16.7 | |
| Liberal Democrats | Wynford Davies | 426 | 24.5 | -1.9 | |
| Independent | Jeremy May | 277 | 15.9 | +15.9 | |
| Labour | Peter Dance | 48 | 2.8 | +2.8 | |
| Majority | 564 | 32.4 | |||
| Turnout | 1,741 | 36.7 | |||
| Conservative hold | Swing | ||||
2007-2011[]
The 2007 Brahmshaw, Copythorne Noorth and Minstead By-Election was held after a candidate for the 2007 local election died, postponing the election for that ward.
| Party | Candidate | Votes | % | ±% | |
|---|---|---|---|---|---|
| Conservative | Henry Forse | 436 | 78.0 | +4.9 | |
| Liberal Democrats | Anthony Gray | 123 | 22.0 | -4.9 | |
| Majority | 313 | 56.0 | |||
| Turnout | 559 | 26.2 | |||
| Conservative hold | Swing | ||||
| Party | Candidate | Votes | % | ±% | |
|---|---|---|---|---|---|
| Conservative | Jeremy Heron | 610 | 58.6 | +25.1 | |
| Liberal Democrats | Peter Chambers | 354 | 32.9 | +12.3 | |
| Labour | Peter Harper | 113 | 10.5 | +1.6 | |
| Majority | 256 | 25.7 | |||
| Turnout | 1,077 | 23.3 | |||
| Conservative gain from Independent | Swing | ||||
2011-2015[]
2015-2019[]
2019-2023[]
References[]
- ^ "New Forest". BBC News Online. Retrieved 2009-09-15.
- ^ "LGBCE | New Forest | LGBCE Site". www.lgbce.org.uk. Retrieved 2020-09-28.
- ^ legislation.gov.uk - The District of New Forest (Electoral Arrangements) Order 1976. Retrieved on 19 November 2015.
- ^ The New Forest and Southampton (Areas) Order 1978
- ^ legislation.gov.uk - The Dorset, Hampshire, West Sussex and Wiltshire (County Boundaries) Order 1991. Retrieved on 5 November 2015.
- ^ "Local elections". BBC News Online. Retrieved 2009-09-15.
- ^ legislation.gov.uk - The District of New Forest (Parishes and Electoral Changes) Order 2001. Retrieved on 4 October 2015.
- ^ legislation.gov.uk - The New Forest (Electoral Changes) Order 2011. Retrieved on 3 November 2015.
- ^ a b c d e f "District Council By-Election Results 1998 - 2003". New Forest District Council. Retrieved 2009-09-15.
- ^ a b c d "District Council By-Election Results 2004 - 2007". New Forest District Council. Retrieved 2009-09-15.
- ^ "By-election for district council Bramshaw, Copythorne North and Minstead ward - 14 June 2007 - report of the returning officer" (PDF). New Forest District Council. Archived from the original (PDF) on 22 July 2011. Retrieved 2009-09-15.
- ^ "District Council Election - Ringwood South Ward - 19 June 2008 - Results". New Forest District Council. Retrieved 2009-09-15.
External links[]
- New Forest District Council elections
- Council elections in Hampshire
- District council elections in England