Gosport Borough Council elections
Half of Gosport Borough Council in Hampshire, England is elected every two years. Until 2002 the council was elected by thirds.
Political control[]
Since the foundation of the council in 1973 political control of the council has been held by the following parties:[1]
| Party in control | Years |
|---|---|
| Labour | 1973–1976 |
| Conservative | 1976–1990 |
| No overall control | 1990–1991 |
| Liberal Democrats | 1991–1997 |
| No overall control | 1997–2004 |
| Conservative | 2004–2006 |
| No overall control | 2006–2010 |
| Conservative | 2010–present |
Council elections[]
- (New ward boundaries)[2]
- 1998 Gosport Borough Council election
- 1999 Gosport Borough Council election
- 2000 Gosport Borough Council election
- 2002 Gosport Borough Council election (New ward boundaries)[3][4]
- 2004 Gosport Borough Council election
- 2006 Gosport Borough Council election
- 2008 Gosport Borough Council election
- 2010 Gosport Borough Council election
- 2012 Gosport Borough Council election
- 2014 Gosport Borough Council election
- 2016 Gosport Borough Council election
- 2018 Gosport Borough Council election
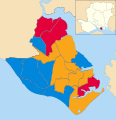
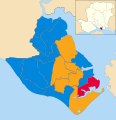
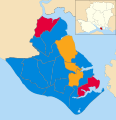
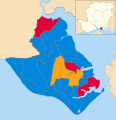
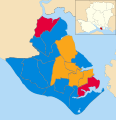
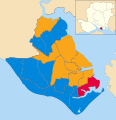
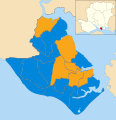
Borough result maps[]


By-election results[]
| Party | Candidate | Votes | % | ±% | |
|---|---|---|---|---|---|
| Labour | 908 | 51.1 | |||
| Conservative | 620 | 34.9 | |||
| Liberal Democrats | 249 | 14.0 | |||
| Majority | 288 | 16.2 | |||
| Turnout | 1,777 | 29.1 | |||
| Labour hold | Swing | ||||
| Party | Candidate | Votes | % | ±% | |
|---|---|---|---|---|---|
| Labour | 931 | 48.9 | |||
| Conservative | 763 | 40.1 | |||
| Liberal Democrats | 210 | 11.0 | |||
| Majority | 168 | 8.8 | |||
| Turnout | 1,904 | ||||
| Labour hold | Swing | ||||
| Party | Candidate | Votes | % | ±% | |
|---|---|---|---|---|---|
| Labour | 427 | 36.1 | +7.8 | ||
| Ind. Liberal Democrat | 423 | 35.8 | +35.8 | ||
| Conservative | 221 | 18.7 | -2.6 | ||
| Liberal Democrats | 111 | 9.4 | -41.0 | ||
| Majority | 4 | 0.3 | |||
| Turnout | 1,182 | ||||
| Labour gain from Liberal Democrats | Swing | ||||
| Party | Candidate | Votes | % | ±% | |
|---|---|---|---|---|---|
| Liberal Democrats | 797 | 57.2 | +22.2 | ||
| Conservative | 402 | 28.9 | -6.4 | ||
| Labour | 194 | 13.9 | -2.5 | ||
| Majority | 395 | 28.3 | |||
| Turnout | 1,393 | 25.0 | |||
| Liberal Democrats hold | Swing | ||||
| Party | Candidate | Votes | % | ±% | |
|---|---|---|---|---|---|
| Conservative | 907 | 65.6 | -3.0 | ||
| Labour | 412 | 29.8 | +21.1 | ||
| Liberal Democrats | 63 | 4.5 | -18.2 | ||
| Majority | 495 | 35.8 | |||
| Turnout | 1,382 | 39.6 | |||
| Conservative hold | Swing | ||||
| Party | Candidate | Votes | % | ±% | |
|---|---|---|---|---|---|
| Conservative | Colin Jacobs | 603 | 48.4 | +7.7 | |
| Liberal Democrats | Austin Hicks | 485 | 38.9 | -7.8 | |
| Labour | Gayle Batterbury | 158 | 12.7 | +0.0 | |
| Majority | 118 | 9.5 | |||
| Turnout | 1,246 | 38.0 | |||
| Conservative gain from Liberal Democrats | Swing | ||||
| Party | Candidate | Votes | % | ±% | |
|---|---|---|---|---|---|
| Labour | Diane Searle | 480 | 41.7 | -19.8 | |
| Conservative | Adam Burns | 320 | 27.8 | +0.9 | |
| Liberal Democrats | Heather Carr | 200 | 17.4 | +5.8 | |
| Independent | Brian Hart | 71 | 6.2 | +6.2 | |
| English Democrat | Robert Shaw | 50 | 4.3 | +4.3 | |
| Green | Jane Staffieri | 31 | 2.7 | +2.7 | |
| Majority | 160 | 13.9 | |||
| Turnout | 1,152 | 32.5 | |||
| Labour hold | Swing | ||||
| Party | Candidate | Votes | % | ±% | |
|---|---|---|---|---|---|
| Liberal Democrats | Robert Hylands | 562 | |||
| Liberal Democrats | Siobhan Mitchell-Smith | 523 | |||
| Conservative | Justin Henshaw | 364 | |||
| Conservative | Brian Taylor | 339 | |||
| Green | Claire Smith | 131 | |||
| Labour | Joe O'Gorman | 60 | |||
| Labour | Michael O'Gorman | 56 | |||
| Turnout | 2,035 | 28.2 | |||
| Liberal Democrats hold | Swing | ||||
| Liberal Democrats hold | Swing | ||||
| Party | Candidate | Votes | % | ±% | |
|---|---|---|---|---|---|
| Liberal Democrats | Hammond, Stephen Geoffrey | 644 | 58% | ||
| Labour | Fox, James Llewellyn | 255 | 23% | ||
| Conservative | Dickson, Richard James | 212 | 19% | ||
| Turnout | 1,111 | 32% | |||
| Liberal Democrats gain from Labour | Swing | ||||
| Party | Candidate | Votes | % | ±% | |
|---|---|---|---|---|---|
| Liberal Democrats | Siobhan Mitchell | 488 | 52 | ??? | |
| Conservative | Pecs Uluiviti | 214 | 23 | ??? | |
| Union & Sovereignty | Simion James Bellford | 165 | 17 | +17 | |
| Labour | Kristy Anne Smillie | 80 | 8 | ??? | |
| Majority | 4 | 0.3 | |||
| Turnout | 947 | 26 | |||
| Liberal Democrats hold | Swing | ||||
References[]
- ^ "Gosport". BBC News Online. 2009-04-19. Retrieved 2010-05-07.
- ^ The Borough of Gosport (Electoral Arrangements) Order 1978
- ^ "Gosport". BBC Online. Retrieved 2008-05-10.
- ^ legislation.gov.uk - The Borough of Gosport (Electoral Changes) Order 2001. Retrieved on 4 October 2015.
- ^ "Labour regains ground in local contests". guardian.co.uk. London. 2002-09-13. Retrieved 2009-10-19.
- ^ "Tories buck losing trend". guardian.co.uk. London. 2003-08-22. Retrieved 2009-10-19.
- ^ "Labour retains power in Gosport". The Portsmouth Evening News. 2007-08-02.
- ^ "Lib Dems hold on to seats in Gosport by-election". The News. 2009-07-10. Retrieved 2009-10-19.
- ^ "Election results for Bridgemary North". ww.gosport.gov.uk. Gosport Borough Council. Retrieved 3 December 2017.
- ^ "Election results for Brockhurst, 30 May 2019". democracy.gosport.gov.uk. May 31, 2019. Retrieved May 31, 2019.
External links[]
Categories:
- Gosport Borough Council elections
- Politics of Gosport
- Council elections in Hampshire
- District council elections in England