Basco Airport
Basco Airport Paliparan ng Basco Pagtayaban ti Basco | |||||||||||
|---|---|---|---|---|---|---|---|---|---|---|---|
 | |||||||||||
| Summary | |||||||||||
| Airport type | Public | ||||||||||
| Operator | Civil Aviation Authority of the Philippines | ||||||||||
| Serves | Basco, Batanes | ||||||||||
| Location | Barangay Ihuvok II (Kayvalugananan), Basco | ||||||||||
| Elevation AMSL | 89 m / 291 ft | ||||||||||
| Coordinates | 20°27′05″N 121°58′48″E / 20.45139°N 121.98000°ECoordinates: 20°27′05″N 121°58′48″E / 20.45139°N 121.98000°E | ||||||||||
| Map | |||||||||||
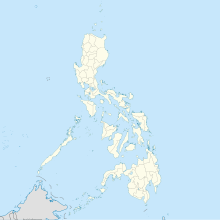 BSO/RPUO Location in the Philippines | |||||||||||
| Runways | |||||||||||
| |||||||||||
| Statistics (2017) | |||||||||||
| |||||||||||
Source: Statistics from eFOI[1] | |||||||||||

Basco Airport (Filipino: Paliparan ng Basco, Ilocano: Pagtayaban ti Basco) (IATA: BSO, ICAO: RPUO) is an airport serving the province of Batanes in the Philippines. It is located in the provincial capital, Basco, and is one of two airports in the Batanes Islands, the other being Itbayat Airport. The airport is classified as a Class 2 principal (minor domestic) airport by the Civil Aviation Authority of the Philippines (CAAP), a body of the Department of Transportation that is responsible for the operations of not only this airport but also of all other airports in the Philippines except the major international airports.
The airport is one of the hubs of Sky Pasada.
Although the airport in the past was briefly served by international flights, the airport is not officially classified as an international airport.
Airlines and destinations[]
| Airlines | Destinations |
|---|---|
| AirSWIFT | Manila |
| Cebgo | Manila |
| Northsky Air | Itbayat, Tuguegarao |
| PAL Express | Clark, Manila[2] |
| Platinum Skies | Vigan |
| Royal Air Philippines | Charter: Clark |
| SkyJet Airlines | Manila |
| Sky Pasada | Tuguegarao |
Statistics[]
Data from Civil Aviation Authority of the Philippines[1]
Passenger movements[]
| Year | Domestic | Change |
|---|---|---|
| 2003 | 26,065 | |
| 2004 | 26,933 | |
| 2005 | 25,376 | |
| 2006 | 22,748 | |
| 2007 | 19,550 | |
| 2008 | 24,288 | |
| 2009 | 19,308 | |
| 2010 | 26,089 | |
| 2011 | 28,428 | |
| 2012 | 25,588 | |
| 2013 | 32,467 | |
| 2014 | 60,683 | |
| 2015 | 73,541 | |
| 2016 | 82,853 | |
| 2017 | 104,089 |
Aircraft movements[]
| Year | Domestic | Change |
|---|---|---|
| 2003 | 3,322 | |
| 2004 | 2,734 | |
| 2005 | 3,240 | |
| 2006 | 2,726 | |
| 2007 | 1,204 | |
| 2008 | 766 | |
| 2009 | 1,246 | |
| 2010 | 709 | |
| 2011 | 1,926 | |
| 2012 | 1,934 | |
| 2013 | 2,512 | |
| 2014 | 1,890 | |
| 2015 | 2,160 | |
| 2016 | 2,538 | |
| 2017 | 2,702 |
Cargo movements[]
| Year | Domestic | Change |
|---|---|---|
| 2003 | 247,978 | |
| 2004 | 280,210 | |
| 2005 | 346,017 | |
| 2006 | 378,055 | |
| 2007 | 344,832 | |
| 2008 | 301,968 | |
| 2009 | 10,980 | |
| 2010 | 386,512 | |
| 2011 | 388,150 | |
| 2012 | 361,389 | |
| 2013 | 510,172 | |
| 2014 | 701,712 | |
| 2015 | 866,985 | |
| 2016 | 1,122,039 | |
| 2017 | 1,299,048 |
See also[]
References[]
- ^ a b Civil Aviation Authority of the Philippines (23 July 2018). "Yearly Passenger, Cargo and Aircraft Movements of all airports in the Philippines 1997–2017". Republic of the Philippines – Freedom of Information Portal. Retrieved 28 September 2018.
- ^ Liu, Jim. "Philippine Airlines Clark / Manila domestic network changes from March 2020". Routesonline. Retrieved 2 March 2020.
This article about an airport in the Philippines is a stub. You can help Wikipedia by . |
- Airports in the Philippines
- Buildings and structures in Batanes
- Asian airport stubs
- Philippine building and structure stubs
- Philippines transportation stubs