Burnley Borough Council elections

Burnley shown within the non-metropolitan county of Lancashire (Unitary authorities excluded)
One third of Burnley Borough Council in Lancashire, England is elected each year, followed by one year without election. Since the last boundary changes in 2002, 45 councillors have been elected from 15 wards.[1] Burnley is a non-metropolitan district forming a lower-tier of local government under Lancashire County Council.
Political control[]

Coat of Arms of the Borough Council
Since the first election to the council in 1973 political control of the council has been held by the following parties:[2]
| Party | Period | |
|---|---|---|
| Labour | 1973–2000 | |
| No overall control | 2000–2001 | |
| Labour | 2001–2004 | |
| No overall control | 2003–2004 | |
| Liberal Democrats | 2008–2011 | |
| No overall control | 2011–2012 | |
| Labour | 2012–2019 | |
| No overall control | 2019 – present | |
Council elections[]
- (New ward boundaries)[3]
- (Borough boundary changes took place but the number of seats remained the same)[4]
- (New ward boundaries)[5]
- 1998 Burnley Borough Council election
- 1999 Burnley Borough Council election
- 2000 Burnley Borough Council election
- 2002 Burnley Borough Council election (New ward boundaries reduced the number of seats by 3)[6][7][8]
- 2003 Burnley Borough Council election
- 2004 Burnley Borough Council election
- 2006 Burnley Borough Council election
- 2007 Burnley Borough Council election
- 2008 Burnley Borough Council election
- 2010 Burnley Borough Council election
- 2011 Burnley Borough Council election
- 2012 Burnley Borough Council election
- 2014 Burnley Borough Council election
- 2015 Burnley Borough Council election
- 2016 Burnley Borough Council election
- 2018 Burnley Borough Council election
- 2019 Burnley Borough Council election
- 2021 Burnley Borough Council election
Result maps[]
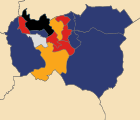 2003British National Party: 7Labour Party (UK): 5Liberal Democrats (UK): 2Conservative Party (UK): 1Independent (politician): 1
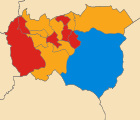 2010Liberal Democrats (UK): 9Labour Party (UK): 6Conservative Party (UK): 1
 2012Labour Party (UK): 11Liberal Democrats (UK): 2Conservative Party (UK): 2
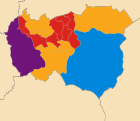 2016Labour Party (UK): 8Liberal Democrats (UK): 5Conservative Party (UK): 1UK Independence Party: 1
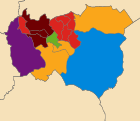 2019Labour Party (UK): 6Liberal Democrats (UK): 3Burnley and Padiham Independent Party: 3Conservative Party (UK): 1UK Independence Party: 1Green Party of England and Wales: 1


By-election results[]
1997-2001[]
| Party | Candidate | Votes | % | ±% | |
|---|---|---|---|---|---|
| Conservative | 611 | 59.4 | +11.6 | ||
| Labour | 417 | 40.6 | -11.6 | ||
| Majority | 194 | 18.8 | |||
| Turnout | 1,028 | ||||
| Conservative gain from Labour | Swing | ||||
2001–2005[]
| Party | Candidate | Votes | % | ±% | |
|---|---|---|---|---|---|
| Independent | Samuel Holgate | 467 | 38.8 | −33.0 | |
| Labour | 421 | 35.0 | +6.8 | ||
| BNP | 283 | 23.5 | +23.5 | ||
| Socialist Alliance | 32 | 2.7 | +2.7 | ||
| Majority | 46 | 3.8 | |||
| Turnout | 1,203 | 27.8 | |||
| Independent hold | Swing | ||||
| Party | Candidate | Votes | % | ±% | |
|---|---|---|---|---|---|
| Labour | Elizabeth Monk | 555 | 57.9 | +1.3 | |
| BNP | 181 | 18.9 | +18.9 | ||
| Independent | 172 | 18.0 | +18.0 | ||
| Socialist Alliance | 50 | 5.2 | +5.2 | ||
| Majority | 374 | 39.0 | |||
| Turnout | 958 | 28.8 | |||
| Labour hold | Swing | ||||
| Party | Candidate | Votes | % | ±% | |
|---|---|---|---|---|---|
| Labour | Denis Otter | 380 | 31.7 | +9.0 | |
| Independent | 284 | 23.7 | -24.1 | ||
| BNP | 230 | 19.2 | +19.2 | ||
| Liberal Democrats | 203 | 16.9 | +16.9 | ||
| Conservative | 101 | 8.4 | -21.1 | ||
| Majority | 96 | 8.0 | |||
| Turnout | 1,198 | 28.8 | |||
| Labour gain from Independent | Swing | ||||
| Party | Candidate | Votes | % | ±% | |
|---|---|---|---|---|---|
| Liberal Democrats | Peter McCann | 788 | 33.1 | +33.1 | |
| BNP | Andy Kenyon | 777 | 32.6 | -6.4 | |
| Labour | Andy Tatchell | 679 | 28.5 | -5.9 | |
| Independent | Patricia Stinton | 76 | 3.2 | -15.6 | |
| Conservative | Alan Marsden | 62 | 2.6 | -5.2 | |
| Majority | 11 | 0.5 | |||
| Turnout | 2,382 | 53.5 | |||
| Liberal Democrats gain from Labour | Swing | ||||
| Party | Candidate | Votes | % | ±% | |
|---|---|---|---|---|---|
| Liberal Democrats | Martin Smith | 1,070 | 50.6 | +32.0 | |
| Labour | Julie Cooper | 464 | 21.9 | -9.8 | |
| BNP | John Cave | 357 | 16.9 | -17.1 | |
| Independent | Ann Royle | 127 | 6.0 | -9.8 | |
| Conservative | Paul Coates | 98 | 4.6 | +4.6 | |
| Majority | 606 | 28.7 | |||
| Turnout | 2,116 | 48.2 | |||
| Liberal Democrats gain from BNP | Swing | ||||
2005–2009[]
| Party | Candidate | Votes | % | ±% | |
|---|---|---|---|---|---|
| Labour | Julie Cooper | 1,056 | 48.0 | −2.2 | |
| Liberal Democrats | Abdul Hamid | 514 | 23.3 | −2.7 | |
| BNP | Derek Dawson | 368 | 16.7 | +16.7 | |
| Conservative | Paul Coates | 266 | 12.0 | −11.8 | |
| Majority | 542 | 24.7 | |||
| Turnout | 2,204 | 53.5 | |||
| Labour hold | Swing | ||||
| Party | Candidate | Votes | % | ±% | |
|---|---|---|---|---|---|
| Liberal Democrats | Allen Harris | 875 | 44.1 | +16.3 | |
| BNP | Paul McDevitt | 538 | 27.1 | +0.6 | |
| Labour | Karen Baker | 479 | 24.2 | −6.7 | |
| Conservative | Tony Coulson | 90 | 4.5 | -10.2 | |
| Majority | 337 | 17.0 | |||
| Turnout | 1,982 | 39.9 | |||
| Liberal Democrats gain from Labour | Swing | ||||
| Party | Candidate | Votes | % | ±% | |
|---|---|---|---|---|---|
| Labour | Shah Hussain | 944 | 46.6 | -3.7 | |
| Liberal Democrats | Mohammed Malik | 906 | 44.7 | -5.0 | |
| England First | Steven Smith | 141 | 7.0 | +7.0 | |
| Conservative | Alan Marsden | 35 | 1.7 | +1.7 | |
| Majority | 38 | 1.9 | |||
| Turnout | 2,026 | 52.4 | |||
| Labour gain from Liberal Democrats | Swing | ||||
2009–2013[]
| Party | Candidate | Votes | % | ±% | |
|---|---|---|---|---|---|
| Liberal Democrats | Iris Gates | 645 | 41.2 | +1.1 | |
| BNP | John Cave | 400 | 25.6 | -5.4 | |
| Labour | Charles Baker | 304 | 19.4 | +1.0 | |
| Conservative | Barry Elliott | 215 | 13.7 | +3.4 | |
| Majority | 245 | 15.6 | |||
| Turnout | 1,564 | 32.8 | |||
| Liberal Democrats hold | Swing | ||||
| Party | Candidate | Votes | % | ±% | |
|---|---|---|---|---|---|
| Labour | Beatrice Foster | 521 | |||
| Liberal Democrats | Kate Mottershead | 261 | |||
| Conservative | Mathew Isherwood | 81 | |||
| BNP | Paul McDevitt | 288 | |||
| Independent | Andrew Hennessey | 58 | |||
| Majority | 233 | ||||
| Turnout | 1209 | ||||
| Labour gain from Liberal Democrats | Swing | ||||
| Party | Candidate | Votes | % | ±% | |
|---|---|---|---|---|---|
| Labour | Tony Martin | 493 | 49.25 | ||
| BNP | Derek Dawson | 95 | 9.6 | ||
| Liberal Democrats | Stephanie Forrest | 256 | 25.57 | ||
| Conservative | Tom Watson | 96 | 9.6 | ||
| UKIP | Craig James Ramplee | 35 | 3.5 | ||
| National Front | Steven Smith | 26 | 2.6 | ||
| Majority | 237 | ||||
| Turnout | 1,001 | ||||
| Labour hold | Swing | ||||
References[]
- ^ "Composition of the Council". Burnley Borough Council. Archived from the original on 15 June 2011. Retrieved 17 March 2010.
- ^ "Burnley". BBC News Online. 19 April 2008. Retrieved 20 December 2009.
- ^ "The Borough of Burnley (Electoral Arrangements) Order 1976". legislation.gov.uk. 13 February 1976. Retrieved 19 November 2015.
- ^ The Lancashire (District Boundaries) Order 1986
- ^ "The Borough of Burnley (Electoral Arrangements) Order 1990". legislation.gov.uk. 25 September 1990. Retrieved 4 November 2015.
- ^ "Burnley". BBC Online. Retrieved 13 November 2008.
- ^ "The Borough of Burnley (Electoral Changes) Order 2001". legislation.gov.uk. 3 July 2001. Retrieved 4 October 2015.
- ^ "The Borough of Burnley (Electoral Changes) (Amendment) Order 2002". legislation.gov.uk. 2 December 2002. Retrieved 4 October 2015.
- ^ Carter, Helen (21 June 2003). "Relief in Burnley at narrow BNP defeat". The Guardian. p. 12.
- ^ "BNP are beaten in by-election". Prestwich & Whitefield Guide. 17 October 2003. Retrieved 20 December 2009.[permanent dead link]
- ^ "Seats slip from BNP control". BBC News Online. 16 October 2003. Retrieved 20 December 2009.
- ^ "Declaration of result poll". Burnley Borough Council. Archived from the original on 15 June 2011. Retrieved 20 December 2009.
- ^ "DECLARATION OF RESULT POLL". Burnley.gov.uk. Archived from the original on 15 June 2011. Retrieved 13 November 2008.
- ^ "DECLARATION OF RESULT POLL". Burnley.gov.uk. Archived from the original on 15 June 2011. Retrieved 13 November 2008.
- ^ "Declaration of result poll". Burnley Borough Council. Archived from the original on 15 June 2011. Retrieved 20 December 2009.
- ^ http://www.burnley.gov.uk/site/scripts/documents_info.php?documentID=1133&categoryID=362&pageNumber=2[permanent dead link]
- ^ http://www.burnley.gov.uk/site/scripts/documents_info.php?documentID=1209&categoryID=362&pageNumber=8[permanent dead link]
- By-election results Archived 29 March 2010 at the Wayback Machine
External links[]
| show |
|---|
| show Culture and infrastructure of the Borough of Burnley |
|---|

Categories:
- Burnley Borough Council elections
- Council elections in Lancashire
- Local government in Burnley
- Politics of Burnley
- District council elections in England