City of Bradford Metropolitan District Council elections
This article uses bare URLs, which may be threatened by link rot. (May 2021) |
This article needs additional citations for verification. (June 2014) |
One third of City of Bradford Metropolitan District Council is elected each year, followed by one year without election.
Political control[]
- Conservative 1973–1980
- Labour 1980–1982
- No overall control 1982–1986
- Labour 1986–1988
- No overall control 1988–1990
- Labour 1990–2000
- No overall control 2000–2014
- Labour 2014–
Council elections[]
- 1973 City of Bradford Metropolitan District Council election
- 1975 City of Bradford Metropolitan District Council election
- 1976 City of Bradford Metropolitan District Council election
- 1978 City of Bradford Metropolitan District Council election
- 1979 City of Bradford Metropolitan District Council election
- 1980 City of Bradford Metropolitan District Council election
- 1982 City of Bradford Metropolitan District Council election
- 1983 City of Bradford Metropolitan District Council election
- 1984 City of Bradford Metropolitan District Council election
- 1986 City of Bradford Metropolitan District Council election
- 1987 City of Bradford Metropolitan District Council election
- 1988 City of Bradford Metropolitan District Council election
- 1990 City of Bradford Metropolitan District Council election
- 1991 City of Bradford Metropolitan District Council election
- 1992 City of Bradford Metropolitan District Council election
- 1994 City of Bradford Metropolitan District Council election
- 1995 City of Bradford Metropolitan District Council election
- 1996 City of Bradford Metropolitan District Council election
- 1998 City of Bradford Metropolitan District Council election
- 1999 City of Bradford Metropolitan District Council election
- 2000 City of Bradford Metropolitan District Council election
- 2002 City of Bradford Metropolitan District Council election
- 2003 City of Bradford Metropolitan District Council election
- 2004 City of Bradford Metropolitan District Council election
- 2006 City of Bradford Metropolitan District Council election
- 2007 City of Bradford Metropolitan District Council election
- 2008 City of Bradford Metropolitan District Council election
- 2010 City of Bradford Metropolitan District Council election
- 2011 City of Bradford Metropolitan District Council election
- 2012 City of Bradford Metropolitan District Council election
- 2014 City of Bradford Metropolitan District Council election
- 2015 City of Bradford Metropolitan District Council election
- 2016 City of Bradford Metropolitan District Council election
- 2018 City of Bradford Metropolitan District Council election
- 2019 City of Bradford Metropolitan District Council election
- 2021 City of Bradford Metropolitan District Council election
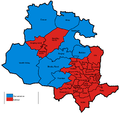
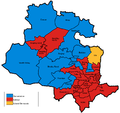
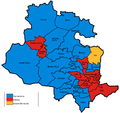
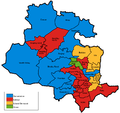
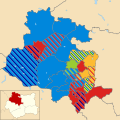
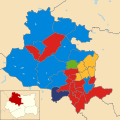
District result maps[]
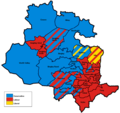
1980 results map

1982 results map

1983 results map

1984 results map

1986 results map

1987 results map

1988 results map
1990 results map
1991 results map
1992 results map

1994 results map

1995 results map

1996 results map

1998 results map

1999 results map

2000 results map

2002 results map
2003 results map
2004 results map

2006 results map
2007 results map

2008 results map

2010 results map

2011 results map

2012 results map

2014 results map

2015 results map

2016 results map

2018 results map

2019 results map

2021 results map


By-election results[]
| Party | Candidate | Votes | % | ±% | |
|---|---|---|---|---|---|
| Conservative | 2,041 | 50.4 | |||
| Labour | 1,808 | 44.6 | |||
| Liberal Democrats | 202 | 5.0 | |||
| Majority | 233 | 5.8 | |||
| Turnout | 4,051 | 34.8 | |||
| Conservative gain from Labour | Swing | ||||
| Party | Candidate | Votes | % | ±% | |
|---|---|---|---|---|---|
| Labour | 1,263 | 36.8 | -6.7 | ||
| Conservative | 1,222 | 35.6 | -0.6 | ||
| Green_Party_of_England_and_Wales | 667 | 19.4 | +8.0 | ||
| Liberal Democrats | 284 | 8.3 | -0.6 | ||
| Majority | 41 | 1.2 | |||
| Turnout | 3,436 | ||||
| Labour hold | Swing | ||||
| Party | Candidate | Votes | % | ±% | |
|---|---|---|---|---|---|
| Liberal Democrats | 1,614 | 52.3 | -1.0 | ||
| Conservative | 1,077 | 34.9 | -0.7 | ||
| Labour | 372 | 12.1 | +1.0 | ||
| Independent | 22 | 0.7 | +0.7 | ||
| Majority | 537 | 17.4 | |||
| Turnout | 3,085 | 24.6 | |||
| Liberal Democrats hold | Swing | ||||
| Party | Candidate | Votes | % | ±% | |
|---|---|---|---|---|---|
| Labour | 1,227 | 60.2 | +18.5 | ||
| Conservative | 538 | 26.4 | -14.2 | ||
| Liberal Democrats | 272 | 13.4 | +4.3 | ||
| Majority | 689 | 33.8 | |||
| Turnout | 2,037 | 17.0 | |||
| Labour hold | Swing | ||||
| Party | Candidate | Votes | % | ±% | |
|---|---|---|---|---|---|
| Labour | Tony Niland | 1,014 | 44.0 | -8.4 | |
| Conservative | Zameer Shah | 777 | 33.7 | +5.4 | |
| Liberal Democrats | Rupert Oliver | 473 | 20.5 | +8.6 | |
| Majority | 237 | 10.3 | |||
| Turnout | 2,264 | 18.6 | |||
| Labour hold | Swing | ||||
| Party | Candidate | Votes | % | ±% | |
|---|---|---|---|---|---|
| Labour | 3,217 | 45.5 | +16.0 | ||
| Conservative | 2,744 | 38.8 | -15.8 | ||
| Liberal Democrats | 892 | 12.6 | -4.6 | ||
| Independent | 203 | 2.9 | -2.0 | ||
| Asian | 13 | 0.2 | +0.2 | ||
| Majority | 473 | 6.7 | |||
| Turnout | 7,069 | 53.3 | |||
| Labour hold | Swing | ||||
| Party | Candidate | Votes | % | ±% | |
|---|---|---|---|---|---|
| Conservative | Juliette Kinsey | 1,576 | 65.2 | -0.7 | |
| Labour | James Newton | 642 | 26.6 | +4.7 | |
| Liberal Democrats | James Stewart | 150 | 6.2 | -2.4 | |
| Green_Party_of_England_and_Wales | John Love | 50 | 2.1 | -1.9 | |
| Majority | 934 | 38.6 | |||
| Turnout | 2,418 | 20.0 | |||
| Conservative hold | Swing | ||||
| Party | Candidate | Votes | % | ±% | |
|---|---|---|---|---|---|
| Labour | Liz Devlin | 926 | 36.9 | -0.9 | |
| Conservative | Richard Milczanowski | 764 | 30.4 | +8.3 | |
| Liberal Democrats | Paul Michell | 692 | 27.6 | +10.5 | |
| Green_Party_of_England_and_Wales | Derek Curtis | 129 | 5.1 | -1.5 | |
| Majority | 162 | 6.5 | |||
| Turnout | 2,511 | 23.4 | |||
| Labour gain from Conservative | Swing | ||||
| Party | Candidate | Votes | % | ±% | |
|---|---|---|---|---|---|
| Conservative | Andrew Naylor | 1,304 | 57.0 | +13.4 | |
| Labour | Steven Carter | 669 | 29.2 | +10.7 | |
| Liberal Democrats | Frances McAulay | 315 | 13.8 | -3.7 | |
| Majority | 635 | 27.8 | |||
| Turnout | 2,288 | 18.7 | |||
| Conservative hold | Swing | ||||
| Party | Candidate | Votes | % | ±% | |
|---|---|---|---|---|---|
| Labour | Angela Sinfield | 1,819 | 47.0 | +22.2 | |
| BNP | Ian Dawson | 1,216 | 31.4 | +2.3 | |
| Conservative | Lionel Lockley | 627 | 16.2 | -3.8 | |
| Liberal Democrats | Victoria Salmons | 208 | 5.4 | -4.8 | |
| Majority | 603 | 15.6 | |||
| Turnout | 3,870 | 35.1 | |||
| Labour gain from BNP | Swing | ||||
| Party | Candidate | Votes | % | ±% | |
|---|---|---|---|---|---|
| Conservative | John Allan Pennington | 1,949 | |||
| Labour | Andrew David Mawson | 689 | |||
| Liberal Democrats | Jean Taylor | 332 | |||
| Green | Arthur Albert John Arnold | 175 | |||
| Democratic Nationalists | Jim Lewthwaite | 61 | |||
| UKIP | Jason Paul Smith | 49 | |||
| Majority | 1,260 | ||||
| Turnout | 3,262 | 24.99 | |||
| Party | Candidate | Votes | % | ±% | |
|---|---|---|---|---|---|
| Conservative | Russell Brown | 1,020 | |||
| Labour | Mark Bernard Curtis | 697 | |||
| Green | Robert Edward Swindells | 235 | |||
| Liberal Democrats | Sharon Catherine Purvis | 180 | |||
| Majority | 323 | ||||
| Turnout | 2,139 | 19.46 | |||
| Party | Candidate | Votes | % | ±% | |
|---|---|---|---|---|---|
| Labour | Abdul Jabar | 1,993 | 58.6 | -1.1 | |
| Conservative | Mehrban Hussain | 705 | 20.7 | -5.0 | |
| Liberal Democrats | Mary Slingsby | 337 | 9.9 | -3.3 | |
| UKIP | Jason Paul Smith | 294 | 8.6 | (+8.6) | |
| Green_Party_of_England_and_Wales | Celia Ruth Hickson | 73 | 2.1 | (+2.1) | |
| Majority | 1,288 | 37.9 | +3.9 | ||
| Turnout | 3,402 | 27.1 | -8.5 | ||
| Labour hold | Swing | 3.9 | |||
| Party | Candidate | Votes | % | ±% | |
|---|---|---|---|---|---|
| Conservative | Jackie Whiteley | 1,353 | 54.03 | −6.77 | |
| Labour | David Green | 485 | 19.37 | +0.63 | |
| Green | Janet Souyave | 320 | 12.78 | −2.47 | |
| Liberal Democrats | Paul Treadwell | 222 | 8.87 | +3.66 | |
| UKIP | Samuel Fletcher | 124 | 4.95 | N/A | |
| Majority | 868 | 34.66 | |||
| Turnout | 2,516 | 27.51 | −13.02 | ||
| Conservative hold | Swing | ||||
| Party | Candidate | Votes | % | ±% | |
|---|---|---|---|---|---|
| Labour | Joanne Lisa Sharp | 1,207 | 51 | ||
| UKIP | Jason Paul Smith | 655 | 27 | ||
| Conservative | Richard Ian Sheard | 451 | 19 | ||
| Liberal Democrats | Angharad Elizabeth Griffiths | 70 | 3 | ||
| Majority | 552 | 23 | |||
| Turnout | 2,383 | 23 | |||
| Labour hold | Swing | ||||
| Party | Candidate | Votes | % | ±% | |
|---|---|---|---|---|---|
| Conservative | Andrew John Senior | 2,175 | 56 | ||
| Independent | Jason Paul Smith | 732 | 19 | ||
| Labour | Mobeen Hussain | 697 | 18 | ||
| Green | Eithne Mary Dodwell | 143 | 4 | ||
| Liberal Democrats | Mary Whitrick | 135 | 3 | ||
| Majority | 1,443 | 37 | |||
| Turnout | 3,882 | 32 | |||
| Conservative hold | Swing | ||||
References[]
- ^ http://www.bradford.gov.uk/NR/rdonlyres/3D13E4E6-DACB-4602-8FC8-AA8B9E64CE4E/0/PCS67071.pdf
- ^ http://www.bradford.gov.uk/NR/rdonlyres/BDEFEE7A-A66E-461E-8924-7CC2D0899C0B/0/RESULTOFPOLL.pdf
- ^ Wharfedale Ward By-Election, 2017. Bradford City Council.
- ^ Wibsey Ward By-Election, 2017. Bradford City Council.
- ^ Queensbury Ward By-Election, 2017. Bradford City Council.
External links[]
| Mayor |
|
|---|---|
| Bradford | |
| Calderdale | |
| Kirklees | |
| Leeds |
|
| Wakefield | |
| West Riding CC | |
| |
Metropolitan districts of England | ||
|---|---|---|
| Districts |
|  |
| Councils |
| |
| Local elections |
| |
Categories:
- City of Bradford Metropolitan District Council elections
- Council elections in West Yorkshire
- Elections in Bradford
- Local government in Bradford
- Metropolitan borough council elections in England