Clarin, Bohol
Clarin | |
|---|---|
| Municipality of Clarin | |
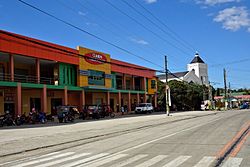 Clarin – market and church (new 2016) | |
 Flag  Seal | |
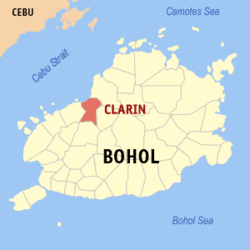 Map of Bohol with Clarin highlighted | |
OpenStreetMap  | |
 Clarin Location within the Philippines | |
| Coordinates: 9°58′N 124°01′E / 9.97°N 124.02°ECoordinates: 9°58′N 124°01′E / 9.97°N 124.02°E | |
| Country | Philippines |
| Region | Central Visayas |
| Province | Bohol |
| District | 2nd district |
| Founded | 31 January 1919 |
| Barangays | 24 (see Barangays) |
| Government | |
| • Type | Sangguniang Bayan |
| • Mayor | Eugeniano E. Ibarra |
| • Vice Mayor | Allen Ray Z. Piezas |
| • Representative | Erico Aristotle C. Aumentado |
| • Municipal Council | Members |
| • Electorate | 15,338 voters (2019) |
| Area | |
| • Total | 52.12 km2 (20.12 sq mi) |
| Elevation | 61 m (200 ft) |
| Highest elevation | 294 m (965 ft) |
| Lowest elevation | −1 m (−3 ft) |
| Population (2020 census) [3] | |
| • Total | 21,158 |
| • Density | 410/km2 (1,100/sq mi) |
| • Households | 4,600 |
| Economy | |
| • Income class | 5th municipal income class |
| • Poverty incidence | 22.91% (2015)[4] |
| • Revenue | ₱90,851,263.62 (2020) |
| • Assets | ₱293,154,931.41 (2020) |
| • Expenditure | ₱113,597,539.67 (2020) |
| • Liabilities | ₱52,175,050.51 (2020) |
| Service provider | |
| • Electricity | Bohol 1 Electric Cooperative (BOHECO 1) |
| Time zone | UTC+8 (PST) |
| ZIP code | 6330 |
| PSGC | |
| IDD : area code | +63 (0)38 |
| Native languages | Boholano dialect Cebuano Tagalog |

Clarin, officially the Municipality of Clarin (Cebuano: Munisipyo sa Clarin; Tagalog: Bayan ng Clarin), is a 5th class municipality in the province of Bohol, Philippines. According to the 2020 census, it has a population of 21,158 people. [3]
Geography[]

Clarin is bounded by Tubigon in the west, Inabanga in the NE, Sagbayan in the east, and Catigbian in the south.
Barangays[]
Clarin comprises 24 barangays:
| PSGC | Barangay | Population | ±% p.a. | |||
|---|---|---|---|---|---|---|
| 2020 [3] | 2010 [5] | |||||
| 071214001 | Bacani | 5.6% | 1,185 | 1,208 | −0.18% | |
| 071214002 | Bogtongbod | 6.7% | 1,428 | 1,377 | 0.34% | |
| 071214003 | Bonbon | 6.7% | 1,427 | 1,487 | −0.39% | |
| 071214004 | Bontud | 2.3% | 497 | 456 | 0.81% | |
| 071214005 | Buacao | 3.0% | 644 | 797 | −1.98% | |
| 071214006 | Buangan | 3.9% | 824 | 796 | 0.32% | |
| 071214007 | Cabog | 3.9% | 829 | 764 | 0.77% | |
| 071214008 | Caboy | 2.7% | 569 | 571 | −0.03% | |
| 071214009 | Caluwasan | 1.2% | 255 | 222 | 1.31% | |
| 071214010 | Candajec | 5.0% | 1,061 | 932 | 1.22% | |
| 071214011 | Cantoyoc | 1.6% | 346 | 343 | 0.08% | |
| 071214012 | Comaang | 2.4% | 498 | 471 | 0.52% | |
| 071214013 | Danahao | 3.3% | 693 | 856 | −1.96% | |
| 071214014 | Katipunan | 1.4% | 301 | 340 | −1.14% | |
| 071214015 | Lajog | 6.0% | 1,262 | 1,381 | −0.84% | |
| 071214016 | Mataub | 3.0% | 632 | 700 | −0.95% | |
| 071214017 | Nahawan | 10.4% | 2,202 | 2,208 | −0.03% | |
| 071214018 | Poblacion Centro | 6.1% | 1,285 | 1,234 | 0.38% | |
| 071214019 | Poblacion Norte | 3.9% | 831 | 838 | −0.08% | |
| 071214020 | Poblacion Sur | 5.9% | 1,246 | 1,159 | 0.68% | |
| 071214021 | Tangaran | 3.7% | 776 | 850 | −0.85% | |
| 071214022 | Tontunan | 2.8% | 593 | 559 | 0.56% | |
| 071214023 | Tubod | 2.3% | 484 | 402 | 1.76% | |
| 071214024 | Villaflor | 2.0% | 423 | 345 | 1.93% | |
| Total | 21,158 | 20,296 | 0.39% | |||
Climate[]
| Climate data for Clarin, Bohol | |||||||||||||
|---|---|---|---|---|---|---|---|---|---|---|---|---|---|
| Month | Jan | Feb | Mar | Apr | May | Jun | Jul | Aug | Sep | Oct | Nov | Dec | Year |
| Average high °C (°F) | 28 (82) |
28 (82) |
29 (84) |
31 (88) |
31 (88) |
30 (86) |
30 (86) |
30 (86) |
30 (86) |
29 (84) |
29 (84) |
28 (82) |
29 (85) |
| Average low °C (°F) | 23 (73) |
23 (73) |
23 (73) |
23 (73) |
24 (75) |
24 (75) |
24 (75) |
24 (75) |
24 (75) |
24 (75) |
24 (75) |
23 (73) |
24 (74) |
| Average precipitation mm (inches) | 98 (3.9) |
82 (3.2) |
96 (3.8) |
71 (2.8) |
104 (4.1) |
129 (5.1) |
101 (4.0) |
94 (3.7) |
99 (3.9) |
135 (5.3) |
174 (6.9) |
143 (5.6) |
1,326 (52.3) |
| Average rainy days | 18.0 | 14.1 | 17.1 | 16.8 | 23.7 | 25.7 | 25.8 | 23.3 | 24.2 | 25.9 | 24.0 | 20.6 | 259.2 |
| Source: Meteoblue (modeled/calculated data, not measured locally) [6] | |||||||||||||
History[]
Clarin was formed on 31 January 1919 from five barrios of Tubigon by virtue of proclamation by Governor General Francis Burton Harrison,[7][8] hence it celebrated its centennial in 2019.
Clarin was severely affected by the 2013 Bohol earthquake which damaged 1358 homes, of which 221 were totally destroyed, as well as the Catholic church.[9]

Roman Catholic Church before earthquake
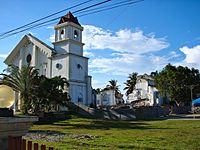
Roman Catholic Church after earthquake


Demographics[]
| Year | Pop. | ±% p.a. |
|---|---|---|
| 1939 | 15,809 | — |
| 1948 | 15,005 | −0.58% |
| 1960 | 10,248 | −3.13% |
| 1970 | 11,723 | +1.35% |
| 1975 | 13,105 | +2.26% |
| 1980 | 13,721 | +0.92% |
| 1990 | 16,021 | +1.56% |
| 1995 | 15,961 | −0.07% |
| 2000 | 18,040 | +2.66% |
| 2007 | 18,871 | +0.62% |
| 2010 | 20,296 | +2.68% |
| 2015 | 20,301 | +0.00% |
| 2020 | 21,158 | +0.82% |
| Source: Philippine Statistics Authority [10] [5] [11][12] | ||
Economy[]
| Poverty Incidence of Clarin | |
| Source: Philippine Statistics Authority[13][14][15][16][17][18] | |
Education[]
-
- Bacani Elementary School
- Bogtongbod Elementary School
- Bonbon Elementary School
- Buacao Primary School
- Buangan Elementary School
- Buntod Primary School
- Caboy Elementary School
- Clarin Central Elementary School
- Danahaw Elementary School
- Lajog Elementary School
- Nahawan Elementary School
- Tontunan Elementary School
-
- Clarin National School of Fisheries
- Nahawan High School
References[]
- ^ Municipality of Clarin | (DILG)
- ^ "2015 Census of Population, Report No. 3 – Population, Land Area, and Population Density" (PDF). Philippine Statistics Authority. Quezon City, Philippines. August 2016. ISSN 0117-1453. Archived (PDF) from the original on May 25, 2021. Retrieved July 16, 2021.
- ^ a b c Census of Population (2020). "Region VII (Central Visayas)". Total Population by Province, City, Municipality and Barangay. PSA. Retrieved 8 July 2021.
- ^ https://psa.gov.ph/sites/default/files/City%20and%20Municipal-level%20Small%20Area%20Poverty%20Estimates_%202009%2C%202012%20and%202015_0.xlsx; publication date: 10 July 2019; publisher: Philippine Statistics Authority.
- ^ a b Census of Population and Housing (2010). "Region VII (Central Visayas)". Total Population by Province, City, Municipality and Barangay. NSO. Retrieved 29 June 2016.
- ^ "Clarin: Average Temperatures and Rainfall". Meteoblue. Retrieved 9 May 2020.
- ^ "Historical Background of Tubigon". Welcome to Tubigon, Bohol, Philippines. 2007-06-11. Archived from the original on 2007-10-09. Retrieved 2009-06-15.
- ^ "Municipality of Clarin". Provincial Government of Bohol. Archived from the original on 2009-01-24. Retrieved 2009-06-15.
- ^ "SitRep No. 35 re Effects of Magnitude 7.2 Sagbayan, Bohol Earthquake" (PDF). National Disaster Risk Reduction and Management Council. November 3, 2013. Retrieved December 17, 2013.
- ^ Census of Population (2015). "Region VII (Central Visayas)". Total Population by Province, City, Municipality and Barangay. PSA. Retrieved 20 June 2016.
- ^ Censuses of Population (1903–2007). "Region VII (Central Visayas)". Table 1. Population Enumerated in Various Censuses by Province/Highly Urbanized City: 1903 to 2007. NSO.
- ^ "Province of Bohol". Municipality Population Data. Local Water Utilities Administration Research Division. Retrieved 17 December 2016.
- ^ "Poverty incidence (PI):". Philippine Statistics Authority. Retrieved 28 December 2020.
- ^ https://psa.gov.ph/sites/default/files/NSCB_LocalPovertyPhilippines_0.pdf; publication date: 29 November 2005; publisher: Philippine Statistics Authority.
- ^ https://psa.gov.ph/sites/default/files/2003%20SAE%20of%20poverty%20%28Full%20Report%29_1.pdf; publication date: 23 March 2009; publisher: Philippine Statistics Authority.
- ^ https://psa.gov.ph/sites/default/files/2006%20and%202009%20City%20and%20Municipal%20Level%20Poverty%20Estimates_0_1.pdf; publication date: 3 August 2012; publisher: Philippine Statistics Authority.
- ^ https://psa.gov.ph/sites/default/files/2012%20Municipal%20and%20City%20Level%20Poverty%20Estima7tes%20Publication%20%281%29.pdf; publication date: 31 May 2016; publisher: Philippine Statistics Authority.
- ^ https://psa.gov.ph/sites/default/files/City%20and%20Municipal-level%20Small%20Area%20Poverty%20Estimates_%202009%2C%202012%20and%202015_0.xlsx; publication date: 10 July 2019; publisher: Philippine Statistics Authority.
External links[]
| Wikimedia Commons has media related to Clarin, Bohol. |
- Clarin Profile at PhilAtlas.com
- Philippine Standard Geographic Code
- Municipality of Clarin
- Municipality of Clarin
- Bohol
Places adjacent to Clarin, Bohol | ||||||||||||||||
|---|---|---|---|---|---|---|---|---|---|---|---|---|---|---|---|---|
| ||||||||||||||||
Tagbilaran (capital) | |
| Municipalities |
|
| Component city | |
| Islands | |
- Municipalities of Bohol