Closing milestones of the S&P 500

From Wikipedia, the free encyclopedia

This article is a summary of the closing milestones of the S&P 500 Index, a United States stock market index. Since first closing at 16.66 on January 3, 1950, the S&P 500 has increased, despite several periods of decline.

History[]

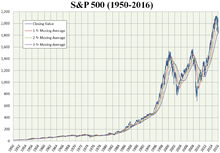
S&P 5.00 Index from 1950 to 2016

Standard & Poor's, initially known as the Standard Statistics Company, created its first stock market index in 1923. It consisted of 233 different stocks and was computed on a weekly basis. Three years later, it developed a 90 component composite price index that was computed on a daily basis; that was expanded over the years. On March 4, 1957, the Standard & Poor's 500 (.INX) (.SPX) was introduced.

Milestone highs[]

  • March 24, 2000: The S&P 500 index reaches an all-time intraday high of 1,552.87 during the dot-com bubble.
  • October 9, 2007: Index closes at a record high of 1,565.15, the highest close prior to the financial crisis of 2007–2008. Two days later, the index hits an intraday record high of 1,576.09. It did not regain this closing level until March 28, 2013.
  • February 19, 2020: The S&P 500 index reached its highest point in the bull market that started from the low point on March 9, 2009, closing at 3386.15.
  • August 18, 2020: The S&P 500 index closed at a record high of 3389.78 amid the ongoing COVID-19 pandemic in the United States.

Milestone lows[]

Milestone changes[]

  • October 19, 1987: S&P 500 registers its largest daily percentage loss, falling 20.47 percent. The one-day crash, known as "Black Monday," was blamed on program trading and those using a hedging strategy known as portfolio insurance. Despite the losses, the S&P 500 still closed positive for the year.
  • February 5, 2018: After months of low volatility, S&P 500 registers a new largest daily point loss of 113.19 points, equivalent to more than 4%. Three days later, the index suffered another heavy loss of nearly the same amount.[1]
  • October 13, 2008: S&P 500 marks its best daily percentage gain, rising 11.58 percent. It also registers its then-largest single-day point increase of 104.13 points.
  • December 26, 2018: While on pace for the worst December performance since the Great Depression, S&P 500 registers a new largest daily point gain of 116.60 points, which translates to roughly 5% on the index.[2]
  • December 31, 2008: For the year, S&P 500 falls 38.49 percent, its worst yearly percentage loss. In September 2008, Lehman Brothers collapsed as the financial crisis spread.
  • March 16, 2020: The S&P 500 index suffered its worst daily decline since 1987's Black Monday, falling 9.5 percent, as a result of anxiety about the coronavirus pandemic.[3] The decline of more than 20% since its peak, only 16 trading days earlier, signaled the start of a bear market closing at 2,480.64.

Records[]

Price index[]

Category All-time highs[4] All-time lows
Closing 4,796.56 Monday, January 3, 2022 16.66 Tuesday, January 3, 1950
Intraday 4,818.62 Tuesday, January 4, 2022 16.66 Tuesday, January 3, 1950

Total return index[]

The total return index takes dividends into account.

Category All-time highs[5]
Closing 10,050.41 Monday, January 3, 2021
Intraday 10,097.30 Tuesday, January 4, 2022

Incremental closing milestones[]

The following is a list of the milestone closing levels of the S&P 500. 1-point increments are used up to the 20-point level; 2 to 50; 5 to 100; 10 to 500; 20 to 1,000; 50 to 3,000; and 100-point increments thereafter. Bold formatting is applied to every five milestones, excluding peaks.[6]

The Post-World War II Boom (1949–1966)[]

Milestone Closing level Date first achieved
16.66[a] 16.66 January 3, 1950
17 17.08 January 9, 1950
18 18.03 April 18, 1950
19 19.14 June 8, 1950
20 20.00 October 4, 1950
22 22.20 February 5, 1951
24 24.16 January 14, 1952
26 26.04 December 12, 1952
28 28.18 April 29, 1954
30 30.14 July 9, 1954
32 32.00 September 22, 1954
34 34.03 November 23, 1954
36 36.75 January 3, 1955
38 38.27 April 18, 1955
40 40.10 June 17, 1955
42 43.18 July 6, 1955
44 44.19 September 12, 1955
46 46.41 November 14, 1955
48 48.14 March 16, 1956
50 50.06 September 30, 1958
55 55.21 December 31, 1958
60 60.01 July 7, 1959
65 65.06 March 30, 1961
70 70.01 November 6, 1961
75 75.02 December 31, 1963
80 80.02 April 6, 1964
85 85.04 October 8, 1964
90 90.27 May 13, 1965

The 1970s Bear Market (1967–1973)[]

Milestone Closing level Date first achieved
94.06[b] 94.32 May 4, 1967
95 95.37 August 1, 1967
100 100.38 June 4, 1968
110 110.18 April 12, 1972
120 120.24 January 11, 1973

The Early 1980s Bull Depression (1980–1982)[]

Milestone Closing level Date first achieved
120.24[c] 121.44 July 17, 1980
130 130.40 September 22, 1980
140 140.40 November 20, 1980

The Mid-1980s Bull Market (1982–1987)[]

Milestone Closing level Date first achieved
140.52[d] 142.87 November 3, 1982
150 150.88 March 1, 1983
160 160.71 April 20, 1983
170 170.53 June 21, 1983
180 180.35 February 4, 1985
190 190.04 June 4, 1985
200 201.41 November 21, 1985
210 212.02 December 16, 1985
220 222.45 February 18, 1986
230 231.69 March 11, 1986
240 242.22 April 16, 1986
250 250.84 June 30, 1986
260 260.30 January 12, 1987
270 273.91 January 22, 1987
280 281.16 February 5, 1987
290 290.52 March 5, 1987
300 301.16 March 23, 1987
310 310.68 July 14, 1987
320 322.09 August 6, 1987
330 333.99 August 14, 1987

The 1990s Technology Bubble (1989–2000)[]

Milestone Closing level Date first achieved
336.77[e] 338.05 July 26, 1989
340 341.99 July 27, 1989
350 351.52 August 24, 1989
360 360.65 May 29, 1990
370 370.47 March 1, 1991
380 380.40 April 12, 1991
390 390.45 April 17, 1991
400 404.84 December 26, 1991
410 415.14 December 30, 1991
420 420.44 January 14, 1992
430 430.16 November 27, 1992
440 441.28 December 18, 1992
450 454.71 March 8, 1993
460 460.13 August 25, 1993
470 470.54 December 27, 1993
480 481.61 January 31, 1994
490 490.05 March 13, 1995
500 500.97 March 24, 1995
520 520.48 May 3, 1995
540 545.22 June 19, 1995
560 560.89 July 12, 1995
580 583.61 September 14, 1995
600 600.07 November 17, 1995
620 620.18 December 6, 1995
640 641.43 February 5, 1996
660 661.45 February 12, 1996
680 680.54 September 13, 1996
700 701.46 October 4, 1996
720 724.59 November 6, 1996
740 742.16 November 19, 1996
760 768.86 January 14, 1997
780 782.72 January 21, 1997
800 802.77 February 12, 1997
820 830.29 May 5, 1997
840 841.88 May 15, 1997
860 862.91 June 9, 1997
880 883.46 June 12, 1997
900 904.03 July 2, 1997
920 925.76 July 15, 1997
940 940.30 July 24, 1997
960 960.32 August 6, 1997
980 983.12 October 7, 1997
1,000 1,001.27 February 2, 1998
1,050 1,052.02 March 3, 1998
1,100 1,105.65 March 24, 1998
1,150 1,157.33 July 6, 1998
1,200 1,202.84 December 21, 1998
1,250 1,272.34 January 6, 1999
1,300 1,307.26 March 15, 1999
1,350 1,358.63 April 12, 1999
1,400 1,403.28 July 9, 1999
1,450 1,458.34 December 23, 1999
1,500 1,500.64 March 22, 2000

The Mid-2000s Cyclical Bull Market (2007)[]

Milestone Closing level Date first achieved
1,527.46[f] 1,530.23 May 30, 2007
1,550 1,552.50 July 13, 2007

The Mid 2010s Bull Market (2013-2020)[]

Milestone Closing level Date first achieved
1,565.15[g] 1,569.19 March 28, 2013
1,600 1,614.42 May 3, 2013
1,650 1,650.34 May 14, 2013
1,700 1,706.87 August 1, 2013
1,750 1,754.67 October 22, 2013
1,800 1,804.76 November 22, 2013
1,850 1,854.29 February 27, 2014
1,900 1,900.53 May 23, 2014
1,950 1,951.27 June 9, 2014
2,000 2,000.02 August 26, 2014
2,050 2,051.80 November 18, 2014
2,100 2,100.34 February 17, 2015
2,130.82[h] 2,137.16 July 11, 2016
2,150 2,152.14 July 12, 2016
2,200 2,202.94 November 22, 2016
2,250 2,259.53 December 9, 2016
2,300[i] 2,307.87 February 9, 2017
2,350 2,351.16 February 17, 2017
2,400[j] 2,402.32 May 15, 2017
2,450 2,453.46 June 19, 2017
2,500 2,500.23 September 15, 2017
2,550 2,552.07 October 5, 2017
2,600 2,602.42 November 24, 2017
2,650 2,651.50 December 8, 2017
2,700 2,713.06 January 3, 2018
2,750 2,751.29 January 9, 2018
2,800 2,802.56 January 17, 2018
2,850 2,872.87 January 26, 2018
2,900 2,914.04 August 29, 2018
2,930.75[k] 2,933.68 April 23, 2019
2,950 2,954.18 June 20, 2019
3,000 3,013.77 July 12, 2019
3,100 3,120.46 November 15, 2019
3,200 3,205.37 December 19, 2019
3,300 3,316.81 January 16, 2020

Bull Recession of 2020-21[]

Milestone Closing Level Date First Achieved
3,386.15[l] 3,389.78 August 18, 2020
3,400 3,431.30 August 24, 2020
3,500 3,508.01 August 28, 2020
3,600 3,626.91 November 16, 2020
3,700 3,702.25 December 8, 2020
3,800 3,803.79 January 7, 2021
3,900 3,915.59 February 8, 2021
4,000 4,019.87 April 1, 2021
4,100 4,128.80 April 9, 2021
4,200 4,211.47 April 29, 2021
4,300 4,319.94 July 1, 2021
4,400 4,411.79 July 23, 2021
4,500 4,509.37 August 27, 2021
4,600 4,605.38 October 29, 2021
4,700 4,701.70 November 8, 2021

List of 1000-point milestones by number of trading days[]

Milestone
(closing)
Date of Record Trading Days
1,000 February 2, 1998[m] 12,186[m]
2,000 August 26, 2014 4,168
3,000 July 12, 2019 1,227[9]
4,000 April 1, 2021 434[9]

See also[]

Notes[]

  1. ^ This was the S&P 500's very first close on January 3, 1950.
  2. ^ This was the S&P 500's close at the peak on February 9, 1966.
  3. ^ This was the S&P 500's close at the peak on January 11, 1973 before the 1973–74 stock market crash.
  4. ^ This was the S&P 500's close at the peak on November 28, 1980.
  5. ^ This was the S&P 500's close at the peak on August 25, 1987 before Black Monday.
  6. ^ This was the S&P 500's close at the peak on March 24, 2000 before the dot-com crash.[7]
  7. ^ This was the S&P 500's close at the peak on October 9, 2007 before the financial crisis of 2007–2008.
  8. ^ This was the S&P 500's close at the peak on May 21, 2015 before the 2015-16 stock market selloff.
  9. ^ The S&P first crossed 2,300 during the day on January 26, 2017 before falling below the level at closing. After that, the S&P retreated away from the 2,300-pt milestone for a possible selloff in the next month. It took two weeks for the S&P to finally close above 2,300.
  10. ^ The S&P first crossed 2,400 during the day on March 1, 2017 before falling below the level at closing. After that, the S&P retreated away from the 2,400-pt milestone and then closed within 1 point of the milestone on May 5, 2017. Then on May 8, 2017, the S&P traded above 2,400 intraday then closed below that milestone again and did it the third time the very next day. However, it took until May 15, 2017 for the S&P to finally close above 2,400.
  11. ^ This was the S&P 500's close at the peak on September 20, 2018 prior to the rapid selloff within the last quarter of the same year. While a 20% decline was recognized on an intraday-basis, the threshold was not met on a closing-basis, leading some to call it a correction and others a bear market.[8]
  12. ^ After peaking on February 19, 2020, the S&P 500 Index rapidly fell into correction later that same month and into bear market territory in the next month amid the COVID-19 pandemic.
  13. ^ a b From January 3, 1950.

References[]

  1. ^ Calculations, Ironman at Political (2018-02-12). "A Continuing Wild Ride For The S&P 500 In Week 1 Of February 2018". Seeking Alpha. Retrieved 2018-03-12.
  2. ^ GmbH, finanzen net. "Dow jumps 1,086 points to post its biggest point gain on record as stocks storm back from worst-ever Christmas Eve | Markets Insider". markets.businessinsider.com. Retrieved 2018-12-29.
  3. ^ "Dow endures worst day since 'Black Monday'; S&P 500 enters bear market as coronavirus spreads economic gloom". USA Today. Retrieved 2020-03-13.
  4. ^ "S&P 500 (^GSPC) Historical Data - Yahoo Finance". finance.yahoo.com (in American English). Retrieved 2020-12-03.
  5. ^ "S&P 500 (TR) (^SP500TR) Stock Price, Quote, History & News". finance.yahoo.com (in American English). Retrieved 2020-12-03.{{cite web}}: CS1 maint: url-status (link)
  6. ^ Yahoo, Inc. "^GSPC Historical Prices | S&P 500 Stock - Yahoo! Finance". Retrieved 3 May 2013.
  7. ^ Paradis, Tim (May 3, 2007). "Stocks Rise; S&P 500 Passes 1,500". The Washington Post. Associated Press. Retrieved July 5, 2014.
  8. ^ Kimble, Chris (2018-12-20). "Stock Market Correction or Bear Market? 2018 Echoes Of 2000 & 2007". See It Market (in American English). Retrieved 2019-04-23.
  9. ^ a b "S&P 500 Hits Record, Closes Above 4000 for First Time". wsj.com (in American English). Retrieved 2021-04-01.
Retrieved from ""