S&P 500
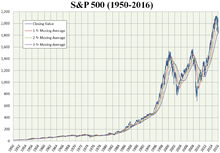 S&P 500 Index from 1950 to 2016 | |
| Foundation | March 4, 1957[1] |
|---|---|
| Operator | S&P Dow Jones Indices[2] |
| Exchanges |
|
| Constituents | 505[2] |
| Type | Large-cap[2] |
| Market cap | US$42.4 trillion (as of January 3, 2022)[3] |
| Weighting method | Free-float capitalization-weighted[4] |
| Related indices | |
| Website | www |


The Standard and Poor's 500,[2] or simply the S&P 500,[5] is a stock market index tracking the performance of 500 large companies listed on stock exchanges in the United States. It is one of the most commonly followed equity indices. As of December 31, 2020, more than $5.4 trillion was invested in assets tied to the performance of the index.[2]
The S&P 500 index is a free-float weighted/capitalization-weighted index. As of September 30, 2021, the nine largest companies on the list of S&P 500 companies accounted for 28.1% of the market capitalization of the index and were, in order of weighting, Apple, Microsoft, Alphabet (including both class A & C shares), Amazon.com, Facebook, Tesla, Nvidia, Berkshire Hathaway and JPMorgan Chase.[3] The components that have increased their dividends in 25 consecutive years are known as the S&P 500 Dividend Aristocrats.[6]: 25
In 2017, companies in the index derived on average 72% of their revenue in the United States.[7]
The index is one of the factors in computation of the Conference Board Leading Economic Index, used to forecast the direction of the economy.[8]
The index is associated with many ticker symbols, including ^GSPC,[9] INX,[10] and $SPX, depending on market or website.[11]
The S&P 500 is maintained by S&P Dow Jones Indices, a joint venture majority-owned by S&P Global, and its components are selected by a committee.[12][13]
Investing in the S&P 500[]
Mutual and exchange-traded funds[]
Index funds, including mutual funds and exchange-traded funds (ETFs), can replicate, before fees and expenses, the performance of the index by holding the same stocks as the index in the same proportions. ETFs that replicate the performance of the index are issued by The Vanguard Group (NYSE Arca: VOO), iShares (NYSE Arca: IVV), and State Street Corporation (NYSE Arca: SPY), and the most liquid based on average daily volume is currently (NYSE Arca: SPY), although SPY has a slightly higher expense ratio of 0.09% compared to just 0.03% for VOO and IVV. Mutual funds that track the index are offered by Fidelity Investments, T. Rowe Price, and Charles Schwab Corporation.[14][15][16]
Direxion offers leveraged ETFs that attempt to produce three times the daily result of either investing in (NYSE Arca: SPXL) or shorting (NYSE Arca: SPXS) the S&P 500 index.[17]
Derivatives[]
In the derivatives market, the Chicago Mercantile Exchange (CME) offers futures contracts that track the index and trade on the exchange floor in an open outcry auction, or on CME's Globex platform, and are the exchange's most popular product. Ticker symbols are:
- /SP for the full-sized contract
- /ES for the E-mini S&P contract that is one fifth the size of /SP
- /MES for the Micro E-mini futures contract that is one tenth the size of the S&P E-mini contract, i.e. 1/50 the size of the full-sized (SP) contract
The Chicago Board Options Exchange (CBOE) offers options on the S&P 500 index as well as on S&P 500 index ETFs, inverse ETFs, and leveraged ETFs.
History[]
In 1860, Henry Varnum Poor formed Poor's Publishing, which published an investor's guide to the railroad industry.[18]
In 1923, Standard Statistics Company (founded in 1906 as the Standard Statistics Bureau) began rating mortgage bonds[18] and developed its first stock market index consisting of the stocks of 233 U.S. companies, computed weekly.[1]
In 1926, it developed a 90-stock index, computed daily.[1]
In 1941, Poor's Publishing merged with Standard Statistics Company to form Standard & Poor's.[18][19]
On Monday, March 4, 1957, the index was expanded to its current 500 companies and was renamed the S&P 500 Stock Composite Index.[1]
In 1962, Ultronic Systems became the compiler of the S&P indices including the S&P 500 Stock Composite Index, the 425 Stock Industrial Index, the 50 Stock Utility Index, and the 25 Stock Rail Index.[20]
On August 31, 1976, The Vanguard Group offered the first mutual fund to retail investors that tracked the index.[1]
On April 21, 1982, the Chicago Mercantile Exchange began trading futures based on the index.[1]
On July 1, 1983, Chicago Board Options Exchange began trading options based on the index.[1]
Beginning in 1986, the index value was updated every 15 seconds, or 1,559 times per trading day, with price updates disseminated by Reuters.[21]
On January 22, 1993, the Standard & Poor's Depositary Receipts exchange-traded fund issued by State Street Corporation began trading.[1]
On September 9, 1997, CME Group introduced the S&P E-mini futures contract.[1]
In 2005, the index transitioned to a public float-adjusted capitalization-weighting.[22]
Selection criteria[]
Like other indices managed by S&P Dow Jones Indices, but unlike indices such as the Russell 1000 Index which are strictly rule-based, the components of the S&P 500 index are selected by a committee. When considering the eligibility of a new addition, the committee assesses the company's merit using eight primary criteria: market capitalization, liquidity, domicile, public float, Global Industry Classification Standard and representation of the industries in the economy of the United States, financial viability, length of time publicly traded, and stock exchange. Over the past few years, there has been a decline in the number of S&P 500 companies with classified boards.[23]: 159 Requirements to be added to the index include:[4]
- Market capitalization must be greater than or equal to US$13.1 billion
- Annual dollar value traded to float-adjusted market capitalization is greater than 1.0
- Minimum monthly trading volume of 250,000 shares in each of the six months leading up to the evaluation date
- Must be publicly listed on either the New York Stock Exchange (including NYSE Arca or NYSE American) or NASDAQ (NASDAQ Global Select Market, NASDAQ Select Market or the NASDAQ Capital Market).
- The company should be from the U.S.[24]
- Securities that are ineligible for inclusion in the index are limited partnerships, master limited partnerships and their investment trust units, OTC Bulletin Board issues, closed-end funds, exchange-traded funds, Exchange-traded notes, royalty trusts, tracking stocks, preferred stock, unit trusts, equity warrants, convertible bonds, investment trusts, American depositary receipts, and American depositary shares.[4]
- Since 2017, companies with dual share classes are not added to the index.
To remain indicative of the largest public companies in the United States, the index is reconstituted quarterly; however, efforts are made to minimize turnover in the index as a result of declines in value of constituent companies.[12][4]
A stock may rise in value when it is added to the index since index funds must purchase that stock to continue tracking the index.[25][26]
In October 2021, Bloomberg News reported that a study alleged that some companies purchase ratings from S&P Global to increase their chances of entering the S&P 500 Index—even without meeting the full criteria for inclusion.[27]
Index value calculation[]
The index is a free-float capitalization-weighted index;[28]: 150 that is, companies are weighted in the index in proportion to their market capitalizations. For purposes of determining the market capitalization of a company for weighting in the index, only the number of shares available for public trading ("public float") is used; shares held by insiders or controlling shareholders that are not publicly traded are excluded from the calculation.
The formula to calculate the S&P 500 index value is

where is the price of the i-th stock in the index, is the corresponding number of shares publicly available ("float") for that stock, and is a normalization factor.


The , currently below 8.3 billion,[29] is a number that is adjusted to keep the value of the index consistent despite corporate actions that affect market capitalization and would otherwise affect the calculation formula, such as additional share issuance, share buybacks, special dividends, constituent changes, rights offerings, and corporate spin-offs. Stock splits do not affect the divisor since they do not affect market capitalization.[4] When a company is dropped and replaced by another with a different market capitalization, the divisor needs to be adjusted in such a way that the value of the S&P 500 index remains constant. All divisor adjustments are made after the close of trading and after the calculation of the closing value of the S&P 500 index.[30]: 290
Performance[]
The average annual total return and compound annual growth rate of the index, including dividends, since inception in 1926 has been approximately 9.8% (6% after inflation), and the annual standard deviation of the return over the same time period is 20.81%;[31] however, there were several years where the index declined over 30%.[32] The index has posted annual increases 70% of the time.[33] However, the index has made new highs on only 5% of trading days, meaning that on 95% of trading days, the index has closed below its all-time high.[34]
Price history & milestones[]
On August 12, 1982, the index closed at 102.42.[35]
On Black Monday (1987), the index realized its worst daily percentage loss, falling 20.47% in a single day.[1]
In October 1996, the index closed above 700.[36]
On February 12, 1997, the index closed above 800 for the first time.[37]
On February 2, 1998, the index closed above 1,000 for the first time.[38]
On March 24, 2000, at the peak of the dot-com bubble, the index reached an intraday high of 1,552.87; this high was not exceeded until May 30, 2007. On October 10, 2002, during the stock market downturn of 2002, the index fell to 768.83, a decline of approximately 50% from its high in March 2000.[39]
On May 30, 2007, the index closed at 1,530.23, setting its first all-time closing high in more than 7 years. The index achieved a new all-time intraday high on October 11, 2007, at 1,576.09.[40]
Between the bankruptcy of Lehman Brothers on September 15, 2008, and the end of 2008, the index closed either up or down 3% in one day 29 times.[41] On October 13, 2008, the index closed up 11.6%, its best single-day percentage gain since being founded in 1957.[42]
On November 20, 2008, the index closed at 752.44, its lowest since early 1997.[43]
The index ended 2008 at 903.25, a yearly loss of 38.5%.[44] The index continued to decline in early 2009, closing at 676.53 on March 9, 2009, its lowest close in 13 years. The drawdown from the high in October 2007 to the low in March 2009 was 56.8%, the largest since World War II.[45]
At the trough of the United States bear market of 2007–2009, on March 6, 2009, the index was at 666.[46] By March 23, 2009, the index had risen 20% from its low, closing at 822.92.[47]
The index closed 2009 at 1,115.10, the second-best year of the decade.[48]
On April 14, 2010, the index closed at 1,210.65, its first close above 1,200 since the financial crisis of 2007-2008.[49] By July 2, 2010, it had fallen to 1,022.58, its lowest point of the year.[50][51]
On April 29, 2011, the index closed at a post-crisis high of 1,363.61. However, after the August 2011 stock markets fall, on October 4, 2011, the index briefly broke below 1,100.[52]
The index rose 13% in 2012 despite significant volatility amid electoral and fiscal uncertainty and round 3 of quantitative easing. On December 31, 2012, the index closed at 1,426.19, an annual gain of 13% and its biggest gain in 3 years.[53]
On March 28, 2013, the index surpassed its closing high of 1,565.15, recovering all its losses from the Great Recession.[54][55] On April 10, 2013, it closed above the intraday high from 2007.[56][40]
On August 26, 2014, the index closed above 2,000 for the first time.[38]
On March 2, 2015, the index reached an all-time closing high, while the Nasdaq Composite closed above 5,000 for the first time since 2000.[57]
After the 2015–2016 Chinese stock market turbulence, a period of over a year with no new record highs ended on July 11, 2016, with the index closing at 2,137.16.[58]
In June 2017, the index posted the largest weekly rise since the 2016 United States presidential election.[59]
For the full year 2017, the index was up 19.4%, its best year since 2013.[60] On September 25, 2017, the index closed above 2,500 for the first time.[61]
The index rose sharply in January 2018, extending one of its longest monthly winning streaks, only to fall 4% in February 2018 during a month of extremely high volatility, including a day in which the VIX doubled.[62][63] It was the first monthly decline in 11 months.[64] In the third quarter of 2018, the index posted its best quarter since 2013.[65] However, the index fell 11% in the month of December 2018, its worst December performance since the Great Depression.[66] The index fell 6% in 2018, its worst year in a decade.[67]
However, in 2019, the index posted its best first half in 22 years including the best June since 1938.[68][69] On July 10, 2019, the index reached 3,000 for the first time.[70] The index rose 31.5% in 2019, one of its best years.[71]
On February 19, 2020, the index hit a new closing peak of 3,386.15; however, it fell 10% in the next six trading days, its fastest drop from a new peak as a result of the onset of the COVID-19 pandemic and COVID-19 recession.[72][73] On March 23, 2020, at the trough of the 2020 stock market crash, the index had fallen 34% from its peak.[74][75] Overall, the index fell 20% during the first quarter of 2020, its worst quarter since 2008.[76] However, this was followed by a 20% gain in the second quarter, its biggest quarterly gain since 1998.[77][78] The index reached a new record high on August 18, 2020.[79][80] In the following months the index reached several all-time highs. On April 1, 2021, the index closed above 4,000 for the first time.[81]
Returns by year[]
Returns are generally quoted as price returns (excluding returns from dividends). However, they can also be quoted as total return, which include returns from dividends and the reinvestment thereof, and "net total return", which reflects the effects of dividend reinvestment after the deduction of withholding tax.[2]
| Year | Change in Index | Total Annual Return Including Dividends | Value of $1.00 Invested on January 1, 1970 | 5 Year Annualized Return | 10 Year Annualized Return | 15 Year Annualized Return | 20 Year Annualized Return | 25 Year Annualized Return |
|---|---|---|---|---|---|---|---|---|
| 1970 | 0.10% | 4.01% | $1.04 | - | - | - | - | - |
| 1971 | 10.79% | 14.31% | $1.19 | - | - | - | - | - |
| 1972 | 15.63% | 18.98% | $1.41 | - | - | - | - | - |
| 1973 | −17.37% | −14.66% | $1.21 | - | - | - | - | - |
| 1974 | −29.72% | −26.47% | $0.89 | −2.35% | - | - | - | - |
| 1975 | 31.55% | 37.20% | $1.22 | 3.21% | - | - | - | - |
| 1976 | 19.15% | 23.84% | $1.51 | 4.87% | - | - | - | - |
| 1977 | −11.50% | −7.18% | $1.40 | −0.21% | - | - | - | - |
| 1978 | 1.06% | 6.56% | $1.49 | 4.32% | - | - | - | - |
| 1979 | 12.31% | 18.44% | $1.77 | 14.76% | 5.86% | - | - | - |
| 1980 | 25.77% | 32.50% | $2.34 | 13.96% | 8.45% | - | - | - |
| 1981 | −9.73% | −4.92% | $2.23 | 8.10% | 6.47% | - | - | - |
| 1982 | 14.76% | 21.55% | $2.71 | 14.09% | 6.70% | - | - | - |
| 1983 | 17.27% | 22.56% | $3.32 | 17.32% | 10.63% | - | - | - |
| 1984 | 1.40% | 6.27% | $3.52 | 14.81% | 14.78% | 8.76% | - | - |
| 1985 | 26.33% | 31.73% | $4.64 | 14.67% | 14.32% | 10.49% | - | - |
| 1986 | 14.62% | 18.67% | $5.51 | 19.87% | 13.83% | 10.76% | - | - |
| 1987 | 2.03% | 5.25% | $5.80 | 16.47% | 15.27% | 9.86% | - | - |
| 1988 | 12.40% | 16.61% | $6.76 | 15.31% | 16.31% | 12.17% | - | - |
| 1989 | 27.25% | 31.69% | $8.90 | 20.37% | 17.55% | 16.61% | 11.55% | - |
| 1990 | −6.56% | −3.10% | $8.63 | 13.20% | 13.93% | 13.94% | 11.16% | - |
| 1991 | 26.31% | 30.47% | $11.26 | 15.36% | 17.59% | 14.34% | 11.90% | - |
| 1992 | 4.46% | 7.62% | $12.11 | 15.88% | 16.17% | 15.47% | 11.34% | - |
| 1993 | 7.06% | 10.08% | $13.33 | 14.55% | 14.93% | 15.72% | 12.76% | - |
| 1994 | −1.54% | 1.32% | $13.51 | 8.70% | 14.38% | 14.52% | 14.58% | 10.98% |
| 1995 | 34.11% | 37.58% | $18.59 | 16.59% | 14.88% | 14.81% | 14.60% | 12.22% |
| 1996 | 20.26% | 22.96% | $22.86 | 15.22% | 15.29% | 16.80% | 14.56% | 12.55% |
| 1997 | 31.01% | 33.36% | $30.48 | 20.27% | 18.05% | 17.52% | 16.65% | 13.07% |
| 1998 | 26.67% | 28.58% | $39.19 | 24.06% | 19.21% | 17.90% | 17.75% | 14.94% |
| 1999 | 19.53% | 21.04% | $47.44 | 28.56% | 18.21% | 18.93% | 17.88% | 17.25% |
| 2000 | −10.14% | −9.10% | $43.12 | 18.33% | 17.46% | 16.02% | 15.68% | 15.34% |
| 2001 | −13.04% | −11.89% | $37.99 | 10.70% | 12.94% | 13.74% | 15.24% | 13.78% |
| 2002 | −23.37% | −22.10% | $29.60 | −0.59% | 9.34% | 11.48% | 12.71% | 12.98% |
| 2003 | 26.38% | 28.68% | $38.09 | −0.57% | 11.07% | 12.22% | 12.98% | 13.84% |
| 2004 | 8.99% | 10.88% | $42.23 | −2.30% | 12.07% | 10.94% | 13.22% | 13.54% |
| 2005 | 3.00% | 4.91% | $44.30 | 0.54% | 9.07% | 11.52% | 11.94% | 12.48% |
| 2006 | 13.62% | 15.79% | $51.30 | 6.19% | 8.42% | 10.64% | 11.80% | 13.37% |
| 2007 | 3.53% | 5.49% | $54.12 | 12.83% | 5.91% | 10.49% | 11.82% | 12.73% |
| 2008 | −38.49% | −37.00% | $34.09 | −2.19% | −1.38% | 6.46% | 8.43% | 9.77% |
| 2009 | 23.45% | 26.46% | $43.11 | 0.41% | −0.95% | 8.04% | 8.21% | 10.54% |
| 2010 | 12.78% | 15.06% | $49.61 | 2.29% | 1.41% | 6.76% | 9.14% | 9.94% |
| 2011 | -0.00% | 2.11% | $50.65 | −0.25% | 2.92% | 5.45% | 7.81% | 9.28% |
| 2012 | 13.41% | 16.00% | $58.76 | 1.66% | 7.10% | 4.47% | 8.22% | 9.71% |
| 2013 | 29.60% | 32.39% | $77.79 | 17.94% | 7.40% | 4.68% | 9.22% | 10.26% |
| 2014 | 11.39% | 13.69% | $88.44 | 15.45% | 7.67% | 4.24% | 9.85% | 9.62% |
| 2015 | −0.73% | 1.38% | $89.66 | 12.57% | 7.30% | 5.00% | 8.19% | 9.82% |
| 2016 | 9.54% | 11.96% | $100.38 | 14.66% | 6.94% | 6.69% | 7.68% | 9.15% |
| 2017 | 19.42% | 21.83% | $122.30 | 15.79% | 8.49% | 9.92% | 7.19% | 9.69% |
| 2018 | −6.24% | −4.38% | $116.94 | 8.49% | 13.12% | 7.77% | 5.62% | 9.07% |
| 2019 | 28.88% | 31.49% | $153.76 | 11.70% | 13.56% | 9.00% | 6.06% | 10.22% |
| 2020 | 16.26% | 18.40% | $182.06 | 15.22% | 13.89% | 9.88% | 7.47% | 9.56% |
| 2021 | 26.89% | 28.71% | $234.33 | 18.48% | 16.55% | 10.66% | 9.52% | 9.76% |
| High | 34.11% | 37.58% | --- | 28.56% | 19.21% | 18.93% | 17.88% | 17.25% |
| Low | −38.49% | −37.00% | --- | −2.35% | −1.38% | 4.24% | 5.62% | 9.07% |
| Median | 12.36% | 15.43% | --- | 14.02% | 12.94% | 10.71% | 11.55% | 10.76% |
| Year | Change in Index | Total Annual Return Including Dividends | Value of $1.00 Invested on 1970‑01‑01 | 5 Year Annualized Return | 10 Year Annualized Return | 15 Year Annualized Return | 20 Year Annualized Return | 25 Year Annualized Return |
See also[]
References[]
- ^ a b c d e f g h i j Valetkevitch, Caroline (May 6, 2013). "Key dates and milestones in the S&P 500's history". Reuters.
- ^ a b c d e f "S&P 500®". S&P Global.
- ^ a b "S&P 500®" (PDF). S&P Global.
- ^ a b c d e "S&P U.S. Indices Methodology" (PDF). S&P Global.
- ^ Reklaitis, Victor (October 30, 2015). "The S&P is up 9% this month, but these 10 stocks jumped more than 22%". MarketWatch. Archived from the original on November 16, 2018.
- ^ Lichtenfeld, M. (2012). Get Rich with Dividends: A Proven System for Earning Double-Digit Returns. Hoboken, New Jersey: Wiley. p. 25. ISBN 9781118282342.
- ^ Brzenk, Phillip (March 19, 2018). "The Impact of the Global Economy on the S&P 500®" (PDF). S&P Global.
- ^ "Global Business Cycle Indicators". The Conference Board.
- ^ "Yahoo! Finance: ^GSPC". Yahoo! Finance.
- ^ "Google Finance: .INX". Google Finance.
- ^ "S&P 500 Index Quote". MarketWatch.
- ^ a b Preston, Hamish (June 9, 2020). "Higher Turnover Ahead For S&P 500? Not Necessarily!". S&P Global.
- ^ Wathen, Jordan (April 9, 2019). "How Are S&P 500 Stocks Chosen?". The Motley Fool.
- ^ Olson, Sheila. "Top 3 ETFs to Track the S&P 500". Investopedia. Archived from the original on March 24, 2019.
- ^ Chang, Ellen (June 28, 2019). "7 S&P Index Funds to Buy Now". U.S. News & World Report.
- ^ THUNE, KENT (June 25, 2019). "The Best S&P 500 Index Funds". TheBalance.
- ^ "SPXL SPXS". Direxion.
- ^ a b c "Our History". S&P Global.
- ^ Riggs, Thomas, ed. (2015). "Standard & Poor's". Gale Encyclopedia of U.S. Economic History. 3 (2nd ed.). Gale. p. 1256. Gale CX3611000855.
- ^ "Vast stock wire network being extended to coast". The New York Times. June 4, 1962.
- ^ Duggan, Wayne (June 13, 2019). "This Day In Market History: S&P 500 Quotes Delivered Every 15 Seconds". Benzinga.
- ^ "Standard & Poor's Announces Changes to U.S. Investable Weight Factors and Final Float Transition Schedule". March 9, 2005.
- ^ Bebchuk, Lucian A.; Hirst, Scott; Rhee, June (February 1, 2014). "Towards the Declassification of S&P 500 Boards". Rochester, NY. SSRN 2400652. Cite journal requires
|journal=(help) - ^ Staff, "S&P 500 Index", CFA, 2020.
- ^ Fitzgerald, Jay. "Stock Price Reactions to Index Inclusion". National Bureau of Economic Research.
- ^ Krantz, Matt (July 5, 2013). "Do stocks soar if they get into the S&P 500?". USA TODAY.
- ^ https://www.bloomberg.com/news/articles/2021-10-12/new-nber-study-asks-whether-s-p-500-membership-is-up-for-sale
- ^ Fernholz, E. Robert (April 17, 2013). Stochastic Portfolio Theory. Berlin/Heidelberg: Springer Science+Business Media. p. 150. ISBN 9781475736991.
- ^ "Stock Market Indicators: S&P 500/400/600 Divisors" (PDF). Yardeni.
- ^ Shilling, Henry (1996). The International Guide to Securities Market Indices. Chicago: Fitzroy Dearborn Publishers. p. 290. ISBN 9781351343947.
- ^ "S&P 500 Standard Deviation". Quantamental Finance. Pie-R-Cube. August 13, 2021.
- ^ Santoli, Michael (June 18, 2017). "The S&P 500 has already met its average return for a full year, but don't expect it to stay here". CNBC.
- ^ Carlozo, Lou (October 2, 2018). "Why Investors Love the S&P 500". U.S. News & World Report.
- ^ Carlson, Ben (February 27, 2020). "Worried about the stock market? Resist the urge to panic". Fortune.
- ^ Marotta, David John (October 11, 2017). "Volker's Bear: The Bear Market Of 1982". Forbes. Archived from the original on October 11, 2017.
- ^ "Dow eclipses 6,000". CNN. October 14, 1996.
- ^ "The Boring Portfolio Report - Wednesday, February 12, 1997". The Motley Fool. February 12, 1997.
- ^ a b Vaishampayan, Saumya; Dieterich, Chris (August 26, 2014). "S&P 500 Closes Above 2000 for First Time". The Wall Street Journal.
- ^ "New High For S&P 500". ETF.com. August 9, 2007. Archived from the original on September 11, 2014.
- ^ a b Park, JeeYeon (March 28, 2013). "Record-Smashing Quarter: S&P 500 Ends Above 2007's Record Close, Dow Posts Best Q1 Since 1998". CNBC. Archived from the original on April 1, 2013.
- ^ La Monica, Paul R. (September 29, 2009). "The end of the manic depressive market". CNN.
- ^ Twin, Alexandra (October 13, 2008). "Raging bulls". CNN.
- ^ Perman, Cindy (November 20, 2008). "Stocks Plunge, Leaving Dow Below 7600". CNBC. Archived from the original on December 17, 2017.
- ^ Twin, Alexandra (December 31, 2008). "Wall Street: Bring on '09". CNN. Archived from the original on April 2, 2015.
- ^ Carlson, Ben (March 19, 2020). "What comes after a bear market? You will like the answer". Fortune.
- ^ Santoli, Michael (March 4, 2019). "10 years ago this week, the market hit the climactic bottom of the Great Recession". CNBC.
- ^ Twin, Alexandra (March 23, 2009). "Dow jumps almost 500 points". CNN.
- ^ Valetkevitch, Caroline (December 31, 2009). "Wall St closes out '09 with best gains since 2003". Reuters. Archived from the original on December 17, 2017.
- ^ Vlastelica, Ryan (April 13, 2010). "S&P tops 1,200 on earnings boost". Reuters.
- ^ Francolla, Gina (July 23, 2010). "US Stocks Have Second Best Week of the Year". CNBC.
- ^ Dye, Caroline (July 22, 2010). "S&P May Fall to 2010 Low After Failed Rally: Technical Analysis". Bloomberg News.
- ^ Farrell, Maureen (October 4, 2011). "Stocks: Bear market bounce". CNN.
- ^ Park, JeeYeon (December 31, 2012). "S&P 500 Soars 13% in 2012, Logs Best Gain in 3 Years". CNBC.
- ^ Yousuf, Hibah (March 28, 2013). "What a quarter! Dow and S&P at record highs". CNN.
- ^ Shell, Adam; Goldbacher, Ray (March 28, 2013). "Stocks end higher, S&P 500 at new closing high". USA Today.
- ^ Farrell, Maureen (April 10, 2013). "Dow and S&P 500 close at new record highs". CNN. Archived from the original on September 24, 2014.
- ^ Cheng, Evelyn (March 2, 2015). "Nasdaq closes above 5K for first time since March 2000; Dow, S&P at records". CNBC.
- ^ Campos, Rodrigo (July 11, 2016). "Strong economy, earnings bets propel S&P 500 to record high". Reuters..
- ^ Gold, Riva; Driebusch, Corrie (June 24, 2017). "U.S. Stocks Notch Weekly Gains". The Wall Street Journal. Archived from the original on June 25, 2017.
- ^ Cheng, Evelyn (December 29, 2017). "Stocks end lower as selling accelerates into the close; S&P still posts best year since 2013". CNBC.
- ^ JAY, MARLEY (September 15, 2017). "S&P 500 tops 2,500 mark as tech and bank stocks climb". Fox Business. Associated Press.
- ^ Wigglesworth, Robin; Wells, Peter (February 28, 2018). "Volatile month sees S&P 500 fall nearly 4% in February". Financial Times.
- ^ Kawa, Luke (February 6, 2019). "The Day The Vix Doubled: Tales of 'Volmageddon'". Bloomberg News.
- ^ Egan, Matt (February 28, 2018). "February was an insane month for the stock market". CNN.
- ^ Imbert, Fred; Gibbs, Alexandra (September 28, 2018). "S&P 500 posts best quarter since 2013". CNBC.
- ^ Rabinowitz, Kate; Shapiro, Leslie (December 31, 2018). "Stocks are down after a volatile year, but that's not the whole picture". The Washington Post.
- ^ Imbert, Fred (December 31, 2018). "US stocks post worst year in a decade as the S&P 500 falls more than 6% in 2018". CNBC.
- ^ Driebusch, Corrie (June 28, 2019). "S&P 500 Posts Best First Half in 22 Years". The Wall Street Journal.
- ^ Imbert, Fred (June 28, 2019). "By the numbers: Best June for the Dow since 1938, S&P 500′s best first half in two decades". CNBC.
- ^ Burgess, Robert (July 10, 2019). "S&P 500 at 3,000 Is No Reason to Celebrate". Bloomberg News.
- ^ Tobey, John S. (December 31, 2019). "Year-End Reports Overstate Stock Market Performance – Here's The Reality". Forbes.
- ^ Watts, William (February 28, 2020). "S&P 500 tumbles from record finish to correction in just 6 trading days as stock-market rout accelerates". MarketWatch. Archived from the original on March 27, 2021.
- ^ Cox, Josue; Greenwald, Daniel L.; Ludvigson, Sidney C. (September 2020). "What explains the COVID-19 stock market" (PDF). NBER Working Paper Series. Cambridge, Massachusetts: National Bureau of Economic Research. Working Paper 27784. Archived (PDF) from the original on March 25, 2021.
- ^ Winck, Ben (June 8, 2020). "S&P 500 erases 2020 losses as investors bet on a swift economic recovery from the coronavirus". Business Insider.
- ^ Langley, Karen (June 10, 2020). "Stock Pickers Underperformed During Coronavirus Market Turmoil". The Wall Street Journal.
- ^ Stevens, Pippa (April 1, 2020). "Stock futures point to an opening bounce on Wall Street after second quarter's rocky start". CNBC. Archived from the original on April 2, 2020.
- ^ "An Epic Reversal of Fortune". The New York Times. July 1, 2020.
- ^ Imbert, Fred; Li, Yun (June 30, 2020). "S&P 500 rises to start the new quarter, tech leads Nasdaq Composite to record close". CNBC.
- ^ Imbert, Fred; Li, Yun (August 17, 2020). "S&P 500 rises to a record close, fully wiping out its coronavirus losses". CNBC.
- ^ Garber, Jonathan (August 18, 2020). "S&P 500 secures record, Nasdaq notches another: US stocks shed bulk of coronavirus losses". Fox Business.
- ^ "S&P 500 closes above 4,000 for the first time". NBC News. April 1, 2021.
External links[]
- Official website
- Business data for S&P 500 Index:
- S&P Dow Jones Indices
- 1957 introductions
- American stock market indices