Demographics of Honduras


This article is about the ethnic groups and population of Honduras.
Population[]
| Year | Pop. | ±% |
|---|---|---|
| 1791 | 96,421 | — |
| 1801 | 128,453 | +33.2% |
| 1881 | 307,289 | +139.2% |
| 1887 | 331,917 | +8.0% |
| 1895 | 398,877 | +20.2% |
| 1901 | 543,741 | +36.3% |
| 1905 | 500,136 | −8.0% |
| 1910 | 553,446 | +10.7% |
| 1916 | 605,997 | +9.5% |
| 1926 | 700,811 | +15.6% |
| 1930 | 854,184 | +21.9% |
| 1935 | 962,000 | +12.6% |
| 1940 | 1,107,859 | +15.2% |
| 1945 | 1,200,542 | +8.4% |
| 1950 | 1,368,605 | +14.0% |
| 1961 | 1,884,765 | +37.7% |
| 1988 | 4,614,377 | +144.8% |
| 2001 | 6,535,344 | +41.6% |
| 2013 | 8,303,771 | +27.1% |
| Source: INE[1] | ||
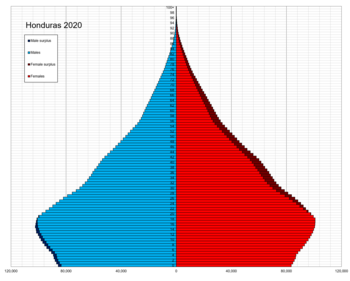
According to the 2019 revision of the World Population Prospects[2][3] the total population was 9,587,522 in 2018, compared to 1,487,000 in 1950 (a fivefold increase in 60 years). The proportion of the population aged below 15 in 2010 was 36.8%, 58.9% were aged between 15 and 65 years of age, and 4.3% were aged 65 years or older.[4]
As of 2014, 60% of Hondurans live below the poverty line.[5] More than 30% of the population is divided between the lower middle and upper middle class, less than 10% are wealthy or belong to the higher social class (most live in Tegucigalpa and San Pedro Sula).
| Total population (x 1000) |
Proportion aged 0–14 (%) |
Proportion aged 15–64 (%) |
Proportion aged 65+ (%) | |
|---|---|---|---|---|
| 1950 | 1 487 | 42.2 | 53.8 | 4.0 |
| 1955 | 1 717 | 44.3 | 52.3 | 3.4 |
| 1960 | 2 002 | 46.1 | 50.8 | 3.2 |
| 1965 | 2 353 | 47.1 | 49.8 | 3.1 |
| 1970 | 2 691 | 47.7 | 49.2 | 3.1 |
| 1975 | 3 108 | 47.5 | 49.3 | 3.2 |
| 1980 | 3 636 | 47.0 | 49.8 | 3.2 |
| 1985 | 4 238 | 46.2 | 50.6 | 3.2 |
| 1990 | 4 904 | 45.5 | 51.1 | 3.4 |
| 1995 | 5 592 | 44.3 | 52.1 | 3.6 |
| 2000 | 6 575 | 42.8 | 53.5 | 3.7 |
| 2005 | 7 459 | 40.6 | 55.6 | 3.8 |
| 2010 | 8 317 | 37.6 | 58.4 | 4.0 |
| 2015 | 9 113 | 33.7 | 61.9 | 4.3 |
| 2020 | 9 905 | 30.6 | 64.4 | 5.0 |
Structure of the population[]
Structure of the population (01.07.2007) (estimates) (data refer to projections based on the 2001 Population Census):[6]
| Age group | Male | Female | Total | % |
|---|---|---|---|---|
| Total | 3,717,577 | 3,819,375 | 7,536,952 | 100 |
| 0–4 | 541 070 | 522 177 | 1,063,247 | 14.11 |
| 5–9 | 511 733 | 497 666 | 1,009,399 | 13.39 |
| 10–14 | 464 403 | 456 447 | 920 850 | 12.22 |
| 15–19 | 402 792 | 400 001 | 802 793 | 10.65 |
| 20–24 | 353 317 | 357 434 | 710 751 | 9.43 |
| 25–29 | 308 283 | 318 130 | 626 413 | 8.31 |
| 30–34 | 255 818 | 266 861 | 522 679 | 6.93 |
| 35–39 | 205 171 | 219 874 | 425 045 | 5.64 |
| 40–44 | 157 492 | 177 140 | 334 632 | 4.44 |
| 45–49 | 128 813 | 147 464 | 276 277 | 3.67 |
| 50–54 | 105 428 | 121 993 | 227 421 | 3.02 |
| 55–59 | 83 643 | 97 033 | 180 676 | 2.40 |
| 60–64 | 63 863 | 73 789 | 137 652 | 1.83 |
| 65–69 | 49 404 | 58 136 | 107 540 | 1.43 |
| 70–74 | 37 134 | 44 984 | 82 118 | 1.09 |
| 75–79 | 24 368 | 30 225 | 54 593 | 0.72 |
| 80+ | 24 845 | 30 021 | 54 866 | 0.73 |
| Age group | Male | Female | Total | Percent |
|---|---|---|---|---|
| 0–14 | 1,517,206 | 1,476,290 | 2,993,496 | 39.72 |
| 15–64 | 2,064,620 | 2,179,719 | 4,244,339 | 56.31 |
| 65+ | 135 751 | 163 366 | 299 117 | 3.97 |
Structure of the population (01.07.2010) (estimates):
| Age group | Male | Female | Total | % |
|---|---|---|---|---|
| Total | 3,965,430 | 4,080,560 | 8,045,990 | 100 |
| 0–4 | 549 179 | 530 110 | 1,079,289 | 13.41 |
| 5–9 | 525 938 | 509 139 | 1,035,077 | 12.86 |
| 10–14 | 492 090 | 481 523 | 973 613 | 12.10 |
| 15–19 | 434 856 | 431 337 | 866 193 | 10.77 |
| 20–24 | 371 818 | 375 696 | 747 514 | 9.29 |
| 25–29 | 326 377 | 337 526 | 663 903 | 8.25 |
| 30–34 | 282 042 | 295 519 | 577 561 | 7.18 |
| 35–39 | 230 506 | 244 378 | 474 884 | 5.90 |
| 40–44 | 181 554 | 200 161 | 381 715 | 4.74 |
| 45–49 | 140 031 | 161 534 | 301 565 | 3.75 |
| 50–54 | 116 240 | 135 378 | 251 618 | 3.13 |
| 55–59 | 93 205 | 109 982 | 203 187 | 2.53 |
| 60–64 | 72 071 | 85 246 | 157 317 | 1.96 |
| 65–69 | 53 835 | 63 955 | 117 790 | 1.46 |
| 70–74 | 40 470 | 49 655 | 90 125 | 1.12 |
| 75–79 | 27 381 | 34 757 | 62 138 | 0.77 |
| 80+ | 27 837 | 34 664 | 62 501 | 0.78 |
| Age group | Male | Female | Total | Percent |
|---|---|---|---|---|
| 0–14 | 1,567,207 | 1,520,772 | 3,087,979 | 38.38 |
| 15–64 | 2,248,700 | 2,376,757 | 4,625,457 | 57.49 |
| 65+ | 149 523 | 183 031 | 332 554 | 4.13 |
Vital statistics[]
Registration of vital events is in Honduras not complete. The Population Department of the United Nations prepared the following estimates. [4]
| Period | Live births per year |
Deaths per year |
Natural change per year |
CBR* | CDR* | NC* | TFR* | IMR* | Life expectancy total |
Life expectancy for males |
Life expectancy for females |
|---|---|---|---|---|---|---|---|---|---|---|---|
| 1950–1955 | 84 000 | 40 000 | 44 000 | 52.1 | 24.7 | 27.4 | 7.50 | 169 | 41.8 | 40.5 | 43.1 |
| 1955–1960 | 95 000 | 40 000 | 55 000 | 51.1 | 21.5 | 29.6 | 7.50 | 154 | 44.6 | 43.0 | 46.3 |
| 1960–1965 | 108 000 | 40 000 | 68 000 | 49.5 | 18.3 | 31.2 | 7.42 | 136 | 48.0 | 46.3 | 49.8 |
| 1965–1970 | 122 000 | 40 000 | 82 000 | 48.4 | 16.0 | 32.4 | 7.42 | 119 | 51.0 | 49.2 | 53.0 |
| 1970–1975 | 133 000 | 40 000 | 93 000 | 45.9 | 13.7 | 32.2 | 7.05 | 104 | 54.1 | 52.1 | 56.2 |
| 1975–1980 | 150 000 | 38 000 | 112 000 | 44.5 | 11.4 | 33.1 | 6.60 | 81 | 57.7 | 55.6 | 59.9 |
| 1980–1985 | 166 000 | 36 000 | 130 000 | 42.3 | 9.2 | 33.1 | 6.00 | 65 | 61.6 | 59.4 | 63.8 |
| 1985–1990 | 180 000 | 33 000 | 147 000 | 39.5 | 7.3 | 32.2 | 5.37 | 53 | 65.4 | 63.2 | 67.7 |
| 1990–1995 | 195 000 | 33 000 | 162 000 | 37.1 | 6.3 | 30.8 | 4.92 | 43 | 67.7 | 65.4 | 70.1 |
| 1995–2000 | 198 000 | 33 000 | 165 000 | 33.4 | 5.5 | 27.9 | 4.30 | 35 | 69.8 | 67.5 | 72.3 |
| 2000–2005 | 197 000 | 35 000 | 163 000 | 31.4 | 5.0 | 26.4 | 3.87 | 31 | 71.0 | 68.6 | 73.4 |
| 2005–2010 | 201 000 | 37 000 | 164 000 | 27.1 | 4.7 | 22.4 | 3.24 | 28 | 72.1 | 69.7 | 74.5 |
| 2010–2015 | 23.4 | 4.5 | 18.9 | 2.73 | |||||||
| 2015–2020 | 21.8 | 4.4 | 17.4 | 2.49 | |||||||
| 2020–2025 | 20.3 | 4.5 | 15.8 | 2.32 | |||||||
| 2025–2030 | 18.6 | 4.6 | 14.0 | 2.19 | |||||||
| * CBR = crude birth rate (per 1000); CDR = crude death rate (per 1000); NC = natural change (per 1000); IMR = infant mortality rate per 1000 births; TFR = total fertility rate (number of children per woman) | |||||||||||
| Year | Population | Live births | Deaths | Natural increase | Crude birth rate | Crude death rate | Rate of natural increase | TFR |
|---|---|---|---|---|---|---|---|---|
| 2010 | 200,293 | 22,843 | 177,450 | |||||
| 2011 | 201,494 | 25,012 | 176,482 | |||||
| 2012 | 8,169,047 | 196,119 | 25,249 | 170,870 | 4.5 | 16 | 3.2 | |
| 2013 | 8,303,771 | 4.6 | 16 | 2.7 | ||||
| 2014 | 8,432,153 | 4.5 | 15 | 2.7 | ||||
| 2015 | 8,576,532 | 204,594 | 4.5 | 17 | 2.6 | |||
| 2016 | 8,721,014 | 184,312 | 4.5 | 17 | 2.6 | |||
| 2017 | 8,859,980 | 4.4 | 16 | 2.5 | ||||
| 2018 | 9,023,838 | 4.5 | 16 | 2.5 | ||||
| 2019 | 9,151,940 | 4.5 | 16 | 2.5 |
Fertility and births[]
Total Fertility Rate (TFR) (Wanted Fertility Rate) and Crude Birth Rate (CBR):[8]
| Year | CBR (Total) | TFR (Total) | CBR (Urban) | TFR (Urban) | CBR (Rural) | TFR (Rural) |
|---|---|---|---|---|---|---|
| 1998–2001 | 4.4 | |||||
| 2005–2006 | 27 | 3,3 (2,3) | 24 | 2,6 (1,9) | 29 | 4,1 (2,8) |
| 2011–2012 | 25.6 | 2,9 (2,2) | 24.2 | 2,5 (1,9) | 27.2 | 3,5 (2,6) |
Ethnic groups[]
| Immigrants in Honduras[9] | ||||
| Country | Immigrants | |||
|---|---|---|---|---|
| 9,000+ | ||||
| 8,000+ | ||||
| 7,000+ | ||||
| 5,000+ | ||||
| 2,000+ | ||||
| 1,000+ | ||||
| 1,000+ | ||||
| 1,000+ | ||||
| 1,000+ | ||||
| 1,000+ | ||||
Mestizos[]
Mestizos (meaning mixed European and Amerindian) have been reported by the CIA World Factbook to be about 87% of the population of Honduras.[10] As in other Latin American countries, the question of racial breakdown of a national population is contentious. Since the beginning of the 20th century at least, Honduras has publicly framed itself as a mestizo nation, along other Latin American countries such as Guatemala or Mexico, ignoring and at times disparaging both the European component of the population and the surviving Amerindian population that was still regarded as "pure blood". It's well known that many Hondurans of European or almost entirely Amerindian background consider themselves mestizo.[11][12]
Because of social stigmas attached, many Honduran people denied having African ancestry, and after African descended Caribbean workers arrived in Honduras, an active campaign to denigrate all people of African descent, made persons of mixed race anxious to deny any African ancestry. Hence official statistics quite uniformly under-represent those people who have ancestry in favor of a "two race" solution.[11]
Examples of Honduran mestizos are, Poet Clemetina Suarez, actress America Ferrera, Novelist and poet Roberto Sosa, Footballer Noel Valladares, Ex president Manuel Zelaya.
Gallery[]

Honduran-American actress, America Ferrera

Novelist, Roberto Sosa

Footballer, Noel Valladares

Actor, Carlos "Ned Arnel" Mencia


Amerindian[]
The Amerindian population is the first biggest minority in Honduras, the biggest ethnic group that made up the native population is the Lencan. These people has been living in Honduran territory before the colonization of the americas developing their pown societies and civilizations and still has many communities all along the country. According to the 2001 census the Amerindian population in Honduras included 381,495 people (6.3% of the total population).[13] With the exception of the Lenca and the Ch'orti' they still keep their language.
Six different Amerindian groups were counted at the 2001 census:
- the Lenca (279,507 in 2001;4.6% of the total population) living in the La Paz, Intibucá, and Lempira departments;
- the Miskito (51,607 in 2001; 0.8%) living on the northeast coast along the border with Nicaragua.
- the Ch'orti' (34,453 in 2001;0.6% of the total population), a Mayan group living in the northwest on the border with Guatemala;
- the Tolupan (also called Jicaque, "Xicaque", or Tol; 9,617 in 2001; 0.2% of the total population), living in the reserve of the Montaña de la Flor and parts of the department of Yoro;
- the Pech or Paya Indians (3,848 in 2001; 0.1% of the total population) living in a small area in the Olancho department;
- the Mayangna or Tawahka (2,463 in 2001; <0.1%)
Examples of Honduran natives are the many Mayan rules of Copan and other Mayan cities, native leaders as Lempira and Cicumba, and environmental and feminist activist Berta Caceres.
Gallery[]

Copan founder, king Knich Yax Kuk Moo

Mayan ruler, Kʼakʼ Yipyaj Chan Kʼawiil
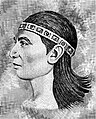
Lencan ruler, Lempira

Lencan environmental activist, Berta Caceres


Afro-Hondurans[]
The Afro-Honduran population consist of people of African descent, Garifuna and Creoles. Most of them are descendants of African people brought by the Spanish and other European colonizers between the 16th and 18th centuries. Many of them came from the west African coast, from places like Angola or Senegambia, where European bought slaves for their colonies, while others came from the other colonies in the Caribbean.
- The Garifuna are descendants of Carib, Arawak, and West African people. This ethnic group has its origins in a group from St. Vincent islands in the Caribbean, who came in 1797. At the 2001 census 46,448 people were registered as Garifuna, 0.8% of the total population of Honduras.[13] The Garifuna speak an Arawakan language. They live along the entire Caribbean coastline of Honduras, and in the Bay Islands.
- The number of Creoles was 12,370 (0.2%) in 2001.
Examples of well-known Afro-Hondurans are footballers David Suazo, Victor "Muma" Bernardez, Dr. Emet Cherefant, and Wilson Palacios.
Gallery[]

Footballer, David Suazo

Footballer, Wilson Palacios


Euro-Hondurans[]
White people along with Afro-descendants and Amerindians belong to the minorities of Honduras. Most of the Honduran whites are descendants of the Spanish colonist, mostly people from southern Spain, they inhabit most of the western part of the country. Other Honduran whites are descendants of European immigrants who arrived at the beginning of the 20th century. The Italians that gained residence in Honduras were 389 in 2014, nearly all of them concentrated in the capital area.[14] However, the term "white person" in Honduras remains somewhat ambiguous, Honduras has one of the largest Arab communities in Latin America (being 3% of the total population), of which are considered to be white. Percentages of whites varied from between 4% to 9%, due to the fact that the majority of Hondurans identify themselves as mestizos, regardless of their ethnic and racial category. Which makes it more difficult to study the number of people who fit into the white category in Honduras. In a census a total of 450,000 of people from Honduras have appeared who identify themselves as whites, therefore it gives the percentage is 4%.
However, other studies report that the percentage could rise much more, reaching close to a half a million white people in Honduras, which according to official national sources would make a percentage of between 5% to 6.9% of white Hondurans. This is because the majority of whites in Honduras do not identify themselves as Euro-descendants as such, adopting and feeling more identified with the mestizo identity.
Examples of white Hondurans are ex president Simon Azcona del Hoyo, biomedic Salvador Moncada, film director Juan Carlos Fanconi, politician Roberto Micheletti, General Florencio Xatruch and former president of the Central American federation Don Francisco Morazán Quezada.
Gallery[]

Sir. Salvador Moncada, Honduran biomedic

Juan Carlos Fanconi, film director
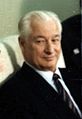
Ex president, José Simón Azcona del Hoyo
Central American president, General Francisco Morazán

General, Florencio Xatruch
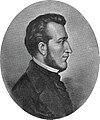
Ex-President, Francisco Bertrand


Other ethnicities[]
Asians[]
East Asians[]
There's a small Chinese community in Honduras. A lawyer of the Committee for the Defense of Human Rights in Honduras (CODEH) stated that the Chinese community in Honduras is rather small. Many of the Chinese are immigrants who arrived from China after the revolution and their descendants.[15]
Arabs[]
Honduras hosts a significant Palestinian community (the vast majority of whom are Christian Arabs).[16] These Arab-Hondurans are sometimes called "Turcos", because they arrived in Honduras using Turkish travel documents, as their homeland was then under the control of the Ottoman Empire. The Palestinians arrived in the country in the late 19th and early 20th centuries, establishing themselves especially in the city of San Pedro Sula.[17] As mentioned earlier, they are also considered whites in the country's censuses, in total the Arab-Hondurans make up 3% of the Honduran population.
Gallery[]

Businessman Miguel Facusse, son of immigrants from the Ottoman empire

TV host Salvador Nasralla, son of Palestinian immigrants

Dr Kerim Gattas Asfura, of Arab descent


See also[]
- Languages of Honduras
- Ethnic groups in Central America
- History of Honduras
- Hondurans
 Honduras portal
References[]
- ^ cruz, Eduardo. "Gobierno suma a 152 microempresarias en Pimienta, Cortés". www.ine.gob.hn.
- ^ ""World Population prospects – Population division"". population.un.org. United Nations Department of Economic and Social Affairs, Population Division. Retrieved 9 November 2019.
- ^ ""Overall total population" – World Population Prospects: The 2019 Revision" (xslx). population.un.org (custom data acquired via website). United Nations Department of Economic and Social Affairs, Population Division. Retrieved 9 November 2019.
- ^ Jump up to: a b "Population Division of the Department of Economic and Social Affairs of the United Nations Secretariat, World Population Prospects: The 2012 Revision".
- ^ "CIA – The World Factbook". Cia.gov. Retrieved 2 November 2014.
- ^ Jump up to: a b "United Nations Statistics Division – Demographic and Social Statistics". unstats.un.org.
- ^ "CIFRAS DE PAÍS". Instituto Nacional de Estadisticas Honduras. Retrieved 2 June 2021.
- ^ "MEASURE DHS: Demographic and Health Surveys". microdata.worldbank.org.
- ^ "Immigrant and Emigrant Populations". Migration Policy Institute. Retrieved 2 July 2021.
- ^ Jump up to: a b c "Central America and Caribbean :: HONDURAS". CIA The World Factbook.
- ^ Jump up to: a b Dario Euraque, "The Threat of Blackness to the Mestizo Nation: Race and Ethnicity in the Honduran Banana Economy, 1920s and 1930s," in Steve Striffler and Mark Moberg, eds. Banana Wars: Power, Production and History in the Americas (Duke University Press, 2003), pp. 229–49.
- ^ Dario Euraque, "Antropólogos, archaeólogos, imperialismo y la mayanicación de Honduras, 1890–1940," Revista Historia 45 (2002): 73–103
- ^ Jump up to: a b "Atlas sociolingüístico de Pueblos Indígenas de América Latina Fichas nacionales" (PDF). UNICEF.
- ^ https://www.elheraldo.hn/pais/575489-214/29-mil-extranjeros-viven-el-sueno-hondureno
- ^ [1]. The UN Refugee Agency. "Honduras: Information on racism and treatment of ethnic Chinese."
- ^ The Arabs of Honduras Archived 9 October 2014 at the Wayback Machine. Larry Luxner. Saudi Aramco World.
- ^ "Luxner – Articles". www.luxner.com. Archived from the original on 16 May 2006. Retrieved 20 February 2013.

- Demographics of Honduras
- Ethnic groups in Honduras
- Honduran society