Demographics of Nicaragua
| Demographics of Nicaragua | |
|---|---|
| Population | 6,465,501 (2018 est.)[1][2] |
| Male population | 2,839,168 |
| Female population | 2,836,188 |
| Population growth | 1.855% |
| Birth rate | 24.12/1,000 |
| Death rate | 4.42/1,000 |
| Infant mortality rate | 27.14/1,000 |
| Life expectancy | 70.92 years |
| Nationality | Nicaraguan |
| Demographic bureaus | INEC |
According to the 2019 revision of the World Population Prospects[1][2], Nicaragua has a population of 6,465,501.[1][2] Whites and Mestizos and tribally unaffiliated Native Americans combined make up about 86% of the population. The remainder of the Nicaraguan population is 9% English-speaking Afro-Nicaraguans, and 5% Tribal Native American.[citation needed]
Prior to the Sandinista revolution of 1979 since most of the migration during the years that followed were primarily of upper or middle-class Nicaraguans, a group primarily made up of whites. A growing number of these expats have returned, while many continue to live abroad.[citation needed]
The 42.5% of the population live below to the poverty line,[3] The general poverty rate is estimated of 47.3%, although much of the population lives in the lower middle class because of low salaries and a minimal amount of PIB (US$1000–3000).[4]
The most populous city in the country is the capital city, Managua, with a population of 1.2 million (2005). As of 2005, over 4.4 million inhabitants live in the Pacific, Central and North regions. 2.7 million inhabitants reside in the Pacific region alone, while inhabitants in the Caribbean region only reach an estimated 700,000.[5]
The Census Bureau in Nicaragua is the National Institute of Statistics and Census (INEC). The institution is in charge of completing censuses and surveys. INEC ran its first census in 1906, the last census was taken in 2005, it was the eighth to date.
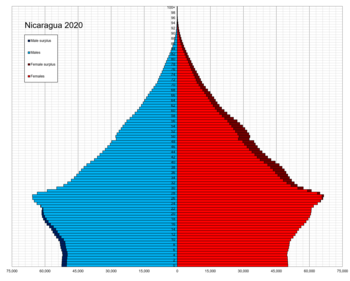
Population[]

According to the 2019 revision of the World Population Prospects[1][2] the total population was 6,465,501 in 2018, compared to only 1,295,000 in 1950. The proportion of children below the age of 15 in 2010 was 34.5%, 60.9% was between 15 and 65 years of age, while 4.6% was 65 years or older .[6]
| Total population (million) |
Proportion aged 0–14 (%) |
Proportion aged 15–64 (%) |
Proportion aged 65+ (%) | |
|---|---|---|---|---|
| 1950 | 1 295 | 43.0 | 54.2 | 2.8 |
| 1955 | 1 508 | 45.2 | 52.1 | 2.7 |
| 1960 | 1 775 | 47.4 | 50.0 | 2.5 |
| 1965 | 2 063 | 49.2 | 48.3 | 2.5 |
| 1970 | 2 400 | 48.1 | 49.4 | 2.5 |
| 1975 | 2 798 | 47.1 | 50.2 | 2.6 |
| 1980 | 3 250 | 47.1 | 50.1 | 2.7 |
| 1985 | 3 710 | 47.1 | 50.0 | 2.9 |
| 1990 | 4 138 | 46.0 | 50.9 | 3.2 |
| 1995 | 4 659 | 44.0 | 52.6 | 3.4 |
| 2000 | 5 069 | 39.7 | 56.6 | 3.8 |
| 2005 | 5 439 | 36.2 | 59.6 | 4.2 |
| 2010 | 5 824 | 33.3 | 62.2 | 4.5 |
| 2015 | 6 223 | 31.3 | 64.0 | 4.8 |
| 2020 | 6 625 | 29.5 | 64.8 | 5.7 |
Structure of the population[]
Structure of the population (01.07.2009) (estimates):
| Age group | Male | Female | Total | % |
|---|---|---|---|---|
| Total | 2 844 244 | 2 898 072 | 5 742 316 | 100 |
| 0-4 | 347 205 | 332 920 | 680 125 | 11,84 |
| 5-9 | 336 817 | 323 279 | 660 096 | 11,50 |
| 10-14 | 344 831 | 332 925 | 677 756 | 11,80 |
| 15-19 | 331 536 | 329 072 | 660 608 | 11,50 |
| 20-24 | 286 484 | 290 439 | 576 923 | 10,05 |
| 25-29 | 250 672 | 260 730 | 511 402 | 8,91 |
| 30-34 | 197 120 | 214 967 | 412 087 | 7,18 |
| 35-39 | 162 472 | 174 845 | 337 317 | 5,87 |
| 40-44 | 136 223 | 143 572 | 279 795 | 4,87 |
| 45-49 | 115 914 | 124 028 | 239 942 | 4,18 |
| 50-54 | 98 355 | 107 733 | 206 088 | 3,59 |
| 55-59 | 74 173 | 80 156 | 154 329 | 2,69 |
| 60-64 | 45 221 | 48 460 | 93 681 | 1,63 |
| 65-69 | 43 121 | 46 230 | 89 351 | 1,56 |
| 70-74 | 32 418 | 35 443 | 67 861 | 1,18 |
| 75-79 | 22 249 | 25 956 | 48 205 | 0,84 |
| 80+ | 19 433 | 27 317 | 46 750 | 0,81 |
| Age group | Male | Female | Total | Percent |
|---|---|---|---|---|
| 0-14 | 1 028 853 | 989 124 | 2 017 977 | 35,14 |
| 15-64 | 1 698 170 | 1 774 002 | 3 472 172 | 60,47 |
| 65+ | 117 221 | 134 946 | 252 167 | 4,39 |
Population distribution[]
Ninety percent of Nicaraguans live in the Pacific lowlands and the adjacent interior highlands. The population is 54% urban. The most populous city in Nicaragua is the capital city, Managua, with a population of 1.2 million (2005). As of 2005, over 4.4 million inhabitants live in the Pacific, Central and North regions of the country. There are 2.7 million residents in the Pacific region. The Caribbean region has an estimated 700,000 residents.[5] In addition, many Nicaraguans live abroad.
Departments by population[]
| Rank | City | Department | Pop. | Rank | City | Department | Pop. | |||
|---|---|---|---|---|---|---|---|---|---|---|
| 1 | Managua | Managua | 1,262,978 | 10 | Estelí | Estelí | 201,548 | |||
| 2 | Matagalpa | Matagalpa | 469,172 | 11 | Granada | Granada | 168,186 | |||
| 3 | Chinandega | Chinandega | 378,970 | 12 | Jinotepe | Carazo | 166,073 | |||
| 4 | León | León | 355,779 | 13 | Rivas | Rivas | 156,283 | Managua | ||
| 5 | Jinotega | Jinotega | 331,335 | 14 | Juigalpa | Chontales | 153,932 |  Granada | ||
| 6 | Bilwi | RAAN | 314,130 | 15 | Boaco | Boaco | 150,636 | |||
| 7 | Bluefields | RAAS | 306,510 | 16 | Somoto | Madriz | 132,459 | |||
| 8 | Masaya | Masaya | 289,988 | 17 | San Carlos | Río San Juan | 95,596 | |||
| 9 | Ocotal | Nueva Segovia | 208,523 | 18 | Total | -- | 5,142,098 (2005) | |||
| Source: National Institute of Statistics and Census (INEC).[8] | ||||||||||
Vital statistics[]
Registration of vital events is in Nicaragua not complete. The Population Department of the United Nations prepared the following estimates. [6]
| Period | Live births per year |
Deaths per year |
Natural change per year |
CBR* | CDR* | NC* | TFR* | IMR* | Life expectancy total |
Life expectancy for males |
Life expectancy for females |
|---|---|---|---|---|---|---|---|---|---|---|---|
| 1950-1955 | 77 000 | 32 000 | 45 000 | 54.9 | 23.0 | 31.9 | 7.20 | 172 | 42.3 | 40.9 | 43.7 |
| 1955-1960 | 89 000 | 33 000 | 56 000 | 54.2 | 20.4 | 33.8 | 7.50 | 151 | 45.4 | 44.1 | 46.8 |
| 1960-1965 | 93 000 | 33 000 | 60 000 | 48.5 | 17.0 | 31.5 | 7.10 | 131 | 48.7 | 47.3 | 50.0 |
| 1965-1970 | 103 000 | 32 000 | 71 000 | 46.3 | 14.4 | 31.9 | 6.95 | 114 | 52.0 | 50.5 | 53.4 |
| 1970-1975 | 120 000 | 33 000 | 88 000 | 46.3 | 12.6 | 33.7 | 6.79 | 98 | 55.3 | 53.7 | 56.8 |
| 1975-1980 | 137 000 | 34 000 | 102 000 | 45.2 | 11.3 | 33.9 | 6.35 | 90 | 57.6 | 55.3 | 60.0 |
| 1980-1985 | 149 000 | 35 000 | 114 000 | 42.9 | 10.1 | 32.7 | 5.85 | 80 | 59.5 | 56.5 | 62.6 |
| 1985-1990 | 150 000 | 33 000 | 117 000 | 38.2 | 8.4 | 29.8 | 5.00 | 65 | 62.2 | 59.0 | 65.5 |
| 1990-1995 | 156 000 | 29 000 | 127 000 | 35.4 | 6.5 | 28.9 | 4.50 | 48 | 66.1 | 63.5 | 68.7 |
| 1995-2000 | 147 000 | 27 000 | 120 000 | 30.1 | 5.6 | 24.6 | 3.60 | 34 | 68.4 | 65.9 | 71.1 |
| 2000-2005 | 139 000 | 26 000 | 112 000 | 25.8 | 5.2 | 20.6 | 2.91 | 26 | 70.9 | 68.0 | 73.8 |
| 2005-2010 | 140 000 | 27 000 | 113 000 | 24.3 | 5.1 | 19.2 | 2.68 | 22 | 72.9 | 69.9 | 76.0 |
| 2010-2015 | 22.8 | 5.0 | 17.8 | 2.54 | |||||||
| 2015-2020 | 20.9 | 5.1 | 15.8 | 2.42 | |||||||
| 2020-2025 | 18.7 | 5.1 | 13.6 | 2.28 | |||||||
| 2025-2030 | 17.1 | 5.3 | 11.8 | 2.16 | |||||||
| * CBR = crude birth rate (per 1000); CDR = crude death rate (per 1000); NC = natural change (per 1000); IMR = infant mortality rate per 1000 births; TFR = total fertility rate (number of children per woman) | |||||||||||
Fertility and births[]
Total Fertility Rate (TFR) (Wanted Fertility Rate) and Crude Birth Rate (CBR):[9]
| Year | CBR (Total) | TFR (Total) | CBR (Urban) | TFR (Urban) | CBR (Rural) | TFR (Rural) |
|---|---|---|---|---|---|---|
| 1998 | 29 | 3,6 (2,5) | 2,9 (2,0) | 5,0 (3,3) | ||
| 2001 | 27 | 3,2 (2,3) | 24 | 2,6 (1,8) | 31 | 4,4 (3,0) |
| 2006-2007 | 2,7 | 2,2 | 3,5 | |||
| 2011/2012 | 2,4 | 2,1 | 2,9 |
| Year | Population | Live births | Deaths | Natural increase | Crude birth rate | Crude death rate | Rate of natural increase | TFR |
|---|---|---|---|---|---|---|---|---|
| 1990 | 3,959,785 | |||||||
| 1991 | 4,058,434 | |||||||
| 1992 | 4,162,367 | |||||||
| 1993 | 4,268,685 | |||||||
| 1994 | 4,374,490 | |||||||
| 1995 | 4,476,881 | |||||||
| 1996 | 4,574,524 | |||||||
| 1997 | 4,669,352 | |||||||
| 1998 | 4,763,366 | |||||||
| 1999 | 4,858,570 | |||||||
| 2000 | 4,956,964 | |||||||
| 2001 | 5,058,643 | |||||||
| 2002 | 5,162,275 | |||||||
| 2003 | 5,267,714 | |||||||
| 2004 | 5,374,820 | |||||||
| 2005 | 5,483,447 | 121,380 | 16,770 | 104,610 | 22.1 | 3.1 | 19.0 | 2.94 |
| 2006 | 5,522,606 | 123,886 | 16,595 | 107,291 | 22.4 | 3.0 | 19.4 | |
| 2007 | 5,595,541 | 128,171 | 17,288 | 110,883 | 22.9 | 3.1 | 19.8 | 2.509 |
| 2008 | 5,668,876 | 129,506 | 18,262 | 111,244 | 22.8 | 3.2 | 19.6 | 2.487 |
| 2009 | 5,742,310 | 132,222 | 18,179 | 114,043 | 23.0 | 3.2 | 19.8 | 2.492 |
| 2010 | 5,815,524 | 132,165 | 19,944 | 112,221 | 22.7 | 3.4 | 19.3 | 2.458 |
| 2011 | 5,996,619 | 140,958 | 19,523 | 121,435 | 23.5 | 3.3 | 20.2 | 2.541 |
| 2012 | 6,071,045 | 142,874 | 20,300 | 122,574 | 23.5 | 3.3 | 20.2 | 2.544 |
| 2013 | 6,134,270 | 142,756 | 21,381 | 121,375 | 23.3 | 3.5 | 19.8 | 2.526 |
| 2014 | 6,198,154 | 143,421 | 22,469 | 120,952 | 23.1 | 3.6 | 19.5 | 2.521 |
| 2015 | 6,262,703 | 144,597 | 23,540 | 121,057 | 23.1 | 3.8 | 19.3 | 2.524 |
| 2016 | 6,327,927 | 139,595 | 23,738 | 115,857 | 22.1 | 3.8 | 18.3 | 2.430 |
| 2017 | 6,393,824 | 139,487 | 24,300 | 115,187 | 21.8 | 3.8 | 18.0 | 2.421 |
| 2018 | 6,460,411 | 136,361 | 23,818 | 112,543 | 21.1 | 3.7 | 17.4 | |
| 2019 | 6,527,691 | |||||||
| 2020 | 6,595,674 | 120,140 |
Ethnic groups[]
In the 19th century, there had been a substantial indigenous minority, but this group was also largely assimilated culturally into the mestizo majority. Primarily in the 19th century, Nicaragua saw several waves of immigration from other European nations. In particular the northern cities of Estelí, Jinotega and Matagalpa have significant fourth generation Germans. Most of Nicaragua's population lives in the western region of the country in the departments of Managua, Granada and León.

According to the 2005 census 443,847 (8.6%) residents consider themselves to belong to an indigenous people or to an ethnic community.[13] The remaining majority of the Nicaraguan population (91.6%) are deemed mestizo and white, with the majority of these being of Spanish, with some German, Italian, Portuguese and French ancestry. Mestizos and whites mainly reside in the western region of the country.
Possibly also a part of the black or Afro-Nicaraguan population, which mainly resides on the country's sparsely populated Caribbean (or Atlantic) coast, is included in the majority population which does not consider itself to belong to an ethnic community. In the 2005 census, there were only 19,890 Creoles (0.4% of the total population). The Creole population is mostly of West Indian (Antillean) origin, the descendants of indentured laborers brought mostly from Jamaica when the region was a British protectorate.
The Garifuna, a people of mixed Carib, Angolan, Congolese and Arawak descent, numbered 3,271 in 2005 (0.1%). 112,253 people considered themselves "Mestizo de la Costa Caribe" (mestizo of the Caribbean coast). In addition to the inhabitants who declared themselves Indigenous or Ethnic community, 13,740 answered "Other". Another 47,473 responded "Not Sure" and an additional 19,460 responded "Ignore".
Indigenous population[]
The Native American population, the unmixed descendants of the country's indigenous inhabitants, numbered 227,760 (4.4% of the total population) in 2005.[13] Nicaragua's pre-Columbian consisted of many indigenous groups. In the western region, the Nahua people (also known as the Pipil-Nicaraos) were present along with other groups such as the Chorotega people.
The central region and the Caribbean coast of Nicaragua were inhabited by indigenous peoples who were mostly Chibcha-related groups that had migrated from South America, primarily present day Colombia and Venezuela. These groups include the Miskitos (120,817 people), Matagalpa (15,240 people), Ramas (4,185 people), Sumos (9,756 people) and Ulwa (698 people). Other indigenous peoples include the Subtiaba (19,949 people) and modern-day Chorotegas who are also known as the Mangue (46,002 people).
In the 19th century, there was still a substantial indigenous minority, but this group was largely assimilated culturally into the mestizo majority. In the mid-1980s, the government divided the department of Zelaya – consisting of the eastern half of the country — into two autonomous regions and granted the black and indigenous people of this region limited self-rule within the Republic.
| Those belonging to recognized indigenous communities (2005) | |||||
|---|---|---|---|---|---|
| Rama | 4,185 | 0.9% | Chorotega | 46,002 | 10.4 |
| Sumo | 9,756 | 2.2% | Miskito | 120.817 | 27.2% |
| Ulwa | 698 | 0.2% | Matagalpa | 15,240 | 3.4% |
| Subtiaba | 19,949 | 4.5% | Nahua | 11,113 | 2.5 |
Immigration[]
Relative to its overall population, Nicaragua has never experienced any large scale wave of immigrants. The total number of immigrants to Nicaragua, both originating from other Latin American countries and all other countries, never surpassed 1% of its total population prior to 1995. The 2005 census showed the foreign-born population at 1.2%, having risen 0.06% in 10 years.[5] However, in the 19th century, Nicaragua received immigrants from Europe, who established many agricultural businesses such as coffee and sugar cane plantations, and also newspapers, hotels and banks.

Emigration[]
During the Nicaraguan Revolution and the Civil War, thousands of Nicaraguans left the country. After the 1990 Nicaraguan Elections some people returned, but many more emigrated during the rest of the decade. In 1998, the Hurricane Mitch killed almost 4,000 people in the country and destroyed much of the Nicaraguan economy, as a result thousands of Nicaraguans received the TPS for emigrate to the United States as "refugees".[14] In recent years, many Nicaraguans had left the country to escape poverty and unemployment.
Nicaraguan emigration is a recent process. During the 1990–2004 period, more than 800,000 Nicaraguans left the country, compared to 100,000 during the 1970–1989 period.[15] According to the World Bank, in 2005 there were 683,520 Nicaraguans living outside Nicaragua legally. If those who are undocumented are counted, some sources estimate as many as 1,500,000 Nicaraguans living abroad by the end of 2005.[16] Nicaraguans are the third largest community of Central Americans living abroad, after Guatemalans and Salvadorans. Nicaragua is also the second country in Central America by percentage of population living abroad.
Remittances to Nicaragua represent about 15% of the country's GDP.[17] In 2008 Nicaragua received close to one billion dollars in remittances; an increase from the $750,000,000 received in 2007, according to the World Bank[18]
Language[]
| Language | Speakers |
|---|---|
| Arabic | 400 |
| Chinese | 7,000 |
| English | 20,334 |
| Garífuna | 1,500 |
| Miskito | 154,400 |
| Sign language | 3,000 |
| Spanish | 4,347,000 |
| Sumo | 6,700 |
| Rama | 24 |
| Creole English | 30,000 |
The official language of Nicaragua is Spanish, or Nicañol as Nicaraguan Spanish is sometimes referred to, and is spoken by the country's population. In Nicaragua the Voseo form is common, just as in other countries in Central and South America like Honduras, Argentina, and Uruguay. Spanish has many different dialects spoken throughout Latin America, Central American Spanish is the dialect spoken in Nicaragua.
- Phonology
Some other characteristics of Nicaraguan phonology include:
- /s/ at the end of a syllable or before a consonant is pronounced like [h].
- j (/x/), is aspirated; it is soft as the /h/ in English (e.g.: Yahoo).
- Intervocalic /b/, /d/, and /g/ show no sign of reduction, and are much more pronounced than in most dialects.
- In some regions the double /l/ is pronounced with a ( "Shhh") sound, Argentina has a similar accent.
- There is no confusion between /l/ and /r/, as in the Caribbean.
- /s/, /z/ and in some cases /c/ (as in cerrar) are pronounced as [s]
- /m/ at the end of a word tends to be pronounced as [n]
Nicaraguans on the Caribbean coast speak their indigenous languages and also English. The indigenous peoples of the east who use their original language tend to also speak Spanish and/or English, the main languages being Miskito language, Sumo language, and Rama language. Creole languages are also present in the Caribbean coast, Nicaragua Creole English has 30,000 speakers.
Nicaragua has many minority groups. Many ethnic groups in Nicaragua, such as the Chinese Nicaraguans and Palestinian Nicaraguans, have maintained their ancestral languages while also speaking Spanish and/or English. Minority languages include Chinese, Arabic, German, Italian among others. Nicaragua also has a total of 3 extinct languages.[20]
Nicaraguan Sign Language is also of particular interest to linguists.
Religion[]
| Religious Affiliation in Nicaragua (census 2005 )[12] | |
| Religion | Percentage |
|---|---|
| Roman Catholic | 58.5% |
| Evangelical | 21.6% |
| Moravian | 1.6% |
| Jehovah's Witnesses | 0.9% |
| None | 15.7% |
| Other1 | 1.6% |
| 1 Includes Buddhism, Islam, and Judaism among other religions. | |
| Source: 2005 Nicaraguan Census[12] | |
Religion is a significant part of the culture of Nicaragua and forms part of the constitution. Religious freedom, which has been guaranteed since 1939, and religious tolerance is promoted by both the Nicaraguan government and the constitution. Bishops are expected to lend their authority to important state occasions, and their pronouncements on national issues are closely followed. They can also be called upon to mediate between contending parties at moments of political crisis.[21]
Although Nicaragua has no official religion it is nominally Roman Catholic. Practicing Roman Catholics are no longer the majority and are declining while evangelical Protestant groups and Mormons are growing rapidly have been growing since the 1990s. There are also strong Anglican and Moravian communities on the Caribbean coast.
Roman Catholicism came to Nicaragua in the 16th century with the Spanish conquest and remained, until 1939, the established faith. Protestantism and various Christian sects came to Nicaragua during the 19th century, but only during the 20th century have Protestant denominations gained large followings in the Caribbean Coast of the country. Popular religion revolves around the saints, who are perceived as intermediaries between human beings and God.[21]
Most localities, from the capital of Managua to small rural communities, honor patron saints selected from the Roman Catholic calendar with annual fiestas. In many communities, a rich lore has grown up around the celebrations of patron saints, such as Managua's Saint Dominic (Santo Domingo), honored in August with two colorful, often riotous, day-long processions through the city. The high point of Nicaragua's religious calendar for the masses is neither Christmas nor Easter, but La Purísima, a week of festivities in early December dedicated to the Immaculate Conception, during which elaborate altars to the Virgin Mary are constructed in homes and workplaces.[21]
See also[]
- Culture of Nicaragua
- National Institute of Statistics and Census of Nicaragua
General:
References[]
- ^ Jump up to: a b c d ""World Population prospects – Population division"". population.un.org. United Nations Department of Economic and Social Affairs, Population Division. Retrieved November 9, 2019.
- ^ Jump up to: a b c d ""Overall total population" – World Population Prospects: The 2019 Revision" (xslx). population.un.org (custom data acquired via website). United Nations Department of Economic and Social Affairs, Population Division. Retrieved November 9, 2019.
- ^ "The World Factbook — Central Intelligence Agency". Cia.gov. Retrieved 3 October 2017.
- ^ "Instituto Nacional de Información de Desarrollo- INIDE de Nicaragua". Inide.gob.ni. Retrieved 3 October 2017.
- ^ Jump up to: a b c "VIII Censo de Poblacion y IV de Vivienda" (PDF). Instituto Nacional de Estadística y Censos (in Spanish). October 2005. Archived from the original (PDF) on 2007-08-24. Retrieved 2007-07-07.
- ^ Jump up to: a b Population Division of the Department of Economic and Social Affairs of the United Nations Secretariat, World Population Prospects: The 2012 Revision Archived May 6, 2011, at the Wayback Machine
- ^ "United Nations Statistics Division - Demographic and Social Statistics". Unstats.un.org. Retrieved 3 October 2017.
- ^ "Nicaraguan 2005 Census" (PDF). INEC. Archived from the original (PDF) on 2007-08-24. Retrieved 2007-09-19.
- ^ "MEASURE DHS: Demographic and Health Surveys". Microdata.worldbank.org. Retrieved 3 October 2017.
- ^ "3. Live births, deaths, and infant deaths, latest available year (2002 - 2016)" (PDF). Unstats.un.org. Retrieved 3 October 2017.
- ^ https://www.inide.gob.ni/Home/Compendios
- ^ Jump up to: a b c d "Central America and Caribbean :: NICARAGUA". CIA The World Factbook. Retrieved 3 October 2017.
- ^ Jump up to: a b "CAPÍTULO 1 : CENSO DE POBLACIÓN" (PDF). Inide.gob.ni. Retrieved 3 October 2017.
- ^ "Archived copy". Archived from the original on 2007-05-20. Retrieved 2007-05-24.CS1 maint: archived copy as title (link)
- ^ "Archived copy". Archived from the original on 2008-06-04. Retrieved 2009-08-13.CS1 maint: archived copy as title (link)
- ^ "Nicaragüenses en el exterior divididos y rizo no renunciará". Lajornadanet.com. Retrieved 3 October 2017.
- ^ "The World Factbook — Central Intelligence Agency". Cia.gov. Retrieved 3 October 2017.
- ^ "Nicaragua" (PDF). Siteresources.worldbank.org. Retrieved 3 October 2017.
- ^ "Languages of Nicaragua". Ethnologue. Retrieved 2007-09-08.
- ^ "Nicaragua". Ethnologue.com. Retrieved 3 October 2017.
- ^ Jump up to: a b c Dennis, Gilbert. "Nicaragua: Religion". Country Studies. Library of Congress. Retrieved 2007-10-30.
![]() This article incorporates public domain material from the CIA World Factbook website https://www.cia.gov/the-world-factbook/.
This article incorporates public domain material from the CIA World Factbook website https://www.cia.gov/the-world-factbook/.
External links[]
- CIA World Factbook
- "Población Total, estimada al 30 de Junio del año 2012" (PDF). Inide.gob.ni. Retrieved 3 October 2017.
- Demographics of Nicaragua
- Nicaraguan society