El Encanto
El Encanto | |
|---|---|
Municipality and town | |
 Location of the municipality and town of El Encanto in the Amazonas Department of Colombia | |
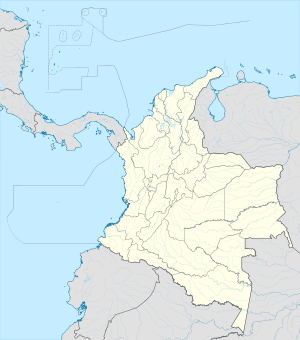 El Encanto Location in Ecuador | |
| Coordinates: 1°46′44″S 73°12′38″W / 1.77889°S 73.21056°WCoordinates: 1°46′44″S 73°12′38″W / 1.77889°S 73.21056°W | |
| Country | |
| Department | |
| Area | |
| • Total | 10,724 km2 (4,141 sq mi) |
| Population (2005) | |
| • Total | 4,376 |
| Time zone | UTC-5 (Colombia Standard Time) |
| Climate | Af |

El Encanto is a town and municipality in the Amazonas Department, Colombia. It is located in the mouth of the , tributary of the Putumayo River (Içá). El Encanto can be reached by air or river. The local navy base has a runway available only to military and official planes, these were established during the Colombia-Peru War. By river the closest towns with airport access are Puerto Arturo, Peru from downstream, and Puerto Leguízamo (Putumayo Department, Colombia) upstream.
The majority of inhabitants in the area are Huitotos indigenous tribes. The municipality has an area of 10,724 square kilometres or 4,141 square miles.
Climate[]
El Encanto has a tropical rainforest climate (Köppen Af) with heavy rainfall year-round.
| Climate data for El Encanto | |||||||||||||
|---|---|---|---|---|---|---|---|---|---|---|---|---|---|
| Month | Jan | Feb | Mar | Apr | May | Jun | Jul | Aug | Sep | Oct | Nov | Dec | Year |
| Average high °C (°F) | 31.3 (88.3) |
31.6 (88.9) |
31.2 (88.2) |
31.4 (88.5) |
31.4 (88.5) |
31.0 (87.8) |
29.7 (85.5) |
29.8 (85.6) |
30.8 (87.4) |
31.1 (88.0) |
31.2 (88.2) |
31.5 (88.7) |
31.0 (87.8) |
| Daily mean °C (°F) | 26.6 (79.9) |
26.7 (80.1) |
26.5 (79.7) |
26.5 (79.7) |
26.7 (80.1) |
25.6 (78.1) |
25.4 (77.7) |
25.8 (78.4) |
26.2 (79.2) |
26.4 (79.5) |
27.1 (80.8) |
26.6 (79.9) |
26.3 (79.4) |
| Average low °C (°F) | 22.0 (71.6) |
21.8 (71.2) |
21.8 (71.2) |
21.7 (71.1) |
22.4 (72.3) |
21.5 (70.7) |
21.0 (69.8) |
20.9 (69.6) |
21.3 (70.3) |
22.2 (72.0) |
23.1 (73.6) |
21.8 (71.2) |
21.8 (71.2) |
| Average rainfall mm (inches) | 210.7 (8.30) |
230.2 (9.06) |
303.3 (11.94) |
341.6 (13.45) |
333.1 (13.11) |
293.7 (11.56) |
250.4 (9.86) |
229.1 (9.02) |
183.3 (7.22) |
197.4 (7.77) |
256.3 (10.09) |
236.2 (9.30) |
3,065.3 (120.68) |
| Average rainy days | 14 | 14 | 17 | 16 | 19 | 19 | 17 | 14 | 14 | 14 | 15 | 15 | 188 |
| Source 1: IDEAM[1] | |||||||||||||
| Source 2: Climate-Data.org[2] | |||||||||||||
References[]
- ^ "Data". www.ideam.gov.co. Retrieved 2020-08-21.
- ^ "Climate: El Encanto". Climate-Data.org. Retrieved August 21, 2020.
This Department of Amazonas location article is a stub. You can help Wikipedia by . |
External links[]
(in Spanish) El Encanto official website
Municipalities in the Amazonas Department | ||
|---|---|---|
| ||
- Amazonia Region (Colombia) geography stubs
- Municipalities of Amazonas Department