Elections in the Faroe Islands
 |
|---|
|
|
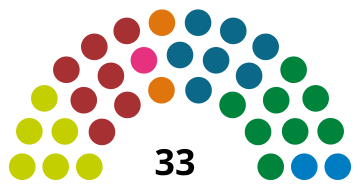
The Faroe Islands elects on national level a legislature. The Faroese Parliament (Løgtingið in Faroese) has 33 members of parliament, elected for a four-year term by proportional representation. The Faroe Islands have a multi-party system (disputing on independence and unionism as well as left and right), with numerous parties in which a single party normally does not have a chance of gaining power alone, and therefore the parties must work together in order to form a coalition government.
Latest elections[]
 | |||||
| Party | Votes | % | Seats | +/– | |
|---|---|---|---|---|---|
| People's Party | 8,290 | 24.54 | 8 | +2 | |
| Social Democratic Party | 7,480 | 22.14 | 7 | –1 | |
| Union Party | 6,874 | 20.35 | 7 | +1 | |
| Republic | 6,127 | 18.14 | 6 | –1 | |
| Centre Party | 1,815 | 5.37 | 2 | 0 | |
| Progress | 1,559 | 4.62 | 2 | 0 | |
| Self-Government | 1,157 | 3.43 | 1 | –1 | |
| Cannabis Initiative | 310 | 0.92 | 0 | New | |
| Faroese Party | 167 | 0.49 | 0 | New | |
| Total | 33,779 | 100.00 | 33 | 0 | |
| Valid votes | 33,779 | 99.56 | |||
| Invalid/blank votes | 150 | 0.44 | |||
| Total votes | 33,929 | 100.00 | |||
| Registered voters/turnout | 37,827 | 89.70 | |||
| Source: KVF | |||||
Past elections and referendums[]
- JF – Social-Democrats (Equality Party)
- SF – Union Party (have been in coalition with the and the Self-Government Party at some elections)
- TF – Republican Party
- FF – People's Party
- SSF – Self-Government Party
- MF – Centre Party
- KFF – Christian People's Party
- VF – Workers' Movement
- F – Progress
1984[]
JF – 23.4%, 8 MPs
FF – 21.6%, 7 MPs
SF – 21.2%, 7 MPs
TF – 19.5%, 6 MPs
SSF – 8.5%, 2 MPs
KFF – 5.8%, 2 MPs
1988[]
FF – 23.2%, 8 MPs
JF – 21.6%, 7 MPs
SF – 21.2%, 7 MPs
TF – 16.2%, 6 MPs
SSF – 7.1%, 2 MPs
KFF – 5.5%, 2 MPs
Others – 2.2%, 0 MPs
1990[]
JF – 27.5%, 10 MPs
FF – 21.9%, 7 MPs
SF – 18.9%, 6 MPs
TF – 14.7%, 4 MPs
SSF – 8.8%, 3 MPs
KFF – 5.9%, 2 MPs
Others – 2.3%, 0 MPs
1994[]
SF – 23.4%, 8 MPs
FF – 16.0%, 6 MPs
JF – 15.4%, 5 MPs
TF – 13.7%, 4 MPs
VF – 9.5%, 3 MPs
KFF – 6.3%, 2 MPs
MF – 5.8%, 2 MPs
SSF – 5.6%, 2 MPs
Others – 4.3%, 0 MPs
1998[]
TF – 23.8%, 8 MPs
JF – 21.9%, 7 MPs
FF – 21.3%, 8 MPs
SF – 18.0%, 6 MPs
SSF – 7.7%, 2 MPs
MF – 4.1%, 1 MPs
KFF – 2.5%, 0 MPs
VF – 0.8%, 0 MPs
Others – 0.8%, 0 MPs
2002[]
SF – 26.0%, 8 MPs
TF – 23.7%, 8 MPs
JF – 20.9%, 7 MPs
FF – 20.8%, 7 MPs
SSF – 4.4%, 1 MPs
MF – 4.2%, 1 MP
2004[]
SF – 23.7%, 7 MPs
JF – 21.8%, 7 MPs
TF – 21.7%, 8 MPs
FF – 20.6%, 7 MPs
MF – 5.2%, 2 MPs
SSF – 4.6%, 1 MP
2008[]
TF – 23.3%, 8 MPs
SF – 21%, 7 MPs
FF – 20.1%, 7 MPs
JF – 19.4%, 6 MPs
MF – 8.4%, 3 MPs
SSF – 7.2%, 2 MPs
Others – 0.7%, 0 MPs
2011[]
SF – 24.7%, 8 MPs
TF – 23.3%, 8 MPs
FF – 18.3%, 6 MPs
JF – 17.7%, 6 MPs
F – 6.3%, 2 MPs
MF – 6.2%, 2 MPs
SSF – 4.2%, 1 MP
2015[]
JF – 25.1%, 8 MPs
TF – 20.7%, 7 MPs
FF – 18.9%, 6 MPs
SF – 18.7%, 6 MPs
F – 7.0%, 2 MPs
MF – 5.5%, 2 MPs
SSF – 4.1%, 2 MPs
See also[]
- Electoral calendar
- Electoral system
External links[]
| Løgting elections | |
|---|---|
| Referendums | |
See also: Elections and referendums in Denmark | |
Faroe Islands articles | |||||||
|---|---|---|---|---|---|---|---|
| |||||||
| History |  | ||||||
| Geography |
| ||||||
| Politics |
| ||||||
| Economy | |||||||
| Society |
| ||||||
| |||||||
- Elections in the Faroe Islands
- Elections in Denmark