Elections in Denmark
Politics of Denmark |
|---|
 |
|
There are three types of elections in Denmark: elections to the national parliament (the Folketing), local elections (to municipal and regional councils), and elections to the European Parliament. Referendums may also be called to consult the Danish citizenry directly on an issue of national concern.
Parliamentary elections are called by the Monarch on the advice of the Prime Minister, usually three to four years after the last election, although early elections may occur. Elections to local councils (municipal or regional) and to the European Parliament are held on fixed dates. Elections use the party-list proportional representation system. All Danish citizens, living in the Kingdom of Denmark and at least 18 years of age, are eligible to vote in parliamentary elections and long-time residents may vote in local elections.
Parliamentary elections[]

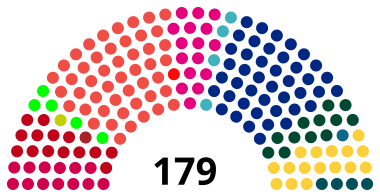
The Kingdom of Denmark (including the Faroe Islands and Greenland) elects a unicameral parliament, the Folketing, on a national level. Of the 179 members of parliament, the Faroe Islands and Greenland elect two members each, 135 are elected from ten multi-member constituencies on a party list PR system using the d'Hondt method and the remaining 40 seats are allocated to ensure proportionality at a national level. To get a share of supplementary seats a party needs to get at least 2% of the total number of votes.
Denmark has a multi-party system, with numerous parties in which no one party often has a chance of gaining power alone, and parties must work with each other to form coalition governments and/or minority cabinets.
Elections to the Folketing must be held at least every four years.
Latest general election[]
2019 general election[]
Overall the election was a win for the "red bloc" – the parties that supported Mette Frederiksen, leader of the Social Democrats, as Prime Minister. In total, the Social Democrats, the Social Liberals, Socialist People's Party and the Red–Green Alliance won 91 seats. Green party The Alternative chose to go into opposition as a "green bloc".[1]
The Social Democrats defended their position as the largest party, and won an additional seat despite a slightly reduced voter share. They were closely followed by Venstre, who saw the largest gains in seats, picking up an extra nine. In the "blue bloc", only Venstre and the Conservative People's Party saw gains, the latter doubling their seats. The Danish People's Party's vote share fell by 12.4 percentage points (pp), well over half of their support. Leader Kristian Thulesen Dahl speculated that the bad result was due to an extraordinary good election in 2015, and that some voters felt they could "gain [their] policy elsewhere".[2] The Liberal Alliance saw their vote share fall by over two-thirds and became the smallest party in the Folketing, only 0.3pp above the 2% election threshold. Their leader Anders Samuelsen was not reelected and he subsequently resigned as leader, succeeded by Alex Vanopslagh.[3][4]
Of the new parties, only the New Right won seats, with Hard Line, the Christian Democrats and Klaus Riskær Pedersen failing to cross the national 2% threshold, although the Christian Democrats were within 200 votes of winning a direct seat in the western Jutland constituency.[5] On election night, announced that he would dissolve his party.[6]
In the Faroe Islands, Republic (which had finished first in the 2015 elections)[7] dropped to fourth place and lost their seat. The Union Party replaced them as the first party while the Social Democratic Party finished in second place again, retaining their seat.[8] In Greenland, the result was a repeat of the 2015 elections, with Inuit Ataqatigiit and Siumut winning the two seats. Siumut regained parliamentary representation after their previous MP, Aleqa Hammond, was expelled from the party in 2016.[9][10] Hammond later joined Nunatta Qitornai,[11] which finished fourth and failed to win a seat.[10][12]

| |||||
|---|---|---|---|---|---|
| Party | Votes | % | Seats | +/– | |
| Denmark proper | |||||
| Social Democrats (A) | 914,882 | 25.9 | 48 | +1 | |
| Venstre (V) | 826,161 | 23.4 | 43 | +9 | |
| Danish People's Party (O) | 308,513 | 8.7 | 16 | –21 | |
| Danish Social Liberal Party (B) | 304,714 | 8.6 | 16 | +8 | |
| Socialist People's Party (F) | 272,304 | 7.7 | 14 | +7 | |
| Red–Green Alliance (Ø) | 245,100 | 6.9 | 13 | –1 | |
| Conservative People's Party (C) | 233,865 | 6.6 | 12 | +6 | |
| The Alternative (Å) | 104,278 | 3.0 | 5 | –4 | |
| The New Right (D) | 83,201 | 2.4 | 4 | New | |
| Liberal Alliance (I) | 82,270 | 2.3 | 4 | –9 | |
| Hard Line (P) | 63,114 | 1.8 | 0 | New | |
| Christian Democrats (K) | 60,944 | 1.7 | 0 | 0 | |
| Klaus Riskær Pedersen (E) | 29,600 | 0.8 | 0 | New | |
| Independents | 2,774 | 0.1 | 0 | 0 | |
| Invalid/blank votes | 37,801 | – | – | – | |
| Total | 3,569,521 | 100 | 175 | 0 | |
| Registered voters/turnout | 4,219,537 | 84.6 | – | – | |
| Faroe Islands | |||||
| Union Party | 7,349 | 28.3 | 1 | +1 | |
| Social Democratic Party | 6,630 | 25.5 | 1 | 0 | |
| People's Party | 6,181 | 23.8 | 0 | 0 | |
| Republic | 4,830 | 18.6 | 0 | –1 | |
| Progress | 639 | 2.5 | 0 | 0 | |
| Self-Government Party | 333 | 1.3 | 0 | 0 | |
| Invalid/blank votes | 244 | – | – | – | |
| Total | 26,206 | 100 | 2 | 0 | |
| Registered voters/turnout | 37,264 | 70.3 | – | – | |
| Greenland | |||||
| Inuit Ataqatigiit | 6,881 | 33.4 | 1 | 0 | |
| Siumut | 6,058 | 29.4 | 1 | 0 | |
| Democrats | 2,262 | 11.0 | 0 | 0 | |
| Nunatta Qitornai | 1,616 | 7.8 | 0 | New | |
| Partii Naleraq | 1,565 | 7.6 | 0 | 0 | |
| Atassut | 1,099 | 5.3 | 0 | 0 | |
| Cooperation Party | 520 | 2.5 | 0 | New | |
| Invalid/blank votes | 614 | – | – | – | |
| Total | 20,615 | 100 | 2 | 0 | |
| Registered voters/turnout | 41,344 | 49.9 | – | – | |
| Source: Statistics Denmark, Kringvarp Føroya, Qinersineq | |||||
Results by constituency[]
| Constituency | A | B | C | D | E | F | I | K | O | P | V | Ø | Å |
|---|---|---|---|---|---|---|---|---|---|---|---|---|---|
| Copenhagen | 17.2 | 16.4 | 5.3 | 1.4 | 1.0 | 11.5 | 2.6 | 0.7 | 4.2 | 1.3 | 15.0 | 16.8 | 6.5 |
| Greater Copenhagen | 25.8 | 10.9 | 9.4 | 2.3 | 0.8 | 9.4 | 2.6 | 0.9 | 8.2 | 1.9 | 17.2 | 7.2 | 3.1 |
| North Zealand | 21.3 | 11.2 | 11.2 | 3.3 | 1.0 | 6.9 | 3.3 | 1.1 | 7.5 | 1.5 | 23.4 | 5.6 | 2.7 |
| Bornholm | 34.0 | 3.3 | 1.8 | 1.7 | 0.9 | 4.3 | 1.0 | 4.1 | 10.4 | 1.9 | 25.3 | 8.1 | 3.3 |
| Zealand | 28.2 | 5.8 | 5.8 | 2.6 | 1.0 | 8.8 | 1.8 | 0.8 | 10.9 | 2.7 | 24.3 | 5.2 | 2.0 |
| Funen | 30.2 | 7.3 | 6.2 | 1.9 | 0.8 | 6.7 | 1.9 | 1.1 | 8.9 | 1.9 | 23.4 | 6.8 | 3.0 |
| South Jutland | 26.1 | 5.9 | 5.1 | 4.1 | 0.7 | 5.2 | 2.1 | 2.2 | 12.5 | 1.8 | 28.5 | 4.1 | 1.6 |
| East Jutland | 25.8 | 9.9 | 5.7 | 2.0 | 0.7 | 8.2 | 2.9 | 2.1 | 7.8 | 1.5 | 22.6 | 7.1 | 3.4 |
| West Jutland | 24.6 | 5.3 | 9.2 | 1.7 | 0.6 | 6.2 | 2.2 | 5.3 | 8.4 | 1.6 | 29.8 | 3.4 | 1.7 |
| North Jutland | 33.9 | 5.1 | 4.9 | 2.0 | 0.8 | 5.4 | 1.9 | 1.6 | 9.5 | 1.7 | 26.8 | 4.3 | 2.0 |
Seat distribution[]
The following is the number of constituency seats for each party with parenteses indicating levelling seats.[13]
| Constituency | A | B | C | D | F | I | O | V | Ø | Å | Total |
|---|---|---|---|---|---|---|---|---|---|---|---|
| Copenhagen | 3 | 3 | 1 | 2 (1) | (1) | (1) | 3 | 3 (1) | 1 | 16 (4) | |
| Greater Copenhagen | 4 | 1 (1) | 1 | 1 | 1 | 2 (1) | 1 | (1) | 11 (3) | ||
| North Zealand | 3 | 1 (1) | 1 (1) | (1) | 1 | 1 | 3 | (1) | 10 (4) | ||
| Bornholm | 1 | 1 | 2 | ||||||||
| Zealand | 7 (1) | 1 (1) | 1 (1) | (1) | 2 (1) | 2 (1) | 6 (1) | 1 (1) | (1) | 20 (9) | |
| Funen | 4 (1) | 1 | 1 | 1 | 1 (1) | 3 (1) | 1 | 12 (3) | |||
| South Jutland | 6 | 1 | 1 | (1) | 1 | (1) | 3 | 6 | (1) | 18 (3) | |
| East Jutland | 6 (1) | 2 (1) | 1 | (1) | 2 | (1) | 1 (1) | 5 (1) | 1 | (1) | 18 (7) |
| West Jutland | 4 | 1 | 1 (1) | 1 | (1) | 1 | 5 | (1) | 13 (3) | ||
| North Jutland | 6 (1) | 1 | 1 | 1 | 1 (1) | 5 | (1) | (1) | 15 (4) | ||
| Total | 44 (4) | 12 (4) | 9 (3) | (4) | 12 (2) | (4) | 11 (5) | 39 (4) | 7 (6) | 1 (4) | 135 (40) |
Local elections[]
The latest elections for the ninety-eight municipal councils and the five regional councils were held on 16 November 2021.
European elections[]
The Denmark constituency directly elects thirteen members to the European Parliament every five years. The d'Hondt method of proportional representation is used. The last elections took place in May 2019:
Referendums[]
The Constitution of Denmark requires a referendum to be held in the following three cases:
- if one third of the members of the Parliament demands a referendum on a law that has been passed in the previous 30 days (excluding some ) (Section 42 of the Constitution),[14] or
- a law that transfers sovereignty to an international organisation has not received a majority of five-sixths of the MPs (Section 20 of the Constitution),[14] or
- in case of changing the electoral age (Section 29 of the Constitution).[14]
The option for one third of the members of the Parliament to put a law to a referendum has a number of restrictions. Finance Bills, Supplementary Appropriation Bills, Provisional Appropriation Bills, Government Loan Bills, Civil Servants (Amendment) Bills, Salaries and Pensions Bills, Naturalization Bills, Expropriation Bills, Taxation (Direct and Indirect) Bills, as well as Bills introduced for the purpose The Work of Parliament of discharging existing treaty obligations shall not be decided by a referendum. (Section 42, Subsection 6 of the Constitution)[14]
Even though the Constitution of Denmark requires referendum to be held only if super-majority of five-sixths of members of Parliament cannot be obtained, in practice, referendums have been held every time new treaties of the European Union have been approved, even when more than five-sixths can be found. Recently, the Danish government was highly criticized when it did not hold a referendum regarding the controversial Lisbon treaty.
In all three cases, to defeat the proposition the no votes must not only outnumber the yes votes, they must also number at least 30% of the electorate.
The Constitution of Denmark can be changed only after a referendum, after a complicated procedure (Section 88 of the Constitution).[14] First a government proposes a change in constitution, then a parliamentary election is held. After the new parliament approves the same text of the constitutional changes, the proposal is put to a referendum. To pass, the yes votes must not only outnumber the no votes, they must also number at least 40% of the electorate.
As of 2013, 16 referendums had been held in Denmark, the most recent being Danish euro referendum in 2000 and Danish Act of Succession referendum in 2009.
Past elections[]
2015 elections[]

| |||||
|---|---|---|---|---|---|
| Party | Votes | % | Seats | +/– | |
| Denmark proper | |||||
| Social Democrats | 924,940 | 26.3 | 47 | +3 | |
| Danish People's Party | 741,746 | 21.1 | 37 | +15 | |
| Venstre | 685,188 | 19.5 | 34 | –13 | |
| Red–Green Alliance | 274,463 | 7.8 | 14 | +2 | |
| Liberal Alliance | 265,129 | 7.5 | 13 | +4 | |
| The Alternative | 168,788 | 4.8 | 9 | New | |
| Danish Social Liberal Party | 161,009 | 4.6 | 8 | –9 | |
| Socialist People's Party | 147,578 | 4.2 | 7 | –9 | |
| Conservative People's Party | 118,003 | 3.4 | 6 | –2 | |
| Christian Democrats | 29,077 | 0.8 | 0 | 0 | |
| Independents | 3,066 | 0.1 | 0 | – | |
| Invalid/blank votes | 41,073 | – | – | – | |
| Total | 3,560,060 | 100 | 175 | 0 | |
| Registered voters/turnout | 4,145,105 | 85.9 | – | – | |
| Faroe Islands | |||||
| Republic | 5,730 | 24.5 | 1 | +1 | |
| Social Democratic Party | 5,666 | 24.3 | 1 | 0 | |
| Union Party | 5,500 | 23.5 | 0 | –1 | |
| People's Party | 4,368 | 18.7 | 0 | 0 | |
| Progress | 749 | 3.2 | 0 | New | |
| Centre Party | 605 | 2.6 | 0 | 0 | |
| Self-Government Party | 403 | 1.7 | 0 | 0 | |
| Independents | 345 | 1.5 | 0 | 0 | |
| Total | 23,366 | 100 | 2 | 0 | |
| Registered voters/turnout | 65.6 | – | – | ||
| Greenland | |||||
| Inuit Ataqatigiit | 7,904 | 38.5 | 1 | 0 | |
| Siumut | 7,831 | 38.2 | 1 | 0 | |
| Atassut | 1,526 | 7.4 | 0 | 0 | |
| Democrats | 1,753 | 8.5 | 0 | 0 | |
| Partii Naleraq | 962 | 4.7 | 0 | New | |
| Invalid/blank votes | 538 | – | – | – | |
| Total | 20,514 | 100 | 2 | 0 | |
| Registered voters/turnout | 41,048 | 50.0 | – | – | |
| Source: DST, KVF, Qinersineq | |||||
2011 elections[]

| |||||
|---|---|---|---|---|---|
| Party | Votes | % | Seats | +/– | |
| Denmark proper | |||||
| Venstre | 947,725 | 26.7 | 47 | +1 | |
| Social Democrats (A) | 879,615 | 24.8 | 44 | −1 | |
| Danish People's Party (O) | 436,726 | 12.3 | 22 | −3 | |
| Danish Social Liberal Party (B) | 336,698 | 9.5 | 17 | +8 | |
| Socialist People's Party (F) | 326,192 | 9.2 | 16 | −7 | |
| Red-Green Alliance (Ø) | 236,860 | 6.7 | 12 | +8 | |
| Liberal Alliance (I) | 176,585 | 5.0 | 9 | +4 | |
| Conservative People's Party (C) | 175,047 | 4.9 | 8 | −10 | |
| Christian Democrats (K) | 28,070 | 0.8 | 0 | 0 | |
| Independents | 1,850 | 0.1 | 0 | 0 | |
| Invalid/blank votes | 34,307 | – | – | – | |
| Total | 3,545,368 | 100 | 175 | 0 | |
| Registered voters/turnout | 4,079,910 | 87.7 | – | – | |
| Faroe Islands | |||||
| Union Party (B) | 6,361 | 30.8 | 1 | 0 | |
| Social Democratic Party (C) | 4,328 | 21.0 | 1 | +1 | |
| Republic (E) | 3,998 | 19.4 | 0 | −1 | |
| People's Party (A) | 3,932 | 19.0 | 0 | 0 | |
| Centre Party (H) | 872 | 4.2 | 0 | 0 | |
| Self-Government Party (D) | 481 | 2.3 | 0 | 0 | |
| Independents | 672 | 3.3 | 0 | 0 | |
| Invalid/blank votes | 301 | – | – | – | |
| Total | 20,644 | 100 | 2 | 0 | |
| Registered voters/turnout | 35,044 | 58.9 | – | – | |
| Greenland | |||||
| Inuit Ataqatigiit | 9,780 | 42.7 | 1 | 0 | |
| Siumut | 8,499 | 37.1 | 1 | 0 | |
| Democrats | 2,882 | 12.6 | 0 | 0 | |
| Atassut | 1,728 | 7.5 | 0 | 0 | |
| Independents | 24 | 0.1 | 0 | 0 | |
| Invalid/blank votes | 612 | – | – | – | |
| Total | 22,913 | 100 | 2 | 0 | |
| Registered voters/turnout | 40,935 | 57.4 | – | – | |
| Source:[15][16][17][18][19] | |||||
2007 elections[]

| ||||||
|---|---|---|---|---|---|---|
| Party | Votes | % | Seats | +/– | ||
| Denmark proper | ||||||
| Venstre | 908,472 | 26.2 | 46 | –6 | ||
| Social Democrats | 881,037 | 25.5 | 45 | –2 | ||
| Danish People's Party | 479,532 | 13.9 | 25 | +1 | ||
| Socialist People's Party | 450,975 | 13.0 | 23 | +12 | ||
| Conservative People's Party | 359,404 | 10.4 | 18 | ±0 | ||
| Danish Social Liberal Party | 177,161 | 5.1 | 9 | –8 | ||
| New Alliance | 97,295 | 2.8 | 5 | New | ||
| Red-Green Alliance | 74,982 | 2.2 | 4 | –2 | ||
| Christian Democrats | 30,013 | 0.9 | 0 | ±0 | ||
| Independents | 549 | 0.0 | 0 | ±0 | ||
| Invalid/blank votes | 24,113 | – | – | – | ||
| Total | 3,483,533 | 100 | 175 | 0 | ||
| Faroe Islands | ||||||
| Republic | 5,849 | 25.4 | 1 | ±0 | ||
| Union Party | 5,414 | 23.5 | 1 | +1 | ||
| People's Party | 4,728 | 20.5 | 0 | –1 | ||
| Social Democratic Party | 4,702 | 20.4 | 0 | ±0 | ||
| Centre Party | 1,573 | 6.8 | 0 | ±0 | ||
| Self-Government Party | 799 | 3.5 | 0 | 0 | ||
| Invalid/blank votes | 149 | – | – | – | ||
| Total | 23,214 | 100 | 2 | 0 | ||
| Greenland | ||||||
| Inuit Ataqatigiit | 8,068 | 32.5 | 1 | ±0 | ||
| Siumut | 8,068 | 32.5 | 1 | ±0 | ||
| Democrats | 4,584 | 18.5 | 0 | ±0 | ||
| Atassut | 4,094 | 16.5 | 0 | ±0 | ||
| Invalid/blank votes | 500 | – | – | – | ||
| Total | 25,589 | 100 | 2 | 0 | ||
| Source: Nohen & Stöver[20] | ||||||
| Party | Votes | % of votes | MPs | swing | % of MPs | MPs %/votes % | |
|---|---|---|---|---|---|---|---|
| Total | 100 | 179 | 100 | 1.00 | |||
| 3 biggest | 65.6 | 116 | 64.8 | 0.99 | |||
| The cabinet | 50.5 | 90 | 50.3 | 0.98 | |||
| The opposition | 49.5 | 89 | 49.7 | 1.02 |
See also[]
- Politics of Denmark
- Cabinet of Denmark
- Electoral calendar
- Faroe election results
- Greenland election results
References[]
- ^ Kildegaard, Kasper (6 June 2019). "På en varm dag i juni blev Danmark malet rødt: Nu venter benhårde forhandlinger". Berlingske (in Danish). Retrieved 6 June 2019.
- ^ "Thulesen: Vi har fået en vælgerlussing". Politiken (in Danish). 5 June 2019. Retrieved 6 June 2019.
- ^ Ingvorsen, Emil Søndergård; Nielsen, Kevin Ahrens (9 June 2019). "Alex Vanopslagh bliver Liberal Alliances nye politiske leder". DR (in Danish). Retrieved 9 June 2019.
- ^ Thomsen, Per Bang; Toft, Emma (5 June 2019). "Katastrofevalg til Liberal Alliance: Samuelsen er ude af Folketinget". DR (in Danish). Retrieved 6 June 2019.
- ^ Søe, Carl-Emil (5 June 2019). "Kristendemokraterne under 200 stemmer fra at komme i Folketinget". TV2 (in Danish). Retrieved 6 June 2019.
- ^ Josevski, Aleksandar (5 June 2019). "Klaus Riskær Pedersen opløser sit parti". TV2 (in Danish). Retrieved 6 June 2019.
- ^ Tjóðveldi og Javnaðarflokkurin størstir KVF, 18 June 2015
- ^ Af Andreas Krog | 6. juni 2019 kl. 9:05 | Print (6 June 2019). "Løsrivelsespartier ryger ud af Folketinget". Altinget.dk. Retrieved 6 June 2019.
- ^ "Omstridte Aleqa Hammond smides ud af rødt valgforbund". DR (in Danish). 19 December 2016. Retrieved 21 May 2019.
- ^ a b "Røde partier vinder valget på Grønland". TV 2 (in Danish). 6 June 2019. Retrieved 6 June 2019.
- ^ "Grønlandsk løsrivelsesparti er Løkkes sikkerhedsnet". BT. Ritzau. 26 April 2018. Retrieved 3 May 2019.
- ^ "Kalaallit Nunaanni Qinersinerit – Valg i Greenland". Valg.gl. Retrieved 6 June 2019.
- ^ "Folketingsvalget den 5. juni 2019". Danmarks Statistik. September 2020. p. 84. Retrieved 3 April 2021.
- ^ a b c d e "The Constitution of Denmark". Archived from the original on 2013-11-03. Retrieved 2013-11-01.
- ^ "Folketingsvalg torsdag 15. september 2011". dst.dk. Statistics Denmark. Retrieved 16 September 2011.
- ^ "Kringvarp.fo - Valúrslit". kringvarp.fo. Kringvarp Føroya. Archived from the original on 26 September 2011. Retrieved 16 September 2011.
- ^ "Letter to Statistics Denmark regarding the Faroese election results" (PDF). dst.dk. Statistics Denmark. Retrieved 16 September 2011.
- ^ "Folketingimut qinersineq 2011-mi inernerit". knr.gl. KNR. Archived from the original on 7 November 2011. Retrieved 16 September 2011.
- ^ "Letter to Statistics Denmark regarding the Greenlandic election results" (PDF). dst.dk. Statistics Denmark. Retrieved 16 September 2011.
- ^ Dieter Nohlen & Philip Stöver (2010) Elections in Europe: A data handbook ISBN 978-3-8329-5609-7
External links[]
- Adam Carr's Election Archive
- Political parties and elections
- NSD: European Election Database - Denmark publishes regional level election data; allows for comparisons of election results, 1990-2007
| Folketing elections |
|
|---|---|
| Landsting elections | |
| European elections | |
| Local elections | |
| Other elections | |
| Referendums | |
| |
Bracketed numbers indicate numbers of seats in the respective parliaments. | |||||||||||
| Folketing |
| ||||||||||
| European Parliament |
| ||||||||||
| Formerly represented |
| ||||||||||
| |||||||||||
Denmark articles | |||||||
|---|---|---|---|---|---|---|---|
Part of the Kingdom of Denmark | |||||||
| History |
|  | |||||
| Geography |
| ||||||
| Politics |
| ||||||
| Economy | |||||||
| Society |
| ||||||
| |||||||
- Elections in Denmark