Free State (National Assembly of South Africa constituency)
| Free State | |
|---|---|
| Freistata | |
| Constituency for the National Assembly of South Africa | |
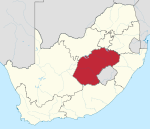 Location of Free State within South Africa | |
| Province | Free State |
| Population | 2,928,903 (2020)[1] |
| Electorate | 1,462,508 (2019) |
| Current constituency | |
| Created | 1994 |
| Seats | List
|
| Members of the National Assembly[2] | List
|
Free State (Sotho: Freistata) is one of the nine multi-member constituencies of the National Assembly of South Africa, the lower house of the Parliament of South Africa, the national legislature of South Africa. The constituency was established as Orange Free State in 1994 when the National Assembly was established by the Interim Constitution following the end of Apartheid. It was renamed Free State in 1999. It is conterminous with the province of Free State. The constituency currently elects 11 of the 400 members of the National Assembly using the closed party-list proportional representation electoral system. At the 2019 general election it had 1,462,508 registered electors.
Electoral system[]
Free State currently elects 11 of the 400 members of the National Assembly using the closed party-list proportional representation electoral system.[3][4] Constituency seats are allocated using the largest remainder method with a Droop quota.[5][6]
Election results[]
Summary[]
| Election | Pan Africanist Congress PAC |
United Democratic Movement UDM |
African National Congress ANC |
Democratic Alliance DA/DP |
New National Party NNP/NP |
African Christian Democratic Party ACDP |
Inkatha Freedom Party IFP |
Economic Freedom Fighters EFF |
Freedom Front Plus VF+/VFFF/VV-FF | ||||||||||||||||||
|---|---|---|---|---|---|---|---|---|---|---|---|---|---|---|---|---|---|---|---|---|---|---|---|---|---|---|---|
| Votes | % | Seats | Votes | % | Seats | Votes | % | Seats | Votes | % | Seats | Votes | % | Seats | Votes | % | Seats | Votes | % | Seats | Votes | % | Seats | Votes | % | Seats | |
| 2019 | 1,359 | 0.15% | 0 | 1,036 | 0.11% | 0 | 570,980 | 62.94% | 8 | 154,686 | 17.05% | 2 | 4,214 | 0.46% | 0 | 799 | 0.09% | 0 | 105,228 | 11.60% | 1 | 33,660 | 3.71% | 0 | |||
| 2014 | 1,989 | 0.19% | 0 | 2,380 | 0.23% | 0 | 721,126 | 69.72% | 8 | 167,972 | 16.24% | 2 | 5,128 | 0.50% | 0 | 1,177 | 0.11% | 0 | 81,559 | 7.89% | 1 | 19,837 | 1.92% | 0 | |||
| 2009 | 3,003 | 0.29% | 0 | 3,408 | 0.32% | 0 | 756,287 | 71.90% | 9 | 127,259 | 12.10% | 2 | 7,410 | 0.70% | 0 | 2,260 | 0.21% | 0 | 16,929 | 1.61% | 0 | ||||||
| 2004 | 13,277 | 1.30% | 0 | 9,785 | 0.96% | 0 | 838,583 | 82.05% | 12 | 90,609 | 8.87% | 1 | 8,380 | 0.82% | 0 | 13,488 | 1.32% | 0 | 4,352 | 0.43% | 0 | 21,107 | 2.07% | 0 | |||
| 1999 | 11,300 | 1.03% | 0 | 18,073 | 1.65% | 0 | 887,091 | 81.03% | 12 | 64,262 | 5.87% | 1 | 54,769 | 5.00% | 1 | 10,031 | 0.92% | 0 | 4,938 | 0.45% | 0 | 19,210 | 1.75% | 0 | |||
| 1994 | 23,310 | 1.70% | 1,059,313 | 77.42% | 7,365 | 0.54% | 198,780 | 14.53% | 4,523 | 0.33% | 8,446 | 0.62% | 50,386 | 3.68% | |||||||||||||
Detailed[]
2019[]
Results of the 2019 general election held on 8 May 2019:[7][8][9]
The following candidates were elected:[10] Dikeledi Direko (ANC), Werner Horn (DA), Thanduxolo Khalipha (ANC), Nomsa Kubheka (ANC), Annelie Lotriet (DA), Dibolelo Mahlatsi (ANC), Lawrence McDonald (ANC), Hlengiwe Mkhaliphi (EFF), (ANC), Xolisile Qayiso (ANC) and Bheki Radebe (ANC).
2014[]
Results of the 2014 general election held on 7 May 2014:[11][12][13]
| Party | Votes | % | Seats | ||
|---|---|---|---|---|---|
| African National Congress | ANC | 721,126 | 69.72% | 8 | |
| Democratic Alliance | DA | 167,972 | 16.24% | 2 | |
| Economic Freedom Fighters | EFF | 81,559 | 7.89% | 1 | |
| Freedom Front Plus | VF+ | 19,837 | 1.92% | 0 | |
| Congress of the People | COPE | 14,613 | 1.41% | 0 | |
| African Independent Congress | AIC | 7,972 | 0.77% | 0 | |
| African Christian Democratic Party | ACDP | 5,128 | 0.50% | 0 | |
| United Democratic Movement | UDM | 2,380 | 0.23% | 0 | |
| African People's Convention | APC | 2,093 | 0.20% | 0 | |
| Agang South Africa | AGANG SA | 2,058 | 0.20% | 0 | |
| Pan Africanist Congress of Azania | PAC | 1,989 | 0.19% | 0 | |
| Azanian People's Organisation | AZAPO | 1,405 | 0.14% | 0 | |
| Inkatha Freedom Party | IFP | 1,177 | 0.11% | 0 | |
| National Freedom Party | NFP | 1,039 | 0.10% | 0 | |
| United Christian Democratic Party | UCDP | 943 | 0.09% | 0 | |
| Patriotic Alliance | PA | 543 | 0.05% | 0 | |
| Workers and Socialist Party | WASP | 393 | 0.04% | 0 | |
| Front National | FN | 353 | 0.03% | 0 | |
| Ubuntu Party | UBUNTU | 231 | 0.02% | 0 | |
| Independent Civic Organisation of South Africa | ICOSA | 226 | 0.02% | 0 | |
| Al Jama-ah | 208 | 0.02% | 0 | ||
| Keep It Straight and Simple Party | KISS | 203 | 0.02% | 0 | |
| Pan Africanist Movement | PAM | 187 | 0.02% | 0 | |
| Minority Front | MF | 152 | 0.01% | 0 | |
| Bushbuckridge Residents Association | BRA | 131 | 0.01% | 0 | |
| First Nation Liberation Alliance | FINLA | 120 | 0.01% | 0 | |
| United Congress | UNICO | 120 | 0.01% | 0 | |
| Kingdom Governance Movement | KGM | 111 | 0.01% | 0 | |
| Peoples Alliance | PAL | 68 | 0.01% | 0 | |
| Valid Votes | 1,034,337 | 100.00% | 11 | ||
| Rejected Votes | 16,690 | 1.59% | |||
| Total Polled | 1,051,027 | 72.51% | |||
| Registered Electors | 1,449,488 | ||||
The following candidates were elected:[14] Nomsa Marchesi (DA), (ANC), (ANC), (EFF), (ANC), (ANC), (ANC), (DA), (ANC), Maggie Sotyu (ANC) and (ANC).
2009[]
Results of the 2009 general election held on 22 April 2009:[15][16][17]
| Party | Votes | % | Seats | ||
|---|---|---|---|---|---|
| African National Congress | ANC | 756,287 | 71.90% | 9 | |
| Democratic Alliance | DA | 127,259 | 12.10% | 2 | |
| Congress of the People | COPE | 116,852 | 11.11% | 1 | |
| Freedom Front Plus | VF+ | 16,929 | 1.61% | 0 | |
| African Christian Democratic Party | ACDP | 7,410 | 0.70% | 0 | |
| Azanian People's Organisation | AZAPO | 3,927 | 0.37% | 0 | |
| United Democratic Movement | UDM | 3,408 | 0.32% | 0 | |
| United Christian Democratic Party | UCDP | 3,095 | 0.29% | 0 | |
| African People's Convention | APC | 3,091 | 0.29% | 0 | |
| Pan Africanist Congress of Azania | PAC | 3,003 | 0.29% | 0 | |
| Inkatha Freedom Party | IFP | 2,260 | 0.21% | 0 | |
| Movement Democratic Party | MDP | 1,797 | 0.17% | 0 | |
| Independent Democrats | ID | 1,786 | 0.17% | 0 | |
| Great Kongress of South Africa | GKSA | 768 | 0.07% | 0 | |
| National Democratic Convention | NADECO | 633 | 0.06% | 0 | |
| Christian Democratic Alliance | CDA | 568 | 0.05% | 0 | |
| United Independent Front | UIF | 415 | 0.04% | 0 | |
| Alliance of Free Democrats | AFD | 353 | 0.03% | 0 | |
| Al Jama-ah | 323 | 0.03% | 0 | ||
| New Vision Party | NVP | 314 | 0.03% | 0 | |
| South African Democratic Congress | SADECO | 307 | 0.03% | 0 | |
| Pan Africanist Movement | PAM | 287 | 0.03% | 0 | |
| Women Forward | WF | 238 | 0.02% | 0 | |
| Keep It Straight and Simple Party | KISS | 197 | 0.02% | 0 | |
| A Party | 182 | 0.02% | 0 | ||
| Minority Front | MF | 169 | 0.02% | 0 | |
| Valid Votes | 1,051,858 | 100.00% | 12 | ||
| Rejected Votes | 17,269 | 1.62% | |||
| Total Polled | 1,069,127 | 76.99% | |||
| Registered Electors | 1,388,588 | ||||
The following candidates were elected:[18] Salam Abram (ANC), (ANC), (COPE), (ANC), (ANC), (ANC), Patricia Kopane (DA), (ANC), (ANC), (DA), Maggie Sotyu (ANC) and (ANC).
2004[]
Results of the 2004 general election held on 14 April 2004:[19][20][21]
| Party | Votes | % | Seats | ||
|---|---|---|---|---|---|
| African National Congress | ANC | 838,583 | 82.05% | 12 | |
| Democratic Alliance | DA | 90,609 | 8.87% | 1 | |
| Freedom Front Plus | VF+ | 21,107 | 2.07% | 0 | |
| African Christian Democratic Party | ACDP | 13,488 | 1.32% | 0 | |
| Pan Africanist Congress of Azania | PAC | 13,277 | 1.30% | 0 | |
| United Democratic Movement | UDM | 9,785 | 0.96% | 0 | |
| New National Party | NNP | 8,380 | 0.82% | 0 | |
| United Christian Democratic Party | UCDP | 6,730 | 0.66% | 0 | |
| Independent Democrats | ID | 6,259 | 0.61% | 0 | |
| Inkatha Freedom Party | IFP | 4,352 | 0.43% | 0 | |
| Azanian People's Organisation | AZAPO | 3,450 | 0.34% | 0 | |
| Socialist Party of Azania | SOPA | 1,129 | 0.11% | 0 | |
| National Action | NA | 1,071 | 0.10% | 0 | |
| Employment Movement for South Africa | EMSA | 732 | 0.07% | 0 | |
| United Front | UF | 685 | 0.07% | 0 | |
| Christian Democratic Party | CDP | 665 | 0.07% | 0 | |
| Peace and Justice Congress | PJC | 568 | 0.06% | 0 | |
| The Organisation Party | TOP | 458 | 0.04% | 0 | |
| Keep It Straight and Simple Party | KISS | 294 | 0.03% | 0 | |
| New Labour Party | 240 | 0.02% | 0 | ||
| Minority Front | MF | 182 | 0.02% | 0 | |
| Valid Votes | 1,022,044 | 100.00% | 13 | ||
| Rejected Votes | 20,076 | 1.93% | |||
| Total Polled | 1,042,120 | 78.88% | |||
| Registered Electors | 1,321,195 | ||||
The following candidates were elected:[22] Salam Abram (ANC), (DA), (ANC), (ANC), (ANC), (ANC), (ANC), (ANC), (ANC), (ANC), Sisi Ntombela (ANC), (ANC) and Maggie Sotyu (ANC).
1999[]
Results of the 1999 general election held on 2 June 1999:[23][24]
| Party | Votes | % | Seats | ||
|---|---|---|---|---|---|
| African National Congress | ANC | 887,091 | 81.03% | 12 | |
| Democratic Party | DP | 64,262 | 5.87% | 1 | |
| New National Party | NNP | 54,769 | 5.00% | 1 | |
| Freedom Front | VFFF | 19,210 | 1.75% | 0 | |
| United Democratic Movement | UDM | 18,073 | 1.65% | 0 | |
| Pan Africanist Congress of Azania | PAC | 11,300 | 1.03% | 0 | |
| African Christian Democratic Party | ACDP | 10,031 | 0.92% | 0 | |
| Federal Alliance | FA | 9,041 | 0.83% | 0 | |
| United Christian Democratic Party | UCDP | 8,019 | 0.73% | 0 | |
| Inkatha Freedom Party | IFP | 4,938 | 0.45% | 0 | |
| Afrikaner Eenheidsbeweging | AEB | 4,228 | 0.39% | 0 | |
| Azanian People's Organisation | AZAPO | 1,919 | 0.18% | 0 | |
| Socialist Party of Azania | SOPA | 838 | 0.08% | 0 | |
| Abolition of Income Tax and Usury Party | AITUP | 421 | 0.04% | 0 | |
| Minority Front | MF | 351 | 0.03% | 0 | |
| Government by the People Green Party | GPGP | 285 | 0.03% | 0 | |
| Valid Votes | 1,094,776 | 100.00% | 14 | ||
| Rejected Votes | 20,550 | 1.84% | |||
| Total Polled | 1,115,326 | 90.99% | |||
| Registered Electors | 1,225,730 | ||||
1994[]
Results of the 1994 general election held on between 26 and 29 April 1994:[25][26][27]
| Party | Votes | % | Seats | ||
|---|---|---|---|---|---|
| African National Congress | ANC | 1,059,313 | 77.42% | ||
| National Party | NP | 198,780 | 14.53% | ||
| Freedom Front | VV-FF | 50,386 | 3.68% | ||
| Pan Africanist Congress of Azania | PAC | 23,310 | 1.70% | ||
| Dikwankwetla Party of South Africa | DPSA | 8,796 | 0.64% | ||
| Inkatha Freedom Party | IFP | 8,446 | 0.62% | ||
| Democratic Party | DP | 7,365 | 0.54% | ||
| African Christian Democratic Party | ACDP | 4,523 | 0.33% | ||
| African Moderates Congress Party | AMCP | 2,644 | 0.19% | ||
| Sport Organisation for Collective Contributions and Equal Rights | SOCCER | 857 | 0.06% | ||
| Ximoko Progressive Party | XPP | 683 | 0.05% | ||
| African Democratic Movement | ADM | 553 | 0.04% | ||
| Federal Party | FP | 519 | 0.04% | ||
| Minority Front | MF | 490 | 0.04% | ||
| Keep It Straight and Simple Party | KISS | 403 | 0.03% | ||
| Women's Rights Peace Party | WRPP | 398 | 0.03% | ||
| Africa Muslim Party | AMP | 324 | 0.02% | ||
| Workers' List Party | WLP | 258 | 0.02% | ||
| Luso-South African Party | LUSAP | 203 | 0.01% | ||
| Valid Votes | 1,368,251 | 100.00% | |||
| Rejected Votes | 14,748 | 1.07% | |||
| Total Polled | 1,382,999 | 84.51% | |||
| Registered Electors | 1,636,581 | ||||
References[]
- ^ Statistical Release P0302 - Mid-year population estimates, 2020 (PDF). Pretoria, South Africa: Statistics South Africa. July 2020. p. 23. Retrieved 5 April 2021.
- ^ "Our People: Members of Parliament - All Members". Cape Town, South Africa: Parliament of South Africa. Retrieved 5 April 2021.
- ^ "Election for South African National Assembly". Election Guide. Arlington, U.S.A.: International Foundation for Electoral Systems. Retrieved 5 April 2021.
- ^ Mukherjee, Bumba (2016). Democracy and Trade Policy in Developing Countries. Chicago, U.S.A.: University of Chicago Press. p. 207. ISBN 978-0-226-35881-9. Retrieved 5 April 2021.
- ^ Louw, Wim (20 March 2014). "The South African Electoral System". HSF Briefs. Johannesburg, South Africa: Helen Suzman Foundation. Retrieved 5 April 2021.
- ^ Nohlen, Dieter; Krennerich, Michael; Thibaut, Bernard, eds. (1999). Elections in Africa: A Data Handbook. Oxford, U.K.: Oxford University Press. p. 40. ISBN 0-19-829645-2.
- ^ "Results Dashboard: Eastern Cape - National Assembly - 2019". Centurion, South Africa: Electoral Commission of South Africa. Retrieved 18 April 2021.
- ^ "2019 National Election: Detailed Results - All Provinces" (PDF). Centurion, South Africa: Electoral Commission of South Africa. Retrieved 25 March 2021.
- ^ "2019 National Election: Seat Calculation - Vote and Seat Summary" (PDF). Centurion, South Africa: Electoral Commission of South Africa. Retrieved 25 March 2021.
- ^ "General Notices: Electoral Commission – Notice 267 of 2019 - Electoral Act, 1998 (Act 73 of 1998) - Publication of Lists of Representatives in the National Assembly and Provincial Legislatures in Terms of Item 16 (4) of Schedule 1A of the Electoral Act, 1998, in Respect of the Elections Held on 08 May 2019" (PDF). Government Gazette of South Africa. Vol. 647 no. 42460. Pretoria, South Africa: Government of South Africa. 15 May 2019. pp. 5–15. ISSN 1682-5845. Retrieved 5 April 2021.
- ^ "Results Dashboard: Eastern Cape - National Assembly - 2014". Centurion, South Africa: Electoral Commission of South Africa. Retrieved 18 April 2021.
- ^ "2014 National Election: Detailed Results - All Provinces" (PDF). Centurion, South Africa: Electoral Commission of South Africa. Retrieved 25 March 2021.
- ^ "2014 National Election: Seat Calculation - Seats Reports" (PDF). Centurion, South Africa: Electoral Commission of South Africa. Retrieved 25 March 2021.
- ^ "General Notice: Notice 358 of 2014 - Electoral Commission – Electoral Act, 1998 (Act 73 of 1998) - Publication of Lists of Representatives in the National Assembly and Provincial Legislatures in Terms of Item 16 (4) of Schedule 1A of the Electoral Act, 1998, in Respect of the Elections Held on 07 May 2014" (PDF). Government Gazette of South Africa. Vol. 587 no. 37641. Pretoria, South Africa: Government of South Africa. 14 May 2014. pp. 4–16. Retrieved 8 April 2021.
- ^ "Results Dashboard: Eastern Cape - National Assembly - 2009". Centurion, South Africa: Electoral Commission of South Africa. Retrieved 18 April 2021.
- ^ "22 Apr 2009 National Election: Detailed Results - All Provinces" (PDF). Centurion, South Africa: Electoral Commission of South Africa. Retrieved 25 March 2021.
- ^ "22 Apr 2009 National Election: Seat Calculation - Seats Reports" (PDF). Centurion, South Africa: Electoral Commission of South Africa. Retrieved 25 March 2021.
- ^ "General Notice: Notice 408 of 2009 - Electoral Commission – List of Names of Representatives in the National Assembly and the Nine Provincial Legislatures in Respect of the Elections Held on 22 April 2009" (PDF). Government Gazette of South Africa. Vol. 526 no. 32184. Pretoria, South Africa: Government of South Africa. 28 April 2009. pp. 4–50. Retrieved 8 April 2021.
- ^ "Results Dashboard: Eastern Cape - National Assembly - 2004". Centurion, South Africa: Electoral Commission of South Africa. Retrieved 18 April 2021.
- ^ "14 Apr 2004 National Election: Detailed Results - All Provinces" (PDF). Centurion, South Africa: Electoral Commission of South Africa. Retrieved 25 March 2021.
- ^ "14 Apr 2004 National Election: Seat Calculation - Seats Reports" (PDF). Centurion, South Africa: Electoral Commission of South Africa. Retrieved 25 March 2021.
- ^ "General Notice: Notice 717 of 2004 - Electoral Commission – List of Names of Representatives in the National Assembly and the Nine Provincial Legislatures in Respect of the Elections Held on 14 April 2004" (PDF). Government Gazette of South Africa. Vol. 466 no. 2677. Pretoria, South Africa: Government of South Africa. 20 April 2004. pp. 4–95. Retrieved 26 March 2021.
- ^ "Results Dashboard: Eastern Cape - National Assembly - 1999". Centurion, South Africa: Electoral Commission of South Africa. Retrieved 18 April 2021.
- ^ "National Elections 1999: Detailed Results - All Provinces" (PDF). Centurion, South Africa: Electoral Commission of South Africa. Retrieved 25 March 2021.
- ^ "27 Apr 1994 National Election: 1994 Elections Results - 1994 National and Provincial Elections" (PDF). Centurion, South Africa: Electoral Commission of South Africa. p. 1. Retrieved 11 July 2020.
- ^ "April 26-29, 1994 General Election Results - Eastern Cape: National Assembly". Election Resources on the Internet. Retrieved 8 April 2021.
- ^ Jones, Bob (1 January 2004). Reitzes, Maxine (ed.). "Focus on South Africa's 2004 national and provincial election results: Tables of election results" (PDF). Election Synopsis. Centre for Policy Studies. 1 (4): 30. Retrieved 8 April 2021.
- Free State (province)
- National Assembly of South Africa constituencies
- National Assembly of South Africa constituencies established in 1994