Generalised logistic function
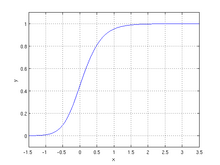


The generalized logistic function or curve, also known as Richards' curve, originally developed for growth modelling, is an extension of the logistic or sigmoid functions, allowing for more flexible S-shaped curves:

where = weight, height, size etc., and = time.


It has five parameters:
- : the lower (left) asymptote;
- : the upper (right) asymptote when . If and then is called the carrying capacity;
- : the growth rate;
- : affects near which asymptote maximum growth occurs.
- : is related to the value
- : typically takes a value of 1. Otherwise, the upper asymptote is


The equation can also be written:

where can be thought of as a starting time, (at which )


Including both and can be convenient:

this representation simplifies the setting of both a starting time and the value of Y at that time.
The general model is sometimes named a "Richards' curve" after F. J. Richards, who proposed the general form for the family of models in 1959.
The logistic, with maximum growth rate at time , is the case where .

Generalised logistic differential equation[]
A particular case of the generalised logistic function is:

which is the solution of the Richards' differential equation (RDE):

with initial condition

where

provided that ν > 0 and α > 0.
The classical logistic differential equation is a particular case of the above equation, with ν =1, whereas the Gompertz curve can be recovered in the limit provided that:


In fact, for small ν it is

The RDE models many growth phenomena, arising in fields such as oncology and epidemiology.
Gradient of generalized logistic function[]
When estimating parameters from data, it is often necessary to compute the partial derivatives of the logistic function with respect to parameters at a given data point (see [1]). For the case where ,

Modeling COVID-19 infection trajectory[]

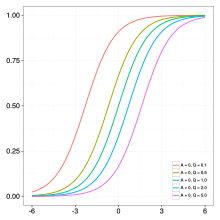
A generalized logistic function, also called the Richards growth curve, is widely used in modelling COVID-19 infection trajectories.[2] Infection trajectory is a daily time series data for the cumulative number of infected cases for a subject such as country, city, state, etc. There are variant re-parameterizations in the literature: one of frequently used forms is
![{\displaystyle f(t;\theta _{1},\theta _{2},\theta _{3},\xi )={\frac {\theta _{1}}{[1+\xi \exp(-\theta _{2}\cdot (t-\theta _{3}))]^{1/\xi }}}}](https://wikimedia.org/api/rest_v1/media/math/render/svg/29479f9d2bb480d1bf104fc0d84fcbaf00cf99f6)
where are real numbers, and is a positive real number. The flexibility of the curve is due to the parameter : (i) if then the curve reduces to the logistic function, and (ii) if converges to zero, then the curve converges to the Gompertz function. In epidemiological modeling, , , and represent the final epidemic size, infection rate, and lag phase, respectively. See the right panel for an examplary infection trajectory when are designated by .


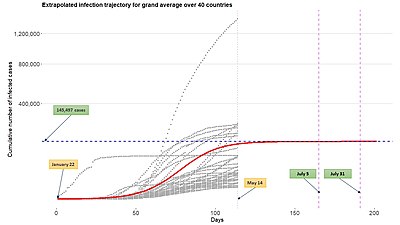
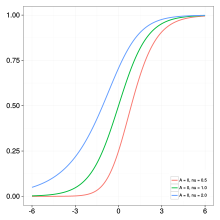
One of the benefits of using growth function such as generalized logistic function in epidemiological modeling is its relatively easy expansion to the multilevel model framework by using the growth function to describe infection trajectories from multiple subjects (countries, cities, states, etc). See the above figure. Such a modeling framework can be also widely called the nonlinear mixed-effects model or hierarchical nonlinear model.
Special cases[]
The following functions are specific cases of Richards' curves:
- Logistic function
- Gompertz curve
- Von Bertalanffy function
- Monomolecular curve
Footnotes[]
- ^ Fekedulegn, Desta; Mairitin P. Mac Siurtain; Jim J. Colbert (1999). "Parameter Estimation of Nonlinear Growth Models in Forestry" (PDF). Silva Fennica. 33 (4): 327–336. doi:10.14214/sf.653. Archived from the original (PDF) on 2011-09-29. Retrieved 2011-05-31.
- ^ Lee, Se Yoon; Lei, Bowen; Mallick, Bani (2020). "Estimation of COVID-19 spread curves integrating global data and borrowing information". PLOS ONE. 15 (7): e0236860. arXiv:2005.00662. Bibcode:2020PLoSO..1536860L. doi:10.1371/journal.pone.0236860. PMC 7390340. PMID 32726361.
References[]
- Richards, F. J. (1959). "A Flexible Growth Function for Empirical Use". Journal of Experimental Botany. 10 (2): 290–300. doi:10.1093/jxb/10.2.290.
- Pella, J. S.; Tomlinson, P. K. (1969). "A Generalised Stock-Production Model". Bull. Inter-Am. Trop. Tuna Comm. 13: 421–496.
- Lei, Y. C.; Zhang, S. Y. (2004). "Features and Partial Derivatives of Bertalanffy–Richards Growth Model in Forestry". Nonlinear Analysis: Modelling and Control. 9 (1): 65–73. doi:10.15388/NA.2004.9.1.15171.
- Growth curves
- Mathematical modeling