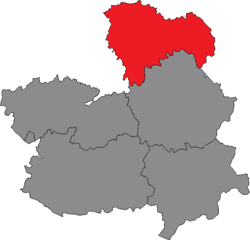
Guadalajara is one of the five constituencies (Spanish : circunscripciones ) represented in the Cortes of Castilla–La Mancha , the regional legislature of the autonomous community of Castilla–La Mancha . The constituency currently elects five deputies . Its boundaries correspond to those of the Spanish province of Guadalajara . The electoral system uses the D'Hondt method and a closed-list proportional representation , with a minimum threshold of three percent.
Electoral system [ ] The constituency was created as per the Statute of Autonomy of Castilla–La Mancha of 1982 and was first contested in the 1983 regional election . The Statute provided for the five provinces in Castilla–La Mancha —Albacete , Ciudad Real , Cuenca , Guadalajara and Toledo —to be established as multi-member districts in the Cortes of Castilla–La Mancha , with this regulation being maintained under the 1986 regional electoral law. Each constituency is entitled to an initial minimum of three seats, with the remaining 18—22 from 1986 to 1998—being distributed in proportion to their populations. In 1983 and from 1998 to 2014, each constituency was allocated a fixed number of seats: 9 for Albacete (10 from 1998 to 2014), 10 for Ciudad Real (11 from 1998 to 2012; 12 until 2014), 8 for Cuenca (8 from 2012 to 2014), 7 for Guadalajara (8 from 2007 to 2012; 9 until 2014) and 10 for Toledo (11 from 1998 to 2007; 12 from 2007 to 2012; 13 until 2014).[2] [3]
Voting is on the basis of universal suffrage , which comprises all nationals over eighteen, registered in Castilla–La Mancha and in full enjoyment of their political rights. Amendments to the electoral law in 2011 required for Castilian-Manchegan people abroad to apply for voting before being permitted to vote, a system known as "begged" or expat vote (Spanish : Voto rogado ).[4] D'Hondt method and a closed list proportional representation , with an electoral threshold of three percent of valid votes—which includes blank ballots—being applied in each constituency. The only exception was in 1983, when a five percent threshold was applied regionally .[2] [3] district magnitude .[5]
The electoral law allows for parties and federations registered in the interior ministry , coalitions and groupings of electors to present lists of candidates. Parties and federations intending to form a coalition ahead of an election are required to inform the relevant Electoral Commission within ten days of the election call—fifteen before 1985—whereas groupings of electors need to secure the signature of at least one percent of the electorate in the constituencies for which they seek election—one-thousandth of the electorate, with a compulsory minimum of 500 signatures, until 1985—disallowing electors from signing for more than one list of candidates.[3] [6] [7]
Deputies [ ] Elections [ ] 2019 regional election [ ]
Summary of the 26 May 2019 Cortes of Castilla–La Mancha election results in Guadalajara
Parties and coalitions
Popular vote
Seats
Votes
%
±pp
Total
+/−
Spanish Socialist Workers' Party (PSOE)
49,932
39.56
+9.55
3 +1
People's Party (PP)
30,704
24.33
–9.40
1 –1
Citizens–Party of the Citizenry (Cs)
18,220
14.44
+2.42
1 +1
Vox (Vox)
12,024
9.53
+8.56
0
±0
United We Can–United Left–Equo CLM (Podemos –IU –Equo )1
11,808
9.36
–8.62
0
–1
Animalist Party Against Mistreatment of Animals (PACMA)
1,628
1.29
+0.16
0
±0
Castilian Party –Commoners' Land (PCAS–TC)
704
0.56
+0.29
0
±0
Traditions and Rural World (ANATUR–UDEC)
307
0.24
New
0
±0
Blank ballots
892
0.71
–1.12
Total
126,219
5
±0
Valid votes
126,219
99.13
+0.89
Invalid votes
1,102
0.87
–0.89
Votes cast / turnout
127,321
68.24
–1.01
Abstentions
59,250
31.76
+1.01
Registered voters
186,571
Sources[8]
2015 regional election [ ]
Summary of the 24 May 2015 Cortes of Castilla–La Mancha election results in Guadalajara
Parties and coalitions
Popular vote
Seats
Votes
%
±pp
Total
+/−
People's Party (PP)
41,889
33.73
–16.10
2 –3
Spanish Socialist Workers' Party (PSOE)
37,269
30.01
–8.01
2 –1
We Can (Podemos)
18,171
14.63
New
1 +1
Citizens–Party of the Citizenry (C's)
14,923
12.02
New
0
±0
Let's Win Castilla–La Mancha –The Greens –United Left (Ganemos–LV–IU)1
4,163
3.35
–1.36
0
±0
Union, Progress and Democracy (UPyD)
2,056
1.66
–1.34
0
±0
Animalist Party Against Mistreatment of Animals (PACMA)
1,406
1.13
+0.53
0
±0
Vox (Vox)
1,209
0.97
New
0
±0
Union of Independent Citizens (UCIN)
478
0.38
New
0
±0
Castilian Party –Castilian Unity (PCAS–UdCa)2
341
0.27
–0.17
0
±0
Blank ballots
2,277
1.83
–0.28
Total
124,182
5
–3
Valid votes
124,182
98.24
–0.21
Invalid votes
2,224
1.76
+0.21
Votes cast / turnout
126,406
69.25
–4.11
Abstentions
56,136
30.75
+4.11
Registered voters
182,542
Sources[9] [10]
2011 regional election [ ]
Summary of the 22 May 2011 Cortes of Castilla–La Mancha election results in Guadalajara
Parties and coalitions
Popular vote
Seats
Votes
%
±pp
Total
+/−
People's Party (PP)
64,232
49.83
+3.28
5 +1
Spanish Socialist Workers' Party (PSOE)
49,011
38.02
–7.80
3 ±0
United Left of Castilla–La Mancha (IUCLM)
6,076
4.71
+0.17
0
±0
Union, Progress and Democracy (UPyD)
3,862
3.00
New
0
±0
Ecolo–Greens Guadalajara (Ecolo–V)
1,673
1.30
New
0
±0
Anti-Bullfighting Party Against Mistreatment of Animals (PACMA)
777
0.60
New
0
±0
Castilian Party (PCAS)1
567
0.44
–0.02
0
±0
Blank ballots
2,717
2.11
+0.43
Total
128,915
8
+1
Valid votes
128,915
98.45
–0.80
Invalid votes
2,034
1.55
+0.80
Votes cast / turnout
130,949
73.36
+3.27
Abstentions
47,562
26.64
–3.27
Registered voters
178,511
Sources[11] [12]
2007 regional election [ ] 2003 regional election [ ] 1999 regional election [ ] 1995 regional election [ ] 1991 regional election [ ]
Summary of the 26 May 1991 Cortes of Castilla–La Mancha election results in Guadalajara
Parties and coalitions
Popular vote
Seats
Votes
%
±pp
Total
+/−
People's Party (PP)1
37,253
44.48
–0.20
4 +1
Spanish Socialist Workers' Party (PSOE)
34,273
40.92
+3.12
3 ±0
United Left (IU)
6,670
7.96
+2.87
0
±0
Democratic and Social Centre (CDS)
2,336
2.79
–7.69
0
–1
The Greens Ecologist –Humanist List (LVLE–H)2
1,113
1.33
+0.72
0
±0
Regionalist Party of Guadalajara (PRGU)
769
0.92
New
0
±0
Social Democratic Party of Castilla–La Mancha (PSDCLM)
143
0.17
New
0
±0
Blank ballots
1,198
1.43
+0.09
Total
83,755
7
±0
Valid votes
83,755
99.04
+0.51
Invalid votes
812
0.96
–0.51
Votes cast / turnout
84,567
72.22
–4.85
Abstentions
32,527
27.78
+4.85
Registered voters
117,094
Sources[21] [22] [23]
1987 regional election [ ]
Summary of the 10 June 1987 Cortes of Castilla–La Mancha election results in Guadalajara
Parties and coalitions
Popular vote
Seats
Votes
%
±pp
Total
+/−
People's Alliance (AP)1
35,900
41.69
–4.47
3 –1
Spanish Socialist Workers' Party (PSOE)
32,549
37.80
–1.88
3 ±0
Democratic and Social Centre (CDS)
9,021
10.48
+6.21
1 +1
United Left (IU)2
4,382
5.09
–2.05
0
±0
People's Democratic Party (PDP)
2,571
2.99
New
0
±0
Humanist Platform (PH)
526
0.61
New
0
±0
Blank ballots
1,154
1.34
+0.48
Total
86,103
7
±0
Valid votes
86,103
98.53
+0.08
Invalid votes
1,281
1.47
–0.08
Votes cast / turnout
87,384
77.07
+2.59
Abstentions
25,997
22.93
–2.59
Registered voters
113,381
Sources[24] [25] [26]
1983 regional election [ ]
Summary of the 8 May 1983 Cortes of Castilla–La Mancha election results in Guadalajara
Parties and coalitions
Popular vote
Seats
Votes
%
±pp
Total
+/−
People's Coalition (AP –PDP –UL )
37,342
46.16
n/a 4 n/a
Spanish Socialist Workers' Party (PSOE)
32,099
39.68
n/a
3 n/a
Communist Party of Spain (PCE)
5,775
7.14
n/a
0
n/a
Democratic and Social Centre (CDS)
3,454
4.27
n/a
0
n/a
Liberal Democratic Party (PDL)
1,541
1.90
n/a
0
n/a
Blank ballots
692
0.86
n/a
Total
80,903
7
n/a
Valid votes
80,903
98.45
n/a
Invalid votes
1,271
1.55
n/a
Votes cast / turnout
82,174
74.48
n/a
Abstentions
28,151
25.52
n/a
Registered voters
110,325
Sources[27] [28] [29]
References [ ]
^ "Cifras oficiales de población resultantes de la revisión del Padrón municipal a 1 de enero. Población por provincias y por sexo" . ine.es (in Spanish). National Institute of Statistics . Retrieved 8 February 2020 .^ Jump up to: a b "Ley Orgánica 9/1982, de 10 de agosto, de Estatuto de Autonomía de Castilla-La Mancha". Organic Law No. 9 of 10 August 1982 Boletín Oficial del Estado . Retrieved 15 September 2017 . ^ Jump up to: a b c "Ley 5/1986, de 23 de diciembre, electoral de Castilla-La Mancha". Law No. 5 of 23 December 1986 Boletín Oficial del Estado (in Spanish). Retrieved 15 September 2017 . ^ Reig Pellicer, Naiara (16 December 2015). "Spanish elections: Begging for the right to vote" . cafebabel.co.uk . Retrieved 17 July 2017 . ^ Gallagher, Michael (30 July 2012). "Effective threshold in electoral systems" . Trinity College, Dublin. Archived from the original on 30 July 2017. Retrieved 22 July 2017 . ^ "Real Decreto-ley 20/1977, de 18 de marzo, sobre Normas Electorales". Royal Decree-Law No. 20 of 18 March 1977 Boletín Oficial del Estado (in Spanish). Retrieved 14 December 2019 . ^ "Ley Orgánica 5/1985, de 19 de junio, del Régimen Electoral General". Organic Law No. 5 of 19 June 1985 Boletín Oficial del Estado (in Spanish). Retrieved 30 January 2020 . ^ "Cortes of Castile-La Mancha election results, 26 May 2019" (PDF) . www.juntaelectoralcentral.es (in Spanish). Electoral Commission of Castilla–La Mancha. 14 June 2019. Retrieved 29 November 2019 .^ "Cortes of Castilla–La Mancha election results, 24 May 2015" (PDF) . www.juntaelectoralcentral.es (in Spanish). Electoral Commission of Castilla–La Mancha. 15 June 2015. Retrieved 29 September 2017 .^ "IX Legislature. Regional election, 24 May 2015" . www.cortesclm.es (in Spanish). Cortes of Castilla–La Mancha. Retrieved 29 September 2017 .^ "Cortes of Castilla–La Mancha election results, 22 May 2011" (PDF) . www.juntaelectoralcentral.es (in Spanish). Electoral Commission of Castilla–La Mancha. 13 June 2011. Retrieved 29 September 2017 .^ "VIII Legislature. Regional election, 22 May 2011" . www.cortesclm.es (in Spanish). Cortes of Castilla–La Mancha. Retrieved 29 September 2017 .^ "Cortes of Castilla–La Mancha election results, 27 May 2007" (PDF) . www.juntaelectoralcentral.es (in Spanish). Electoral Commission of Castilla–La Mancha. 14 June 2007. Retrieved 29 September 2017 .^ "VII Legislature. Regional election, 27 May 2007" . www.cortesclm.es (in Spanish). Cortes of Castilla–La Mancha. Retrieved 29 September 2017 .^ "Cortes of Castilla–La Mancha election results, 25 May 2003" (PDF) . www.juntaelectoralcentral.es (in Spanish). Electoral Commission of Castilla–La Mancha. 13 June 2003. Retrieved 29 September 2017 .^ "VI Legislature. Regional election, 25 May 2003" . www.cortesclm.es (in Spanish). Cortes of Castilla–La Mancha. Retrieved 29 September 2017 .^ "Cortes of Castilla–La Mancha election results, 13 June 1999" (PDF) . www.juntaelectoralcentral.es (in Spanish). Electoral Commission of Castilla–La Mancha. 2 July 1999. Retrieved 29 September 2017 .^ "V Legislature. Regional election, 13 June 1999" . www.cortesclm.es (in Spanish). Cortes of Castilla–La Mancha. Retrieved 29 September 2017 .^ "Cortes of Castilla–La Mancha election results, 28 May 1995" (PDF) . www.juntaelectoralcentral.es (in Spanish). Electoral Commission of Castilla–La Mancha. 16 June 1995. Retrieved 29 September 2017 .^ "IV Legislature. Regional election, 28 May 1995" . www.cortesclm.es (in Spanish). Cortes of Castilla–La Mancha. Retrieved 29 September 2017 .^ "Cortes of Castilla–La Mancha election results, 26 May 1991" (PDF) . www.juntaelectoralcentral.es (in Spanish). Electoral Commission of Castilla–La Mancha. 14 June 1991. Retrieved 29 September 2017 .^ "III Legislature. Regional election, 26 May 1991" . www.cortesclm.es (in Spanish). Cortes of Castilla–La Mancha. Retrieved 29 September 2017 .^ "Number 157. Report-declaration of the Cortes of Castilla–La Mancha election of 26 May 1991" (PDF) . tcu.es (in Spanish). Court of Auditors. Retrieved 8 December 2019 .^ "Cortes of Castilla–La Mancha election results, 10 June 1987" (PDF) . www.juntaelectoralcentral.es (in Spanish). Electoral Commission of Castilla–La Mancha. 30 June 1987. Retrieved 29 September 2017 .^ "II Legislature. Regional election, 10 June 1987" . www.cortesclm.es (in Spanish). Cortes of Castilla–La Mancha. Retrieved 29 September 2017 .^ "Number 75. Audit report on the regularity of electoral accounting derived from the elections held on June 10, 1987" (PDF) . tcu.es (in Spanish). Court of Auditors. Retrieved 8 December 2019 .^ "Cortes of Castilla–La Mancha election, 1983. Guadalajara" . www.datoselecciones.com (in Spanish). Election Data. Retrieved 29 September 2017 .^ "Cortes of Castilla–La Mancha election results, 8 May 1983" . www.juntaelectoralcentral.es (in Spanish). Electoral Commission of Castilla–La Mancha. 28 October 1983. Retrieved 29 September 2017 .^ "I Legislature. Regional election, 8 May 1983" . www.cortesclm.es (in Spanish). Cortes of Castilla–La Mancha. Retrieved 29 September 2017 .
Authority control
Coordinates : 40°50′N 2°30′W / 40.833°N 2.500°W / 40.833; -2.500