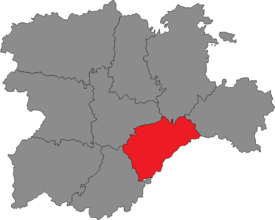
Segovia is one of the nine constituencies (Spanish : circunscripciones ) represented in the Cortes of Castile and León , the regional legislature of the Autonomous Community of Castile and León . The constituency currently elects seven deputies . Its boundaries correspond to those of the Spanish province of Segovia . The electoral system uses the D'Hondt method and a closed-list proportional representation , with a minimum threshold of three percent.
Electoral system [ ] The constituency was created as per the Statute of Autonomy of Castile and León of 1983 and was first contested in the 1983 regional election . The Statute provided for the nine provinces in Castile and León —Ávila , Burgos , León , Palencia , Salamanca , Segovia , Soria , Valladolid and Zamora —to be established as multi-member districts in the Cortes of Castile and León , with this regulation being maintained under the 1987 regional electoral law. Each constituency is entitled to an initial minimum of three seats, with one additional member per each 45,000 inhabitants or fraction greater than 22,500.[2] [3] [4]
Voting is on the basis of universal suffrage , which comprises all nationals over eighteen, registered in Castile and León and in full enjoyment of their political rights. Amendments to the electoral law in 2011 required for Castilian-Leonese people abroad to apply for voting before being permitted to vote, a system known as "begged" or expat vote (Spanish : Voto rogado ).[5] D'Hondt method and a closed list proportional representation , with an electoral threshold of three percent of valid votes—which includes blank ballots—being applied in each constituency.[2] [3] [4] district magnitude .[6]
The electoral law allows for parties and federations registered in the interior ministry , coalitions and groupings of electors to present lists of candidates. Parties and federations intending to form a coalition ahead of an election are required to inform the relevant Electoral Commission within ten days of the election call—fifteen before 1985—whereas groupings of electors need to secure the signature of at least one percent of the electorate in the constituencies for which they seek election—one-thousandth of the electorate, with a compulsory minimum of 500 signatures, until 1985—disallowing electors from signing for more than one list of candidates.[4] [7] [8]
Procurators [ ] Elections [ ] 2022 regional election [ ]
Summary of the 13 February 2022 Cortes of Castile and León election results in Segovia
Parties and coalitions
Popular vote
Seats
Votes
%
±pp
Total
+/−
People's Party (PP)
25,779
34.69
+1.18
3 +1
Spanish Socialist Workers' Party (PSOE)
23,362
31.43
–2.36
2 –1
Vox (Vox)
14,456
19.45
+13.88
1 +1
United We Can Castile and León (Podemos –IU –AV )1
4,479
6.03
–1.62
0
±0
Citizens–Party of the Citizenry (Cs)
3,616
4.87
–11.49
0
–1
Castilian Party –Commoners' Land –Zero Cuts (PCAS–TC–RC)
628
0.84
New
0
±0
Animalist Party Against Mistreatment of Animals (PACMA)
517
0.70
+0.01
0
±0
Centered (centrados)
511
0.69
–0.38
0
±0
Blank ballots
974
1.31
+0.23
Total
74,322
6
±0
Valid votes
74,322
98.27
–0.51
Invalid votes
1,309
1.73
+0.51
Votes cast / turnout
75,631
63.15
–9.55
Abstentions
44,131
36.85
+9.55
Registered voters
119,762
Sources[9]
2019 regional election [ ]
Summary of the 26 May 2019 Cortes of Castile and León election results in Segovia
Parties and coalitions
Popular vote
Seats
Votes
%
±pp
Total
+/−
Spanish Socialist Workers' Party (PSOE)
29,056
33.79
+6.31
3 +1
People's Party (PP)
28,822
33.51
–6.50
2 –2
Citizens–Party of the Citizenry (Cs)
14,068
16.36
+7.29
1 +1
Vox (Vox)
4,790
5.57
+4.85
0
±0
We Can –Equo (Podemos–Equo)
4,564
5.31
–5.95
0
–1
United Left –Anticapitalists (IU –Anticapitalistas –PCAS /TC –ALTER )1
2,011
2.34
–1.96
0
±0
Centered (centrados)
920
1.07
New
0
±0
Animalist Party Against Mistreatment of Animals (PACMA)
596
0.69
–0.07
0
±0
For a Fairer World (PUM+J)
148
0.17
New
0
±0
Spanish Phalanx of the CNSO (FE–JONS)
94
0.11
–0.23
0
±0
Blank ballots
929
1.08
–1.29
Total
85,998
6
–1
Valid votes
85,998
98.78
+1.30
Invalid votes
1,060
1.22
–1.30
Votes cast / turnout
87,058
72.70
+1.99
Abstentions
32,699
27.30
–1.99
Registered voters
119,757
Sources[10]
2015 regional election [ ]
Summary of the 24 May 2015 Cortes of Castile and León election results in Segovia
Parties and coalitions
Popular vote
Seats
Votes
%
±pp
Total
+/−
People's Party (PP)
33,632
40.01
–14.25
4 –1
Spanish Socialist Workers' Party (PSOE)
23,097
27.48
–4.07
2 ±0
We Can (Podemos)
9,467
11.26
New
1 +1
Citizens–Party of the Citizenry (C's)
7,626
9.07
New
0
±0
United Left –Equo: Convergence for Castile and León (IU–Equo)
3,005
3.58
–0.75
0
±0
Union, Progress and Democracy (UPyD)
2,220
2.64
–1.09
0
±0
Spanish Democratic Segovian Party (PSeDE)
874
1.04
New
0
±0
Animalist Party Against Mistreatment of Animals (PACMA)
637
0.76
+0.25
0
±0
Castilian Party –Commoners' Land: Pact (PCAS–TC–Pacto)
606
0.72
New
0
±0
Vox (Vox)
606
0.72
New
0
±0
Spanish Phalanx of the CNSO (FE–JONS)
288
0.34
New
0
±0
Blank ballots
1,995
2.37
–0.68
Total
84,053
7
±0
Valid votes
84,053
97.48
–0.38
Invalid votes
2,177
2.52
+0.38
Votes cast / turnout
86,230
70.71
–3.84
Abstentions
35,725
29.29
+3.84
Registered voters
121,955
Sources[11] [12]
2011 regional election [ ]
Summary of the 22 May 2011 Cortes of Castile and León election results in Segovia
Parties and coalitions
Popular vote
Seats
Votes
%
±pp
Total
+/−
People's Party (PP)
48,886
54.26
+1.32
5 +1
Spanish Socialist Workers' Party (PSOE)
28,425
31.55
–5.93
2 ±0
United Left of Castile and León (IUCyL)
3,899
4.33
+1.21
0
±0
Union, Progress and Democracy (UPyD)
3,361
3.73
New
0
±0
Greens and Castilians (LV –PCAL )1
1,553
1.72
–0.97
0
±0
Left Segovia (SdI)
760
0.84
New
0
±0
Anti-Bullfighting Party Against Mistreatment of Animals (PACMA)
463
0.51
New
0
±0
Blank ballots
2,752
3.05
+0.94
Total
90,099
7
+1
Valid votes
90,099
97.86
–1.09
Invalid votes
1,971
2.14
+1.09
Votes cast / turnout
92,070
74.55
–1.46
Abstentions
31,436
25.45
+1.46
Registered voters
123,506
Sources[11] [13]
2007 regional election [ ]
Summary of the 27 May 2007 Cortes of Castile and León election results in Segovia
Parties and coalitions
Popular vote
Seats
Votes
%
±pp
Total
+/−
People's Party (PP)
49,525
52.94
+2.17
4 ±0
Spanish Socialist Workers' Party (PSOE)
35,067
37.48
+1.07
2 ±0
United Left–The Greens–Commitment for Castile and León (IU–LV–CyL)
2,923
3.12
–0.72
0
±0
The Greens (LV)
1,524
1.63
New
0
±0
Independent Segovian Alternative (ASí)
1,214
1.30
–0.10
0
±0
Commoners' Land–Alternative for Castile and León (TC–ACAL)
992
1.06
–0.01
0
±0
Republican Left (IR)
331
0.35
+0.17
0
±0
Blank ballots
1,975
2.11
–0.32
Total
93,551
6
±0
Valid votes
93,551
98.95
+0.08
Invalid votes
997
1.05
–0.08
Votes cast / turnout
94,548
76.01
–0.23
Abstentions
29,842
23.99
+0.23
Registered voters
124,390
Sources[11] [14]
2003 regional election [ ]
Summary of the 25 May 2003 Cortes of Castile and León election results in Segovia
Parties and coalitions
Popular vote
Seats
Votes
%
±pp
Total
+/−
People's Party (PP)
47,636
50.77
–2.95
4 ±0
Spanish Socialist Workers' Party (PSOE)
34,157
36.41
+4.33
2 ±0
United Left of Castile and León (IUCyL)
3,601
3.84
–1.92
0
±0
The Greens–Green Group (LV–GV)
2,196
2.34
+0.77
0
±0
Independent Segovian Alternative (ASí)
1,314
1.40
New
0
±0
Democratic and Social Centre (CDS)
1,034
1.10
–0.44
0
±0
Commoners' Land–Castilian Nationalist Party (TC–PNC)
1,001
1.07
+0.50
0
±0
Castilian Left (IzCa)
304
0.32
New
0
±0
Republican Left (IR)
170
0.18
New
0
±0
Humanist Party (PH)
125
0.13
New
0
±0
Blank ballots
2,281
2.43
–0.87
Total
93,819
6
±0
Valid votes
93,819
98.87
+0.02
Invalid votes
1,070
1.13
–0.02
Votes cast / turnout
94,889
76.24
+5.68
Abstentions
29,568
23.76
–5.68
Registered voters
124,457
Sources[11] [15]
1999 regional election [ ]
Summary of the 13 June 1999 Cortes of Castile and León election results in Segovia
Parties and coalitions
Popular vote
Seats
Votes
%
±pp
Total
+/−
People's Party (PP)
47,391
53.72
–2.99
4 ±0
Spanish Socialist Workers' Party (PSOE)
28,302
32.08
+5.61
2 ±0
United Left of Castile and León (IUCyL)
5,082
5.76
–4.79
0
±0
The Greens–Green Group (LV–GV)
1,383
1.57
+0.01
0
±0
Centrist Union–Democratic and Social Centre (UC–CDS)
1,356
1.54
New
0
±0
Spanish Democratic Party (PADE)
576
0.65
New
0
±0
Commoners' Land–Castilian Nationalist Party (TC–PNC)
503
0.57
+0.04
0
±0
Nationalist Party of Castile and León (PANCAL)
276
0.31
New
0
±0
Regionalist Unity of Castile and León (URCL)
230
0.26
New
0
±0
Spanish Phalanx of the CNSO (FE–JONS)
203
0.23
–0.02
0
±0
Blank ballots
2,913
3.30
+1.10
Total
88,215
6
±0
Valid votes
88,215
98.85
–0.06
Invalid votes
1,030
1.15
+0.06
Votes cast / turnout
89,245
70.56
–4.72
Abstentions
37,240
29.44
+4.72
Registered voters
126,485
Sources[11] [16]
1995 regional election [ ]
Summary of the 28 May 1995 Cortes of Castile and León election results in Segovia
Parties and coalitions
Popular vote
Seats
Votes
%
±pp
Total
+/−
People's Party (PP)
51,842
56.71
+10.66
4 ±0
Spanish Socialist Workers' Party (PSOE)
24,195
26.47
–5.93
2 ±0
United Left of Castile and León (IU)
9,644
10.55
+4.73
0
±0
Platform of Independents of Spain (PIE)
1,430
1.56
New
0
±0
The Greens–Green Group (LV–GV)
1,423
1.56
New
0
±0
Commoners' Land–Castilian Nationalist Party (TC–PNC)
482
0.53
New
0
±0
Spanish Phalanx of the CNSO (FE–JONS)
230
0.25
New
0
±0
Party of El Bierzo (PB)
161
0.18
New
0
±0
Blank ballots
2,014
2.20
+0.23
Total
91,421
6
±0
Valid votes
91,421
98.91
+0.11
Invalid votes
1,010
1.09
–0.11
Votes cast / turnout
92,431
75.28
+4.87
Abstentions
30,352
24.72
–4.87
Registered voters
122,783
Sources[11] [17]
1991 regional election [ ]
Summary of the 26 May 1991 Cortes of Castile and León election results in Segovia
Parties and coalitions
Popular vote
Seats
Votes
%
±pp
Total
+/−
People's Party (PP)1
38,663
46.05
+5.90
4 +2
Spanish Socialist Workers' Party (PSOE)
27,199
32.40
+5.62
2 ±0
Democratic and Social Centre (CDS)
9,204
10.96
–11.62
0
–2
United Left (IU)
4,888
5.82
–1.24
0
±0
The Greens (LV)
1,457
1.74
New
0
±0
Castilian Regionalist Party (PREC)
679
0.81
New
0
±0
Castilianist Union (UC)
211
0.25
New
0
±0
Blank ballots
1,657
1.97
–0.17
Total
83,958
6
±0
Valid votes
83,958
98.80
+0.27
Invalid votes
1,023
1.20
–0.27
Votes cast / turnout
84,981
70.41
–4.41
Abstentions
35,714
29.59
+4.41
Registered voters
120,695
Sources[11] [18] [19]
1987 regional election [ ]
Summary of the 10 June 1987 Cortes of Castile and León election results in Segovia
Parties and coalitions
Popular vote
Seats
Votes
%
±pp
Total
+/−
Spanish Socialist Workers' Party (PSOE)
23,165
26.78
–12.98
2 –1
Democratic and Social Centre (CDS)
19,532
22.58
+16.86
2 +2
People's Alliance (AP)1
19,418
22.45
–23.34
1 –2
People's Democratic Party (PDP)
15,310
17.70
New
1 +1
United Left (IU)2
6,104
7.06
+4.60
0
±0
Workers' Party of Spain–Communist Unity (PTE–UC)
402
0.46
New
0
±0
Nationalist Party of Castile and León (PNCL–PANCAL)
326
0.38
New
0
±0
Humanist Platform (PH)
259
0.30
New
0
±0
Leonesist Union (UNLE)
134
0.15
New
0
±0
Blank ballots
1,852
2.14
+0.59
Total
86,502
6
±0
Valid votes
86,502
98.53
+0.20
Invalid votes
1,287
1.47
–0.20
Votes cast / turnout
87,789
74.82
–0.23
Abstentions
29,549
25.18
+0.23
Registered voters
117,338
Sources[11] [20] [21]
1983 regional election [ ]
Summary of the 8 May 1983 Cortes of Castile and León election results in Segovia
Parties and coalitions
Popular vote
Seats
Votes
%
±pp
Total
+/−
People's Coalition (AP –PDP –UL )
38,893
45.79
n/a 3 n/a
Spanish Socialist Workers' Party (PSOE)
33,772
39.76
n/a
3 n/a
Democratic and Social Centre (CDS)
4,862
5.72
n/a
0
n/a
Liberal Democratic Party (PDL)
4,019
4.73
n/a
0
n/a
Communist Party of Castile and León (PCCL–PCE)
2,087
2.46
n/a
0
n/a
Blank ballots
1,314
1.55
n/a
Total
84,947
6
n/a
Valid votes
84,947
98.33
n/a
Invalid votes
1,447
1.67
n/a
Votes cast / turnout
86,394
75.05
n/a
Abstentions
28,728
24.95
n/a
Registered voters
115,122
Sources[11] [22] [23]
References [ ]
^ "Cifras oficiales de población resultantes de la revisión del Padrón municipal a 1 de enero. Población por provincias y por sexo" . ine.es (in Spanish). National Institute of Statistics . Retrieved 8 February 2020 .^ a b "Ley Orgánica 4/1983, de 25 de febrero, de Estatuto de Autonomía de Castilla-León". Organic Law No. 4 of 25 February 1983 Boletín Oficial del Estado . Retrieved 16 September 2017 . ^ a b "Ley Orgánica 14/2007, de 30 de noviembre, de reforma del Estatuto de Autonomía de Castilla y León". Organic Law No. 14 of 30 November 2007 Boletín Oficial del Estado (in Spanish). Retrieved 15 September 2017 . ^ a b c "Ley 3/1987, de 30 de marzo, Electoral de Castilla y León". Law No. 3 of 30 March 1987 Boletín Oficial del Estado (in Spanish). Retrieved 15 September 2017 . ^ Reig Pellicer, Naiara (16 December 2015). "Spanish elections: Begging for the right to vote" . cafebabel.co.uk . Retrieved 17 July 2017 . ^ Gallagher, Michael (30 July 2012). "Effective threshold in electoral systems" . Trinity College, Dublin. Archived from the original on 30 July 2017. Retrieved 22 July 2017 . ^ "Real Decreto-ley 20/1977, de 18 de marzo, sobre Normas Electorales". Royal Decree-Law No. 20 of 18 March 1977 Boletín Oficial del Estado (in Spanish). Retrieved 14 December 2019 . ^ "Ley Orgánica 5/1985, de 19 de junio, del Régimen Electoral General". Organic Law No. 5 of 19 June 1985 Boletín Oficial del Estado (in Spanish). Retrieved 30 January 2020 . ^ "Resolución de 7 de marzo de 2022, de la Junta Electoral de Castilla y León, por la que se publica el resumen de los resultados de las elecciones a las Cortes de Castilla y León convocadas por Decreto 2/2021, de 21 de diciembre, y celebradas el 13 de febrero de 2022, conforme a las actas de escrutinio general y de proclamación de electos remitidas por las Juntas Electorales Provinciales" (PDF) . Boletín Oficial de Castilla y León (in Spanish). Retrieved 9 March 2022 .^ "Cortes of Castile and León election results, 26 May 2019" (PDF) . www.juntaelectoralcentral.es (in Spanish). Electoral Commission of Castile and León. 20 June 2019. Retrieved 20 June 2019 .^ a b c d e f g h i "Elections to the Cortes of Castile and León" . servicios.jcyl.es (in Spanish). Junta of Castile and León. Retrieved 14 January 2018 .^ "Cortes of Castile and León election results, 24 May 2015" (PDF) . www.juntaelectoralcentral.es (in Spanish). Electoral Commission of Castile and León. 6 July 2015. Retrieved 24 September 2017 .^ "Cortes of Castile and León election results, 22 May 2011" (PDF) . www.juntaelectoralcentral.es (in Spanish). Electoral Commission of Castile and León. 9 August 2011. Retrieved 24 September 2017 .^ "Cortes of Castile and León election results, 27 May 2007" (PDF) . www.juntaelectoralcentral.es (in Spanish). Electoral Commission of Castile and León. 30 July 2007. Retrieved 24 September 2017 .^ "Cortes of Castile and León election results, 25 May 2003" (PDF) . www.juntaelectoralcentral.es (in Spanish). Electoral Commission of Castile and León. 9 July 2003. Retrieved 24 September 2017 .^ "Cortes of Castile and León election results, 13 June 1999" (PDF) . www.juntaelectoralcentral.es (in Spanish). Electoral Commission of Castile and León. 6 August 1999. Retrieved 24 September 2017 .^ "Cortes of Castile and León election results, 28 May 1995" (PDF) . www.juntaelectoralcentral.es (in Spanish). Electoral Commission of Castile and León. 12 July 1995. Retrieved 24 September 2017 .^ "Cortes of Castile and León election results, 26 May 1991" (PDF) . www.juntaelectoralcentral.es (in Spanish). Electoral Commission of Castile and León. 3 July 1991. Retrieved 24 September 2017 .^ "Number 153. Report-declaration of the Cortes of Castile and León election of 26 May 1991" (PDF) . tcu.es (in Spanish). Court of Auditors. Retrieved 8 December 2019 .^ "Cortes of Castile and León election results, 10 June 1987" (PDF) . www.juntaelectoralcentral.es (in Spanish). Electoral Commission of Castile and León. 12 August 1987. Retrieved 24 September 2017 .^ "Number 75. Audit report on the regularity of electoral accounting derived from the elections held on June 10, 1987" (PDF) . tcu.es (in Spanish). Court of Auditors. Retrieved 8 December 2019 .^ "Cortes of Castile and León election, 1983. Segovia" . www.datoselecciones.com (in Spanish). Election Data. Retrieved 26 September 2017 .^ "Cortes of Castile and León election results, 8 May 1983" (PDF) . www.juntaelectoralcentral.es (in Spanish). Central Electoral Commission. 28 October 1983. Retrieved 24 September 2017 .
Coordinates : 41°10′N 4°00′W / 41.167°N 4.000°W / 41.167; -4.000