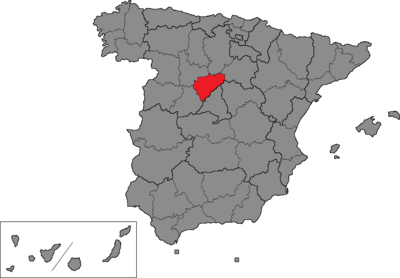
Segovia is one of the 52 constituencies (Spanish : circunscripciones ) represented in the Congress of Deputies , the lower chamber of the Spanish parliament, the Cortes Generales . The constituency currently elects four deputies . Its boundaries correspond to those of the Spanish province of Segovia . The electoral system uses the D'Hondt method and a closed-list proportional representation , with a minimum threshold of three percent.
Electoral system [ ] The constituency was created as per the Political Reform Act 1977 and was first contested in the 1977 general election . The Act provided for the provinces of Spain to be established as multi-member districts in the Congress of Deputies ,[2] Spanish Constitution of 1978 . Additionally, the Constitution requires for any modification of the provincial limits to be approved under an organic law , needing an absolute majority in the Cortes Generales .[3]
Voting is on the basis of universal suffrage , which comprises all nationals over eighteen and in full enjoyment of their political rights. The only exception was in 1977, when this was limited to nationals over twenty-one and in full enjoyment of their political and civil rights. Amendments to the electoral law in 2011 required for Spaniards abroad to apply for voting before being permitted to vote, a system known as "begged" or expat vote (Spanish : Voto rogado ).[4] D'Hondt method and a closed list proportional representation , with an electoral threshold of three percent of valid votes—which includes blank ballots—being applied in each constituency. Each provincial constituency is entitled to an initial minimum of two seats, with the remaining 248 being distributed in proportion to their populations. Ceuta and Melilla are allocated the two remaining seats, which are elected using plurality voting .[3] [5] [6] district magnitude .[7]
The electoral law allows for parties and federations registered in the interior ministry , coalitions and groupings of electors to present lists of candidates. Parties and federations intending to form a coalition ahead of an election are required to inform the relevant Electoral Commission within ten days of the election call—fifteen before 1985—whereas groupings of electors need to secure the signature of at least one percent of the electorate in the constituencies for which they seek election—one-thousandth of the electorate, with a compulsory minimum of 500 signatures, until 1985—disallowing electors from signing for more than one list of candidates. Also since 2011, parties, federations or coalitions that have not obtained a mandate in either chamber of the Cortes at the preceding election are required to secure the signature of at least 0.1 percent of electors in the aforementioned constituencies.[5] [6]
Deputies [ ] Elections [ ] November 2019 general election [ ]
Summary of the 10 November 2019 Congress of Deputies election results in Segovia
Parties and coalitions
Popular vote
Seats
Votes
%
±pp
Total
+/−
People's Party (PP)
28,057
32.99
+6.12
1 ±0
Spanish Socialist Workers' Party (PSOE)
25,233
29.67
+1.47
1 ±0
Vox (Vox)
14,569
17.13
+4.73
1 +1
United We Can (Podemos –IU )
7,901
9.29
–0.36
0
±0
Citizens–Party of the Citizenry (Cs)
6,861
8.07
–11.89
0
–1
Animalist Party Against Mistreatment of Animals (PACMA)
462
0.54
–0.12
0
±0
Centered (centrados)
234
0.28
–0.22
0
±0
Zero Cuts –Green Group –PCAS –TC (Recortes Cero–GV–PCAS–TC)
191
0.22
+0.02
0
±0
Spanish Communist Workers' Party (PCOE)
173
0.20
±0.00
0
±0
For a Fairer World (PUM+J)
133
0.16
+0.02
0
±0
European Retirees Social Democratic Party (PDSJE)
115
0.14
New
0
±0
Communist Party of the Workers of Spain (PCTE)
67
0.08
–0.02
0
±0
Libertarian Party (P–LIB)
38
0.04
New
0
±0
Blank ballots
1,005
1.18
+0.34
Total
85,039
3
±0
Valid votes
85,039
98.37
–0.06
Invalid votes
1,412
1.63
+0.06
Votes cast / turnout
86,451
72.35
–6.22
Abstentions
33,041
27.65
+6.22
Registered voters
119,492
Sources[8]
April 2019 general election [ ]
Summary of the 28 April 2019 Congress of Deputies election results in Segovia
Parties and coalitions
Popular vote
Seats
Votes
%
±pp
Total
+/−
Spanish Socialist Workers' Party (PSOE)
26,088
28.20
+6.72
1 ±0
People's Party (PP)
24,853
26.87
–18.51
1 –1
Citizens–Party of the Citizenry (Cs)
18,460
19.96
+4.60
1 +1
Vox (Vox)
11,468
12.40
+12.09
0
±0
United We Can (Podemos –IU –Equo )
8,931
9.65
–5.53
0
±0
Animalist Party Against Mistreatment of Animals (PACMA)
611
0.66
–0.03
0
±0
Centered (centrados)
459
0.50
New
0
±0
Act (PACT)
276
0.30
New
0
±0
Spanish Communist Workers' Party (PCOE)
184
0.20
New
0
±0
Zero Cuts –Green Group –PCAS –TC (Recortes Cero–GV–PCAS–TC)
183
0.20
–0.03
0
±0
For a Fairer World (PUM+J)
127
0.14
New
0
±0
Communist Party of the Workers of Spain (PCTE)
89
0.10
New
0
±0
Blank ballots
779
0.84
+0.15
Total
92,508
3
±0
Valid votes
92,508
98.43
–0.30
Invalid votes
1,478
1.57
+0.30
Votes cast / turnout
93,986
78.57
+4.36
Abstentions
25,630
21.43
–4.36
Registered voters
119,616
Sources[9]
2016 general election [ ]
Summary of the 26 June 2016 Congress of Deputies election results in Segovia
Parties and coalitions
Popular vote
Seats
Votes
%
±pp
Total
+/−
People's Party (PP)
40,172
45.38
+5.98
2 ±0
Spanish Socialist Workers' Party (PSOE)
19,014
21.48
–0.05
1 ±0
Citizens–Party of the Citizenry (C's)
13,595
15.36
–1.70
0
±0
United We Can (Podemos –IU –Equo –Segoviemos )1
13,440
15.18
–3.20
0
±0
Animalist Party Against Mistreatment of Animals (PACMA)
612
0.69
+0.13
0
±0
Union, Progress and Democracy (UPyD)
352
0.40
–0.99
0
±0
Vox (Vox)
277
0.31
New
0
±0
Zero Cuts –Green Group (Recortes Cero–GV)
202
0.23
–0.02
0
±0
Spanish Phalanx of the CNSO (FE–JONS)
129
0.15
–0.09
0
±0
Communist Party of the Peoples of Spain (PCPE)
117
0.13
–0.08
0
±0
Blank ballots
615
0.69
–0.29
Total
88,525
3
±0
Valid votes
88,525
98.73
+0.13
Invalid votes
1,137
1.27
–0.13
Votes cast / turnout
89,662
74.21
–2.49
Abstentions
31,161
25.79
+2.49
Registered voters
120,823
Sources[10]
2015 general election [ ]
Summary of the 20 December 2015 Congress of Deputies election results in Segovia
Parties and coalitions
Popular vote
Seats
Votes
%
±pp
Total
+/−
People's Party (PP)
36,182
39.40
–17.01
2 ±0
Spanish Socialist Workers' Party (PSOE)
19,769
21.53
–5.26
1 ±0
Citizens–Party of the Citizenry (C's)
15,665
17.06
New
0
±0
We Can (Podemos)
13,144
14.31
New
0
±0
United Left –Popular Unity in Common–Segoviemos (IU–UPeC–Segoviemos)
3,742
4.07
–1.59
0
±0
Union, Progress and Democracy (UPyD)
1,274
1.39
–5.25
0
±0
Animalist Party Against Mistreatment of Animals (PACMA)
517
0.56
+0.18
0
±0
Zero Cuts –Green Group (Recortes Cero–GV)
227
0.25
New
0
±0
Spanish Phalanx of the CNSO (FE–JONS)
223
0.24
–0.03
0
±0
Communist Party of the Peoples of Spain (PCPE)
190
0.21
New
0
±0
Blank ballots
903
0.98
–0.62
Total
91,836
3
±0
Valid votes
91,836
98.60
+0.49
Invalid votes
1,303
1.40
–0.49
Votes cast / turnout
93,139
76.70
+0.36
Abstentions
28,301
23.30
–0.36
Registered voters
121,440
Sources[11]
2011 general election [ ]
Summary of the 20 November 2011 Congress of Deputies election results in Segovia
Parties and coalitions
Popular vote
Seats
Votes
%
±pp
Total
+/−
People's Party (PP)
52,173
56.41
+2.98
2 ±0
Spanish Socialist Workers' Party (PSOE)
24,780
26.79
–12.26
1 ±0
Union, Progress and Democracy (UPyD)
6,889
7.45
+5.82
0
±0
United Left of Castile and León : Plural Left (IUCyL)
5,237
5.66
+3.00
0
±0
Equo (Equo)
981
1.06
New
0
±0
Animalist Party Against Mistreatment of Animals (PACMA)
353
0.38
+0.24
0
±0
Spanish Phalanx of the CNSO (FE–JONS)
247
0.27
+0.20
0
±0
For a Fairer World (PUM+J)
237
0.26
+0.16
0
±0
Communist Unification of Spain (UCE)
115
0.12
New
0
±0
Blank ballots
1,477
1.60
+0.31
Total
92,489
3
±0
Valid votes
92,489
98.11
–1.07
Invalid votes
1,780
1.89
+1.07
Votes cast / turnout
94,269
76.34
–4.77
Abstentions
29,212
23.66
+4.77
Registered voters
123,481
Sources[12]
2008 general election [ ]
Summary of the 9 March 2008 Congress of Deputies election results in Segovia
Parties and coalitions
Popular vote
Seats
Votes
%
±pp
Total
+/−
People's Party (PP)
53,399
53.43
+0.98
2 ±0
Spanish Socialist Workers' Party (PSOE)
39,023
39.05
–0.89
1 ±0
United Left–Alternative (IU)
2,657
2.66
–0.81
0
±0
Union, Progress and Democracy (UPyD)
1,631
1.63
New
0
±0
The Greens (Verdes)
560
0.56
New
0
±0
Commoners' Land (TC)
329
0.33
–0.13
0
±0
Anti-Bullfighting Party Against Mistreatment of Animals (PACMA)
140
0.14
New
0
±0
Citizens–Party of the Citizenry (C's)
99
0.10
New
0
±0
For a Fairer World (PUM+J)
98
0.10
New
0
±0
Alternative in Blank (ABLA)
97
0.10
New
0
±0
Social Democratic Party (PSD)
94
0.09
New
0
±0
Citizens for Blank Votes (CenB)
89
0.09
–0.34
0
±0
National Democracy (DN)
87
0.09
+0.04
0
±0
Communist Party of the Castilian People (PCPC–PCPE)
78
0.08
–0.01
0
±0
Spanish Phalanx of the CNSO (FE–JONS)
67
0.07
±0.00
0
±0
Family and Life Party (PFyV)
42
0.04
New
0
±0
Centrist Party (PCTR)
34
0.03
New
0
±0
Authentic Phalanx (FA)
29
0.03
±0.00
0
±0
Spanish Alternative (AES)
25
0.03
New
0
±0
Humanist Party (PH)
22
0.02
–0.10
0
±0
Spanish Front (Frente)
20
0.02
New
0
±0
Spain 2000 (E–2000)
16
0.02
New
0
±0
Carlist Traditionalist Communion (CTC)
9
0.01
New
0
±0
Blank ballots
1,292
1.29
–0.89
Total
99,937
3
±0
Valid votes
99,937
99.18
+0.16
Invalid votes
822
0.82
–0.16
Votes cast / turnout
100,759
81.11
±0.00
Abstentions
23,467
18.89
±0.00
Registered voters
124,226
Sources[13]
2004 general election [ ] 2000 general election [ ]
Summary of the 12 March 2000 Congress of Deputies election results in Segovia
Parties and coalitions
Popular vote
Seats
Votes
%
±pp
Total
+/−
People's Party (PP)
54,367
57.48
+2.72
2 ±0
Spanish Socialist Workers' Party –Progressives (PSOE–p)
29,178
30.85
–1.39
1 ±0
United Left (IU)
4,898
5.18
–3.72
0
±0
Centrist Union–Democratic and Social Centre (UC–CDS)
1,407
1.49
+0.49
0
±0
The Greens–Green Group (LV–GV)
1,143
1.21
+0.36
0
±0
Commoners' Land–Castilian Nationalist Party (TC–PNC)
613
0.65
+0.40
0
±0
Regionalist Unity of Castile and León (URCL)
236
0.25
+0.10
0
±0
Spanish Democratic Party (PADE)
145
0.15
New
0
±0
The Phalanx (FE)
128
0.14
New
0
±0
Natural Law Party (PLN)
87
0.09
New
0
±0
Humanist Party (PH)
75
0.08
–0.01
0
±0
Spain 2000 Platform (ES2000)
55
0.06
New
0
±0
Carlist Party (PC)
29
0.03
New
0
±0
Blank ballots
2,223
2.35
+0.82
Total
94,584
3
±0
Valid votes
94,584
98.90
–0.34
Invalid votes
1,050
1.10
+0.34
Votes cast / turnout
95,634
75.61
–4.63
Abstentions
30,850
24.39
+4.63
Registered voters
126,484
Sources[15]
1996 general election [ ] 1993 general election [ ]
Summary of the 6 June 1993 Congress of Deputies election results in Segovia
Parties and coalitions
Popular vote
Seats
Votes
%
±pp
Total
+/−
People's Party (PP)
46,001
48.00
+8.12
2 ±0
Spanish Socialist Workers' Party (PSOE)
30,945
32.29
+1.61
1 ±0
Democratic and Social Centre (CDS)
8,628
9.00
–7.49
0
±0
United Left of Castile and León (IU)
7,104
7.41
+0.28
0
±0
The Greens (Verdes)
854
0.89
–0.01
0
±0
The Ecologists (LE)
347
0.36
–0.72
0
±0
Ruiz-Mateos Group –European Democratic Alliance (ARM–ADE)
237
0.25
–0.44
0
±0
Commoners' Land–Castilian Nationalist Party (TC–PNC)
141
0.15
New
0
±0
Regionalist Unity of Castile and León (URCL)
140
0.15
New
0
±0
Humanist Party (PH)
86
0.09
–0.22
0
±0
Natural Law Party (PLN)
73
0.08
New
0
±0
Party of El Bierzo (PB)
28
0.03
New
0
±0
Communist Unification of Spain (UCE)
0
0.00
New
0
±0
Blank ballots
1,249
1.30
–0.09
Total
95,833
3
±0
Valid votes
95,833
99.06
+0.45
Invalid votes
912
0.94
–0.45
Votes cast / turnout
96,745
79.35
+3.60
Abstentions
25,183
20.65
–3.60
Registered voters
121,928
Sources[17]
1989 general election [ ]
Summary of the 29 October 1989 Congress of Deputies election results in Segovia
Parties and coalitions
Popular vote
Seats
Votes
%
±pp
Total
+/−
People's Party (PP)1
35,705
39.88
+3.52
2 +1
Spanish Socialist Workers' Party (PSOE)
27,468
30.68
–1.71
1 ±0
Democratic and Social Centre (CDS)
14,764
16.49
–6.99
0
–1
United Left (IU)
6,387
7.13
+4.67
0
±0
The Ecologist Greens (LVE)
967
1.08
New
0
±0
The Greens–Green List (LV–LV)
802
0.90
New
0
±0
Ruiz-Mateos Group (Ruiz-Mateos)
616
0.69
New
0
±0
Workers' Socialist Party (PST)
518
0.58
–0.02
0
±0
Workers' Party of Spain–Communist Unity (PTE–UC)2
283
0.32
–0.50
0
±0
Humanist Party (PH)
278
0.31
New
0
±0
Communist Party of the Peoples of Spain (PCPE)
163
0.18
New
0
±0
Alliance for the Republic (AxR)3
137
0.15
–0.06
0
±0
Centrist Unity–Democratic Spanish Party (PED)
110
0.12
New
0
±0
Spanish Phalanx of the CNSO (FE–JONS)
109
0.12
–0.09
0
±0
Blank ballots
1,230
1.37
+0.09
Total
89,537
3
±0
Valid votes
89,537
98.61
+1.18
Invalid votes
1,261
1.39
–1.18
Votes cast / turnout
90,798
75.75
–3.44
Abstentions
29,070
24.25
+3.44
Registered voters
119,868
Sources[18]
1986 general election [ ]
Summary of the 22 June 1986 Congress of Deputies election results in Segovia
Parties and coalitions
Popular vote
Seats
Votes
%
±pp
Total
+/−
People's Coalition (AP –PDP –PL )1
32,785
36.36
–1.95
1 –1
Spanish Socialist Workers' Party (PSOE)
29,204
32.39
–4.72
1 ±0
Democratic and Social Centre (CDS)
21,170
23.48
+15.96
1 +1
United Left (IU)2
2,218
2.46
+1.00
0
±0
Democratic Reformist Party (PRD)
1,126
1.25
New
0
±0
Communists' Unity Board (MUC)
736
0.82
New
0
±0
Workers' Socialist Party (PST)
542
0.60
–0.56
0
±0
Communist Unification of Spain (UCE)
266
0.30
+0.15
0
±0
Christian Spanish Party (PAEC)
254
0.28
New
0
±0
Spanish Phalanx of the CNSO (FE–JONS)
188
0.21
New
0
±0
Internationalist Socialist Workers' Party (POSI)
186
0.21
New
0
±0
Party of the Communists of Catalonia (PCC)
179
0.20
New
0
±0
Republican Popular Unity (UPR)
155
0.17
New
0
±0
Blank ballots
1,152
1.28
+0.29
Total
90,161
3
±0
Valid votes
90,161
97.43
–0.34
Invalid votes
2,379
2.57
+0.34
Votes cast / turnout
92,540
79.19
–5.16
Abstentions
24,314
20.81
+5.16
Registered voters
116,854
Sources[19]
1982 general election [ ]
Summary of the 28 October 1982 Congress of Deputies election results in Segovia
Parties and coalitions
Popular vote
Seats
Votes
%
±pp
Total
+/−
People's Alliance–People's Democratic Party (AP –PDP )1
35,483
38.31
+31.75
2 +2
Spanish Socialist Workers' Party (PSOE)
34,375
37.11
+14.03
1 ±0
Union of the Democratic Centre (UCD)
9,680
10.45
–48.85
0
–2
Democratic and Social Centre (CDS)
6,967
7.52
New
0
±0
Spanish Ruralist Party (PRE)
1,984
2.14
–1.36
0
±0
Communist Party of Spain (PCE)
1,348
1.46
–2.68
0
±0
Workers' Socialist Party (PST)
1,074
1.16
New
0
±0
New Force (FN)2
413
0.45
–0.69
0
±0
Communist Unification of Spain (UCE)
142
0.15
New
0
±0
Communist League–Internationalist Socialist Workers' Coalition (LC (COSI))
122
0.13
New
0
±0
Communist Unity Candidacy (CUC)
112
0.12
New
0
±0
Revolutionary Communist League (LCR)
0
0.00
New
0
±0
Communist Movement of Castile and León (MC–CL)
0
0.00
–0.64
0
±0
Blank ballots
919
0.99
+0.31
Total
92,619
3
±0
Valid votes
92,619
97.77
–1.01
Invalid votes
2,115
2.23
+1.01
Votes cast / turnout
94,734
84.35
+8.66
Abstentions
17,582
15.65
–8.66
Registered voters
112,316
Sources[20]
1979 general election [ ]
Summary of the 1 March 1979 Congress of Deputies election results in Segovia
Parties and coalitions
Popular vote
Seats
Votes
%
±pp
Total
+/−
Union of the Democratic Centre (UCD)
49,375
59.30
+0.54
2 ±0
Spanish Socialist Workers' Party (PSOE)1
19,216
23.08
–4.43
1 ±0
Democratic Coalition (CD)2
5,458
6.56
–2.10
0
±0
Communist Party of Spain (PCE)
3,450
4.14
+1.68
0
±0
Spanish Ruralist Party (PRE)
2,912
3.50
New
0
±0
National Union (UN)
948
1.14
New
0
±0
Communist Movement –Organization of Communist Left (MC–OIC)
532
0.64
New
0
±0
Party of Labour of Spain (PTE)3
306
0.37
–0.05
0
±0
Workers' Revolutionary Organization (ORT)
299
0.36
New
0
±0
Spanish Phalanx of the CNSO (Authentic) (FE–JONS(A))
195
0.23
–0.84
0
±0
Blank ballots
567
0.68
+0.25
Total
83,258
3
±0
Valid votes
83,258
98.78
+0.55
Invalid votes
1,028
1.22
–0.55
Votes cast / turnout
84,286
75.69
–11.93
Abstentions
27,074
24.31
+11.93
Registered voters
111,360
Sources[21]
1977 general election [ ]
Summary of the 15 June 1977 Congress of Deputies election results in Segovia
Parties and coalitions
Popular vote
Seats
Votes
%
±pp
Total
+/−
Union of the Democratic Centre (UCD)
50,270
58.76
n/a 2 n/a
Spanish Socialist Workers' Party (PSOE)
18,210
21.28
n/a
1 n/a
People's Alliance (AP)
7,407
8.66
n/a
0
n/a
People's Socialist Party –Socialist Unity (PSP–US)
5,330
6.23
n/a
0
n/a
Communist Party of Spain (PCE)
2,101
2.46
n/a
0
n/a
Spanish Phalanx of the CNSO (Authentic) (FE–JONS(A))
913
1.07
n/a
0
n/a
Socialist Movement (MS)
599
0.70
n/a
0
n/a
Democratic Left Front (FDI)
361
0.42
n/a
0
n/a
Blank ballots
364
0.43
n/a
Total
85,555
3
n/a
Valid votes
85,555
98.23
n/a
Invalid votes
1,542
1.77
n/a
Votes cast / turnout
87,097
87.62
n/a
Abstentions
12,311
12.38
n/a
Registered voters
99,408
Sources[22]
References [ ]
Congress of Deputies constituencies in
Spain
Coordinates : 41°10′N 4°00′W / 41.167°N 4.000°W / 41.167; -4.000