Constituency represented in the lower chamber of the Spanish parliament
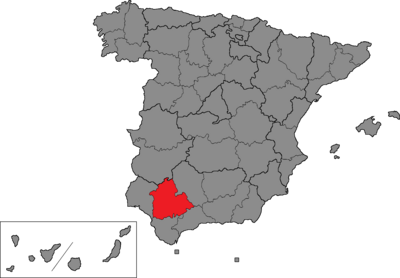
Seville (Spanish : Sevilla ) is one of the 52 constituencies (Spanish: circunscripciones ) represented in the Congress of Deputies , the lower chamber of the Spanish parliament, the Cortes Generales . The constituency currently elects 12 deputies . Its boundaries correspond to those of the Spanish province of Seville . The electoral system uses the D'Hondt method and a closed-list proportional representation , with a minimum threshold of three percent.
Electoral system [ ] The constituency was created as per the Political Reform Act 1977 and was first contested in the 1977 general election . The Act provided for the provinces of Spain to be established as multi-member districts in the Congress of Deputies ,[2] Spanish Constitution of 1978 . Additionally, the Constitution requires for any modification of the provincial limits to be approved under an organic law , needing an absolute majority in the Cortes Generales .[3]
Voting is on the basis of universal suffrage , which comprises all nationals over eighteen and in full enjoyment of their political rights. The only exception was in 1977, when this was limited to nationals over twenty-one and in full enjoyment of their political and civil rights. Amendments to the electoral law in 2011 required for Spaniards abroad to apply for voting before being permitted to vote, a system known as "begged" or expat vote (Spanish : Voto rogado ).[4] D'Hondt method and a closed list proportional representation , with an electoral threshold of three percent of valid votes—which includes blank ballots—being applied in each constituency. Each provincial constituency is entitled to an initial minimum of two seats, with the remaining 248 being distributed in proportion to their populations. Ceuta and Melilla are allocated the two remaining seats, which are elected using plurality voting .[3] [5] [6] district magnitude .[7]
The electoral law allows for parties and federations registered in the interior ministry , coalitions and groupings of electors to present lists of candidates. Parties and federations intending to form a coalition ahead of an election are required to inform the relevant Electoral Commission within ten days of the election call—fifteen before 1985—whereas groupings of electors need to secure the signature of at least one percent of the electorate in the constituencies for which they seek election—one-thousandth of the electorate, with a compulsory minimum of 500 signatures, until 1985—disallowing electors from signing for more than one list of candidates. Also since 2011, parties, federations or coalitions that have not obtained a mandate in either chamber of the Cortes at the preceding election are required to secure the signature of at least 0.1 percent of electors in the aforementioned constituencies.[5] [6]
Deputies [ ] Elections [ ] November 2019 general election [ ]
Summary of the 10 November 2019 Congress of Deputies election results in Seville
Parties and coalitions
Popular vote
Seats
Votes
%
±pp
Total
+/−
Spanish Socialist Workers' Party (PSOE)
380,385
36.11
–1.00
5 ±0
Vox (Vox)
188,813
17.92
+5.72
2 +1
People's Party (PP)
188,166
17.86
+3.35
2 ±0
United We Can (Podemos –IULV–CA )
153,435
14.56
–1.43
2 ±0
Citizens–Party of the Citizenry (Cs)
83,575
7.93
–8.75
1 –1
More Country–Andalusia (Más País–Andalucía)
22,388
2.13
New
0
±0
Animalist Party Against Mistreatment of Animals (PACMA)
12,035
1.14
–0.20
0
±0
Andalusia by Herself (AxSí)
5,183
0.49
+0.20
0
±0
Spanish Communist Workers' Party (PCOE)
1,495
0.14
+0.02
0
±0
Zero Cuts –Green Group (Recortes Cero–GV)
1,456
0.14
±0.00
0
±0
For a Fairer World (PUM+J)
1,402
0.13
–0.01
0
±0
Communist Party of the Andalusian Party (PCPA)
842
0.08
+0.01
0
±0
Communist Party of the Workers of Spain (PCTE)
550
0.05
–0.02
0
±0
Blank ballots
13,793
1.31
+0.30
Total
1,053,518
12
±0
Valid votes
1,053,518
98.35
–0.24
Invalid votes
17,729
1.65
+0.24
Votes cast / turnout
1,071,247
69.21
–4.52
Abstentions
476,497
30.79
+4.52
Registered voters
1,547,744
Sources[8]
April 2019 general election [ ]
Summary of the 28 April 2019 Congress of Deputies election results in Seville
Parties and coalitions
Popular vote
Seats
Votes
%
±pp
Total
+/−
Spanish Socialist Workers' Party (PSOE)
416,543
37.11
+3.48
5 +1
Citizens–Party of the Citizenry (Cs)
187,243
16.68
+3.31
2 +1
United We Can (Podemos –IULV–CA –Equo )
179,497
15.99
–4.79
2 –1
People's Party (PP)
162,891
14.51
–14.52
2 –2
Vox (Vox)
136,949
12.20
+11.99
1 +1
Animalist Party Against Mistreatment of Animals (PACMA)
15,073
1.34
+0.04
0
±0
Act (PACT)
3,567
0.32
New
0
±0
Andalusia by Herself (AxSí)
3,288
0.29
New
0
±0
Zero Cuts –Green Group (Recortes Cero–GV)
1,592
0.14
–0.05
0
±0
For a Fairer World (PUM+J)
1,527
0.14
New
0
±0
Spanish Communist Workers' Party (PCOE)
1,317
0.12
+0.02
0
±0
Communist Party of the Workers of Spain (PCTE)
830
0.07
New
0
±0
Communist Party of the Andalusian Party (PCPA)
799
0.07
–0.06
0
±0
Blank ballots
11,391
1.01
+0.08
Total
1,122,507
12
±0
Valid votes
1,122,507
98.59
–0.29
Invalid votes
16,056
1.41
+0.29
Votes cast / turnout
1,138,563
73.73
+5.52
Abstentions
405,617
26.27
–5.52
Registered voters
1,544,180
Sources[9]
2016 general election [ ]
Summary of the 26 June 2016 Congress of Deputies election results in Seville
Parties and coalitions
Popular vote
Seats
Votes
%
±pp
Total
+/−
Spanish Socialist Workers' Party (PSOE)
347,470
33.63
–0.29
4 –1
People's Party (PP)
299,884
29.03
+3.85
4 +1
United We Can for Andalusia (Podemos –IU –Equo )1
214,663
20.78
–3.97
3 +1
Citizens–Party of the Citizenry (C's)
138,086
13.37
+0.34
1 –1
Animalist Party Against Mistreatment of Animals (PACMA)
13,389
1.30
+0.39
0
±0
Union, Progress and Democracy (UPyD)
9,932
0.23
–0.29
0
±0
Vox (Vox)
8,341
0.20
±0.00
0
±0
Zero Cuts –Green Group (Recortes Cero–GV)
7,317
0.17
+0.04
0
±0
Communist Party of the Peoples of Spain (PCPE)
5,482
0.13
+0.01
0
±0
Spanish Phalanx of the CNSO (FE–JONS)
1,980
0.05
+0.01
0
±0
We Are Andalusians Party, For Andalusia and the Peoples (AND)
1,727
0.04
New
0
±0
Spanish Communist Workers' Party (PCOE)
1,696
0.04
±0.00
0
±0
Blank Seats (EB)
961
0.02
+0.01
0
±0
United Free Citizens (CILUS)
830
0.02
–0.01
0
±0
Revolutionary Anticapitalist Left (IZAR)
687
0.02
New
0
±0
Libertarian Party (P–LIB)
393
0.01
–0.02
0
±0
Blank ballots
9,582
0.93
+0.02
Total
1,033,112
12
±0
Valid votes
1,033,112
98.88
–0.11
Invalid votes
11,739
1.12
+0.11
Votes cast / turnout
1,044,851
68.21
–3.97
Abstentions
486,955
31.79
+3.97
Registered voters
1,531,806
Sources[10]
2015 general election [ ]
Summary of the 20 December 2015 Congress of Deputies election results in Seville
Parties and coalitions
Popular vote
Seats
Votes
%
±pp
Total
+/−
Spanish Socialist Workers' Party (PSOE)
371,142
33.92
–7.80
5 –1
People's Party (PP)
275,463
25.18
–13.50
3 –2
We Can (Podemos)
208,408
19.05
New
2 +2
Citizens–Party of the Citizenry (C's)
142,574
13.03
New
2 +2
United Left/Greens–Assembly for Andalusia –Popular Unity (IULV–CA–UPeC)
62,309
5.70
–2.93
0
–1
Animalist Party Against Mistreatment of Animals (PACMA)
9,976
0.91
New
0
±0
Union, Progress and Democracy (UPyD)
6,421
0.59
–4.93
0
±0
Vox (Vox)
2,717
0.25
New
0
±0
Zero Cuts –Green Group (Recortes Cero–GV)
1,413
0.13
New
0
±0
Spanish Communist Workers' Party (PCOE)
1,096
0.10
New
0
±0
Spanish Phalanx of the CNSO (FE–JONS)
989
0.09
–0.02
0
±0
Communist Party of the Peoples of Spain (PCPE)
893
0.08
–0.02
0
±0
Libertarian Party (P–LIB)
652
0.06
New
0
±0
Blank ballots
9,968
0.91
–0.37
Total
1,094,021
12
±0
Valid votes
1,094,021
98.99
+0.15
Invalid votes
11,217
1.01
–0.15
Votes cast / turnout
1,105,238
72.18
+0.96
Abstentions
425,923
27.82
–0.96
Registered voters
1,531,161
Sources[11]
2011 general election [ ]
Summary of the 20 November 2011 Congress of Deputies election results in Seville
Parties and coalitions
Popular vote
Seats
Votes
%
±pp
Total
+/−
Spanish Socialist Workers' Party (PSOE)
442,267
41.72
–16.37
6 –2
People's Party (PP)
410,046
38.68
+7.19
5 +1
United Left/The Greens–Assembly for Andalusia : Plural Left (IULV–CA)
91,519
8.63
+3.24
1 +1
Union, Progress and Democracy (UPyD)
58,502
5.52
+4.27
0
±0
Andalusian Party (PA)1
23,302
2.20
+0.51
0
±0
Equo (Equo)
11,313
1.07
New
0
±0
Blank Seats (EB)
2,966
0.28
New
0
±0
For a Fairer World (PUM+J)
1,415
0.13
+0.06
0
±0
Anti-capitalists (Anticapitalistas)
1,194
0.11
New
0
±0
Spanish Phalanx of the CNSO (FE–JONS)
1,160
0.11
+0.07
0
±0
Communist Party of the Peoples of Spain (PCPE)
1,077
0.10
+0.05
0
±0
Humanist Party (PH)
900
0.08
+0.04
0
±0
Internationalist Solidarity and Self-Management (SAIn)
593
0.06
±0.00
0
±0
Communist Unification of Spain (UCE)
332
0.03
New
0
±0
Blank ballots
13,596
1.28
+0.17
Total
1,060,182
12
±0
Valid votes
1,060,182
98.84
–0.59
Invalid votes
12,464
1.16
+0.59
Votes cast / turnout
1,072,646
71.22
–2.62
Abstentions
433,483
28.78
+2.62
Registered voters
1,506,129
Sources[12]
Footnotes:
1 Andalusian Party results are compared to Andalusian Coalition totals in the 2008 election.
2008 general election [ ]
Summary of the 9 March 2008 Congress of Deputies election results in Seville
Parties and coalitions
Popular vote
Seats
Votes
%
±pp
Total
+/−
Spanish Socialist Workers' Party (PSOE)
626,558
58.09
–0.18
8 ±0
People's Party (PP)
339,644
31.49
+3.56
4 ±0
United Left/The Greens–Assembly for Andalusia–Alternative (IULV–CA)
58,091
5.39
–1.29
0
±0
Andalusian Coalition (CA)1
18,206
1.69
–2.81
0
±0
Union, Progress and Democracy (UPyD)
13,467
1.25
New
0
±0
The Greens (Verdes)
3,065
0.28
New
0
±0
Anti-Bullfighting Party Against Mistreatment of Animals (PACMA)
1,517
0.14
New
0
±0
Internationalist Socialist Workers' Party (POSI)
1,058
0.10
New
0
±0
For a Fairer World (PUM+J)
807
0.07
New
0
±0
Citizens–Party of the Citizenry (C's)
682
0.06
New
0
±0
Internationalist Solidarity and Self-Management (SAIn)
612
0.06
New
0
±0
Communist Party of the Peoples of Spain (PCPE)
533
0.05
+0.05
0
±0
Spanish Phalanx of the CNSO (FE–JONS)
414
0.04
–0.01
0
±0
Humanist Party (PH)
393
0.04
–0.04
0
±0
Family and Life Party (PFyV)
365
0.03
–0.05
0
±0
Engine and Sports Alternative (AMD)
356
0.03
New
0
±0
Spanish Alternative (AES)
287
0.03
New
0
±0
National Democracy (DN)
279
0.03
–0.01
0
±0
Authentic Phalanx (FA)
189
0.02
New
0
±0
Blank ballots
12,019
1.11
–0.71
Total
1,078,542
12
±0
Valid votes
1,078,542
99.43
+0.03
Invalid votes
6,170
0.57
–0.03
Votes cast / turnout
1,084,712
73.84
–3.24
Abstentions
384,364
26.16
+3.24
Registered voters
1,469,076
Sources[13]
2004 general election [ ]
Summary of the 14 March 2004 Congress of Deputies election results in Seville
Parties and coalitions
Popular vote
Seats
Votes
%
±pp
Total
+/−
Spanish Socialist Workers' Party (PSOE)
639,293
58.27
+9.25
8 +1
People's Party (PP)
306,464
27.93
–7.05
4 –1
United Left/The Greens–Assembly for Andalusia (IULV–CA)
73,344
6.68
–1.60
0
–1
Andalusian Party (PA)
45,005
4.10
–0.98
0
±0
Socialist Party of Andalusia (PSA)
4,415
0.40
New
0
±0
Citizens for Blank Votes (CenB)
2,237
0.20
New
0
±0
Republican Left (IR)
1,111
0.10
New
0
±0
Family and Life Party (PFyV)
865
0.08
New
0
±0
Humanist Party (PH)
858
0.08
+0.02
0
±0
Democratic and Social Centre (CDS)
700
0.06
+0.02
0
±0
Andalusia Assembly (A)
655
0.06
+0.02
0
±0
Spanish Phalanx of the CNSO (FE–JONS)1
591
0.05
+0.03
0
±0
Andalusian Social Democratic Party (PSDA)
583
0.05
New
0
±0
The Phalanx (FE)
394
0.04
–0.06
0
±0
National Democracy (DN)
389
0.04
New
0
±0
Republican Social Movement (MSR)
292
0.03
New
0
±0
Communist Party of the Peoples of Spain (PCPE)
0
0.00
–0.08
0
±0
Blank ballots
19,960
1.82
+0.10
Total
1,097,156
12
–1
Valid votes
1,097,156
99.40
+0.02
Invalid votes
6,602
0.60
–0.02
Votes cast / turnout
1,103,758
77.08
+7.34
Abstentions
328,273
22.92
–7.34
Registered voters
1,432,031
Sources[14]
2000 general election [ ]
Summary of the 12 March 2000 Congress of Deputies election results in Seville
Parties and coalitions
Popular vote
Seats
Votes
%
±pp
Total
+/−
Spanish Socialist Workers' Party –Progressives (PSOE–p)
476,277
49.02
–1.03
7 ±0
People's Party (PP)
339,879
34.98
+3.56
5 +1
United Left/The Greens–Assembly for Andalusia (IULV–CA)
80,455
8.28
–5.13
1 –1
Andalusian Party (PA)
49,342
5.08
+1.55
0
±0
Andalusian Left (IA)
1,431
0.15
New
0
±0
The Phalanx (FE)
939
0.10
New
0
±0
Internationalist Socialist Workers' Party (POSI)
921
0.09
New
0
±0
Liberal Independent Group (GIL)
871
0.09
New
0
±0
Communist Party of the Peoples of Spain (PCPE)
762
0.08
–0.03
0
±0
Humanist Party (PH)
607
0.06
+0.01
0
±0
Andalusian Nation (NA)
511
0.05
±0.00
0
±0
Voice of the Andalusian People (VDPA)
493
0.05
±0.00
0
±0
Natural Law Party (PLN)
489
0.05
New
0
±0
Andalusia Assembly (A)
368
0.04
New
0
±0
Centrist Union–Democratic and Social Centre (UC–CDS)
364
0.04
–0.01
0
±0
Republican Action (AR)
303
0.03
New
0
±0
Spain 2000 Platform (ES2000)
283
0.03
New
0
±0
Spanish Democratic Party (PADE)
240
0.02
New
0
±0
Independent Spanish Phalanx–Phalanx 2000 (FEI–FE 2000)
238
0.02
–0.01
0
±0
Blank ballots
16,727
1.72
+0.68
Total
971,500
13
±0
Valid votes
971,500
99.38
–0.11
Invalid votes
6,012
0.62
+0.11
Votes cast / turnout
977,512
69.74
–9.95
Abstentions
424,070
30.26
+9.95
Registered voters
1,401,582
Sources[15]
1996 general election [ ]
Summary of the 3 March 1996 Congress of Deputies election results in Seville
Parties and coalitions
Popular vote
Seats
Votes
%
±pp
Total
+/−
Spanish Socialist Workers' Party of Andalusia (PSOE–A)
521,484
50.05
–5.98
7 –1
People's Party (PP)
327,384
31.42
+5.42
4 +1
United Left/The Greens–Assembly for Andalusia (IULV–CA)
139,733
13.41
+1.73
2 +1
Andalusian Party (PA)1
36,797
3.53
–0.01
0
±0
Communist Party of the Andalusian People (PCPA)
1,162
0.11
–0.07
0
±0
Workers' Revolutionary Party (PRT)2
1,117
0.11
–0.07
0
±0
Authentic Spanish Phalanx (FEA)
616
0.06
New
0
±0
Voice of the Andalusian People (VDPA)
529
0.05
New
0
±0
Humanist Party (PH)
515
0.05
+0.02
0
±0
Andalusian Nation (NA)
500
0.05
New
0
±0
Centrist Union (UC)
478
0.05
–0.53
0
±0
Alliance for National Unity (AUN)
351
0.03
New
0
±0
Independent Spanish Phalanx (FEI)
346
0.03
+0.01
0
±0
Blank ballots
10,812
1.04
+0.41
Total
1,041,824
13
+1
Valid votes
1,041,824
99.49
–0.10
Invalid votes
5,348
0.51
+0.10
Votes cast / turnout
1,047,172
79.69
+0.72
Abstentions
266,826
20.31
–0.72
Registered voters
1,313,998
Sources[16]
1993 general election [ ]
Summary of the 6 June 1993 Congress of Deputies election results in Seville
Parties and coalitions
Popular vote
Seats
Votes
%
±pp
Total
+/−
Spanish Socialist Workers' Party of Andalusia (PSOE–A)
543,651
56.03
+1.88
8 ±0
People's Party (PP)
252,241
26.00
+7.00
3 +1
United Left–Assembly for Andalusia (IU–CA)
113,316
11.68
+0.19
1 ±0
Andalusian Party (PA)
30,421
3.14
–5.88
0
–1
Democratic and Social Centre (CDS)
5,597
0.58
–1.69
0
±0
The Greens of Andalusia (Verdes)
5,507
0.57
–0.03
0
±0
Andalusian Progress Party (PAP)
3,884
0.40
New
0
±0
The Ecologists (LE)
2,506
0.26
–0.05
0
±0
Communist Party of the Andalusian People (PCPA)
1,718
0.18
–0.04
0
±0
Workers' Socialist Party (PST)
1,713
0.18
–0.05
0
±0
Ruiz-Mateos Group –European Democratic Alliance (ARM–ADE)
1,090
0.11
–0.90
0
±0
Liberal Independent Group (GIL)
775
0.08
New
0
±0
Natural Law Party (PLN)
608
0.06
New
0
±0
Spanish Phalanx of the CNSO (FE–JONS)
440
0.05
–0.05
0
±0
Coalition for a New Socialist Party (CNPS)1
270
0.03
–0.02
0
±0
Humanist Party (PH)
255
0.03
–0.03
0
±0
Independent Spanish Phalanx (FEI)
203
0.02
New
0
±0
Communist Unification of Spain (UCE)
0
0.00
New
0
±0
Blank ballots
6,106
0.63
+0.13
Total
970,301
12
±0
Valid votes
970,301
99.59
+0.39
Invalid votes
3,993
0.41
–0.39
Votes cast / turnout
974,294
78.97
+7.49
Abstentions
259,384
21.03
–7.49
Registered voters
1,233,678
Sources[17]
1989 general election [ ]
Summary of the 29 October 1989 Congress of Deputies election results in Seville
Parties and coalitions
Popular vote
Seats
Votes
%
±pp
Total
+/−
Spanish Socialist Workers' Party of Andalusia (PSOE–A)
438,615
54.15
–5.05
8 ±0
People's Party (PP)1
153,905
19.00
–2.17
2 –1
United Left–Assembly for Andalusia (IU–CA)
93,080
11.49
+3.24
1 ±0
Andalusian Party (PA)
73,031
9.02
+4.96
1 +1
Democratic and Social Centre (CDS)
18,420
2.27
–1.36
0
±0
Ruiz-Mateos Group (Ruiz-Mateos)
8,163
1.01
New
0
±0
Workers' Party of Spain–Communist Unity (PTE–UC)2
6,277
0.77
–0.61
0
±0
The Greens–Green List (LV–LV)
4,823
0.60
New
0
±0
The Ecologist Greens (LVE)
2,474
0.31
New
0
±0
Workers' Socialist Party (PST)
1,830
0.23
–0.09
0
±0
Communist Party of the Andalusian People (PCPA)
1,760
0.22
New
0
±0
Spanish Vertex Ecological Development Revindication (VERDE)
1,436
0.18
+0.03
0
±0
Spanish Phalanx of the CNSO (FE–JONS)
798
0.10
–0.02
0
±0
Humanist Party (PH)
484
0.06
New
0
±0
Alliance for the Republic (AxR)3
391
0.05
±0.00
0
±0
Proverist Party (PPr)
245
0.03
New
0
±0
Centrist Unity–Democratic Spanish Party (PED)
185
0.02
New
0
±0
Communist Party of Spain (Marxist–Leninist) (PCE (m–l))4
0
0.00
–0.06
0
±0
Blank ballots
4,083
0.50
+0.12
Total
810,000
12
±0
Valid votes
810,000
99.20
+0.48
Invalid votes
6,518
0.80
–0.48
Votes cast / turnout
816,518
71.48
–2.12
Abstentions
325,772
28.52
+2.12
Registered voters
1,142,290
Sources[18]
1986 general election [ ]
Summary of the 22 June 1986 Congress of Deputies election results in Seville
Parties and coalitions
Popular vote
Seats
Votes
%
±pp
Total
+/−
Spanish Socialist Workers' Party (PSOE)
473,743
59.20
–2.79
8 ±0
People's Coalition (AP –PDP –PL )1
169,409
21.17
–0.81
3 ±0
United Left (IU)2
66,034
8.25
+1.10
1 ±0
Andalusian Party (PA)
32,515
4.06
+1.14
0
±0
Democratic and Social Centre (CDS)
29,033
3.63
+2.91
0
±0
Communists' Unity Board (MUC)
11,020
1.38
New
0
±0
Democratic Reformist Party (PRD)
4,428
0.55
New
0
±0
Workers' Socialist Party (PST)
2,565
0.32
–0.17
0
±0
Green Alternative List (LAV)
2,224
0.28
New
0
±0
Socialist Party of the Andalusian People (PSPA)
1,760
0.22
New
0
±0
Spanish Vertex Ecological Development Revindication (VERDE)
1,208
0.15
New
0
±0
Spanish Phalanx of the CNSO (FE–JONS)
988
0.12
+0.12
0
±0
Communist Unification of Spain (UCE)
841
0.11
+0.07
0
±0
Republican Popular Unity (UPR)3
512
0.06
±0.00
0
±0
National Unity Coalition (CUN)
448
0.06
New
0
±0
Internationalist Socialist Workers' Party (POSI)
378
0.05
New
0
±0
Party of the Communists of Catalonia (PCC)
0
0.00
New
0
±0
Blank ballots
3,077
0.38
+0.10
Total
800,183
12
±0
Valid votes
800,183
98.72
+0.24
Invalid votes
10,407
1.28
–0.24
Votes cast / turnout
810,590
73.60
–7.56
Abstentions
290,792
26.40
+7.56
Registered voters
1,101,382
Sources[19]
1982 general election [ ]
Summary of the 28 October 1982 Congress of Deputies election results in Seville
Parties and coalitions
Popular vote
Seats
Votes
%
±pp
Total
+/−
Spanish Socialist Workers' Party of Andalusia (PSA–PSOE)
496,543
61.99
+32.59
8 +4
People's Alliance–People's Democratic Party (AP –PDP )1
176,054
21.98
+17.29
3 +3
Communist Party of Andalusia (PCA–PCE)
57,272
7.15
–8.85
1 –1
Union of the Democratic Centre (UCD)
30,004
3.75
–23.86
0
–4
Socialist Party of Andalusia–Andalusian Party (PSA–PA)
23,375
2.92
–11.76
0
–2
Democratic and Social Centre (CDS)
5,775
0.72
New
0
±0
Workers' Socialist Party (PST)
2,568
0.32
New
0
±0
New Force (FN)2
2,227
0.28
–1.05
0
±0
Spanish Communist Workers' Party (PCOE)
2,017
0.25
New
0
±0
Spanish Solidarity (SE)
718
0.09
New
0
±0
Communist League–Internationalist Socialist Workers' Coalition (LC (COSI))
599
0.07
New
0
±0
Communist Party of Spain (Marxist–Leninist) (PCE (m–l))
520
0.06
New
0
±0
Falangist Movement of Spain (MFE)
376
0.05
New
0
±0
Independent Spanish Phalanx (FEI)
341
0.04
New
0
±0
Communist Unification of Spain (UCE)
335
0.04
–0.28
0
±0
Socialist Party (PS)3
0
0.00
–0.54
0
±0
Communist Movement of Andalusia (MCA)
0
0.00
–0.15
0
±0
Revolutionary Communist League (LCR)
0
0.00
–0.11
0
±0
Spanish Phalanx of the CNSO (FE–JONS)
0
0.00
New
0
±0
Blank ballots
2,271
0.28
+0.13
Total
800,995
12
±0
Valid votes
800,995
98.48
–0.56
Invalid votes
12,322
1.52
+0.56
Votes cast / turnout
813,317
81.16
+9.76
Abstentions
188,753
18.84
–9.76
Registered voters
1,002,070
Sources[20]
1979 general election [ ]
Summary of the 1 March 1979 Congress of Deputies election results in Seville
Parties and coalitions
Popular vote
Seats
Votes
%
±pp
Total
+/−
Spanish Socialist Workers' Party (PSOE)1
203,468
29.40
–12.19
4 –1
Union of the Democratic Centre (UCD)
191,099
27.61
–5.01
4 –1
Communist Party of Spain (PCE)
110,731
16.00
+2.57
2 ±0
Socialist Party of Andalusia–Andalusian Party (PSA–PA)
101,601
14.68
New
2 +2
Democratic Coalition (CD)2
32,428
4.69
–1.57
0
±0
Party of Labour of Spain (PTE)3
27,337
3.95
+1.17
0
±0
National Union (UN)4
9,225
1.33
+1.01
0
±0
Spanish Socialist Workers' Party (historical) (PSOEh)5
3,706
0.54
–0.05
0
±0
Communist Unification of Spain (UCE)
2,226
0.32
New
0
±0
Communist Organization of Spain (Red Flag) (OCE–BR)
2,045
0.30
New
0
±0
Workers' Communist Party (PCT)
1,134
0.16
New
0
±0
Workers' Revolutionary Organization (ORT)6
1,086
0.16
–0.09
0
±0
Communist Movement –Organization of Communist Left (MC–OIC)
1,031
0.15
New
0
±0
Spanish Phalanx of the CNSO (Authentic) (FE–JONS(A))
1,029
0.15
New
0
±0
Workers and Peasants Party (POC)
986
0.14
New
0
±0
Revolutionary Communist League (LCR)7
774
0.11
+0.11
0
±0
Republican Left (IR)
741
0.11
New
0
±0
Proverist Party (PPr)
443
0.06
New
0
±0
Blank ballots
1,051
0.15
–0.15
Total
692,141
12
±0
Valid votes
692,141
99.04
+0.27
Invalid votes
6,677
0.96
–0.27
Votes cast / turnout
698,818
71.40
–10.89
Abstentions
279,954
28.60
+10.89
Registered voters
978,772
Sources[21]
1977 general election [ ]
Summary of the 15 June 1977 Congress of Deputies election results in Seville
Parties and coalitions
Popular vote
Seats
Votes
%
±pp
Total
+/−
Spanish Socialist Workers' Party (PSOE)
251,336
36.72
n/a 5 n/a
Union of the Democratic Centre (UCD)
223,252
32.62
n/a
5 n/a
Communist Party of Spain (PCE)
91,914
13.43
n/a
2 n/a
People's Alliance (AP)
42,860
6.26
n/a
0
n/a
People's Socialist Party –Socialist Unity (PSP–US)
33,329
4.87
n/a
0
n/a
Democratic Left Front (FDI)
19,008
2.78
n/a
0
n/a
Federation of Christian Democracy (FPD –ID )
6,523
0.95
n/a
0
n/a
Democratic Socialist Alliance (ASDCI)
4,064
0.59
n/a
0
n/a
Andalusian Regional Unity (URA)
2,663
0.39
n/a
0
n/a
National Alliance July 18 (AN18)
2,197
0.32
n/a
0
n/a
Andalusian Socialist Movement (MSA)
1,749
0.26
n/a
0
n/a
Spanish Social Reform (RSE)
1,736
0.25
n/a
0
n/a
Workers' Electoral Group (AET)
1,736
0.25
n/a
0
n/a
Front for Workers' Unity (FUT)
0
0.00
n/a
0
n/a
Left Andalusian Candidacy (CAI)
0
0.00
n/a
0
n/a
Blank ballots
2,032
0.30
n/a
Total
684,399
12
n/a
Valid votes
684,399
98.77
n/a
Invalid votes
8,527
1.23
n/a
Votes cast / turnout
692,926
82.29
n/a
Abstentions
149,116
17.71
n/a
Registered voters
842,042
Sources[22]
References [ ]
Congress of Deputies constituencies in
Spain
Coordinates : 37°30′N 5°30′W / 37.500°N 5.500°W / 37.500; -5.500