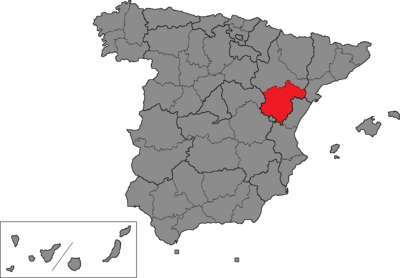
Teruel is one of the 52 constituencies (Spanish : circunscripciones ) represented in the Congress of Deputies , the lower chamber of the Spanish parliament, the Cortes Generales . The constituency currently elects three deputies . Its boundaries correspond to those of the Spanish province of Teruel . The electoral system uses the D'Hondt method and a closed-list proportional representation , with a minimum threshold of three percent.
Electoral system [ ] The constituency was created as per the Political Reform Act 1977 and was first contested in the 1977 general election . The Act provided for the provinces of Spain to be established as multi-member districts in the Congress of Deputies ,[2] Spanish Constitution of 1978 . Additionally, the Constitution requires for any modification of the provincial limits to be approved under an organic law , needing an absolute majority in the Cortes Generales .[3]
Voting is on the basis of universal suffrage , which comprises all nationals over eighteen and in full enjoyment of their political rights. The only exception was in 1977, when this was limited to nationals over twenty-one and in full enjoyment of their political and civil rights. Amendments to the electoral law in 2011 required for Spaniards abroad to apply for voting before being permitted to vote, a system known as "begged" or expat vote (Spanish : Voto rogado ).[4] D'Hondt method and a closed list proportional representation , with an electoral threshold of three percent of valid votes—which includes blank ballots—being applied in each constituency. Each provincial constituency is entitled to an initial minimum of two seats, with the remaining 248 being distributed in proportion to their populations. Ceuta and Melilla are allocated the two remaining seats, which are elected using plurality voting .[3] [5] [6] district magnitude .[7]
The electoral law allows for parties and federations registered in the interior ministry , coalitions and groupings of electors to present lists of candidates. Parties and federations intending to form a coalition ahead of an election are required to inform the relevant Electoral Commission within ten days of the election call—fifteen before 1985—whereas groupings of electors need to secure the signature of at least one percent of the electorate in the constituencies for which they seek election—one-thousandth of the electorate, with a compulsory minimum of 500 signatures, until 1985—disallowing electors from signing for more than one list of candidates. Also since 2011, parties, federations or coalitions that have not obtained a mandate in either chamber of the Cortes at the preceding election are required to secure the signature of at least 0.1 percent of electors in the aforementioned constituencies.[5] [6]
Deputies [ ] Elections [ ] November 2019 general election [ ]
Summary of the 10 November 2019 Congress of Deputies election results in Teruel
Parties and coalitions
Popular vote
Seats
Votes
%
±pp
Total
+/−
Teruel Exists (¡TE!)
19,761
26.66
New
1 +1
Spanish Socialist Workers' Party (PSOE)
18,934
25.54
–7.28
1 ±0
People's Party (PP)
17,520
23.63
–0.15
1 ±0
Vox (Vox)
9,346
12.61
+1.93
0
±0
United We Can (Podemos –IU )
3,982
5.37
–5.16
0
±0
Citizens–Party of the Citizenry (Cs)
3,732
5.03
–14.64
0
–1
Animalist Party Against Mistreatment of Animals (PACMA)
212
0.29
–0.29
0
±0
Spanish Communist Workers' Party (PCOE)
96
0.13
New
0
±0
Communist Party of the Peoples of Spain (PCPE)
45
0.06
–0.06
0
±0
For a Fairer World (PUM+J)
35
0.05
–0.04
0
±0
Union of Everyone (UdT)
26
0.04
±0.00
0
±0
Puyalón (PYLN)
25
0.03
–0.05
0
±0
At Once Valencian Community (aUna CV)
13
0.02
New
0
±0
Zero Cuts –Green Group (Recortes Cero–GV)
0
0.00
–0.14
0
±0
Blank ballots
403
0.54
–0.51
Total
74,130
3
±0
Valid votes
74,130
99.29
+0.98
Invalid votes
531
0.71
–0.98
Votes cast / turnout
74,661
69.47
–4.26
Abstentions
32,806
30.53
+4.26
Registered voters
107,467
Sources[8]
April 2019 general election [ ]
Summary of the 28 April 2019 Congress of Deputies election results in Teruel
Parties and coalitions
Popular vote
Seats
Votes
%
±pp
Total
+/−
Spanish Socialist Workers' Party (PSOE)
25,629
32.82
+6.49
1 ±0
People's Party (PP)
18,566
23.78
–17.48
1 –1
Citizens–Party of the Citizenry (Cs)
15,357
19.67
+6.49
1 +1
Vox (Vox)
8,336
10.68
New
0
±0
United We Can (Podemos –IU –Equo )
8,224
10.53
–6.23
0
±0
Animalist Party Against Mistreatment of Animals (PACMA)
452
0.58
+0.04
0
±0
Blank Seats (EB)
272
0.35
+0.02
0
±0
Zero Cuts –Green Group (Recortes Cero–GV)
113
0.14
–0.03
0
±0
Communist Party of the Peoples of Spain (PCPE)
96
0.12
+0.03
0
±0
For a Fairer World (PUM+J)
74
0.09
New
0
±0
Puyalón (PYLN)
66
0.08
New
0
±0
Death to the System (+MAS+)
47
0.06
New
0
±0
Union of Everyone (UdT)
28
0.04
–0.02
0
±0
Blank ballots
823
1.05
+0.11
Total
78,083
3
±0
Valid votes
78,083
98.31
–0.36
Invalid votes
1,344
1.69
+0.36
Votes cast / turnout
79,427
73.73
+4.31
Abstentions
28,307
26.27
–4.31
Registered voters
107,734
Sources[9]
2016 general election [ ]
Summary of the 26 June 2016 Congress of Deputies election results in Teruel
Parties and coalitions
Popular vote
Seats
Votes
%
±pp
Total
+/−
People's Party –Aragonese Party (PP–PAR)
30,913
41.26
+4.86
2 ±0
Spanish Socialist Workers' Party (PSOE)
19,724
26.33
+0.67
1 ±0
United We Can in Aragon (Podemos –IU –Equo )1
12,558
16.76
–3.57
0
±0
Citizens–Party of the Citizenry (C's)
9,871
13.18
–1.53
0
±0
Animalist Party Against Mistreatment of Animals (PACMA)
402
0.54
+0.06
0
±0
Blank Seats (EB)
245
0.33
–0.07
0
±0
Spanish Phalanx of the CNSO (FE–JONS)
160
0.21
New
0
±0
Zero Cuts –Green Group (Recortes Cero–GV)
125
0.17
–0.01
0
±0
Communist Party of the Peoples of Spain (PCPE)
71
0.09
–0.03
0
±0
Social Aragonese Movement (MAS)
62
0.08
New
0
±0
Union of Everyone (UdT)
48
0.06
New
0
±0
Independents for Aragon (i)
39
0.05
New
0
±0
Blank ballots
704
0.94
–0.20
Total
74,922
3
±0
Valid votes
74,922
98.67
+0.04
Invalid votes
1,010
1.33
–0.04
Votes cast / turnout
75,932
69.42
–2.21
Abstentions
33,448
30.58
+2.21
Registered voters
109,380
Sources[10]
2015 general election [ ]
Summary of the 20 December 2015 Congress of Deputies election results in Teruel
Parties and coalitions
Popular vote
Seats
Votes
%
±pp
Total
+/−
People's Party –Aragonese Party (PP–PAR)
28,282
36.40
–15.38
2 ±0
Spanish Socialist Workers' Party (PSOE)
19,938
25.66
–7.26
1 ±0
We Can (Podemos)
11,895
15.31
New
0
±0
Citizens–Party of the Citizenry (C's)
11,427
14.71
New
0
±0
United Left –Aragonese Union –Popular Unity in Common (IU–CHA–UPeC)
3,897
5.02
–2.88
0
±0
Union, Progress and Democracy (UPyD)
456
0.59
–2.85
0
±0
Animalist Party Against Mistreatment of Animals (PACMA)
375
0.48
+0.14
0
±0
Blank Seats (EB)
313
0.40
–0.20
0
±0
Zero Cuts –Green Group (Recortes Cero–GV)
139
0.18
New
0
±0
Communist Party of the Peoples of Spain (PCPE)
97
0.12
New
0
±0
Blank ballots
883
1.14
–1.05
Total
77,702
3
±0
Valid votes
77,702
98.63
+0.78
Invalid votes
1,082
1.37
–0.78
Votes cast / turnout
78,784
71.63
+1.35
Abstentions
31,200
28.37
–1.35
Registered voters
109,984
Sources[11]
2011 general election [ ]
Summary of the 20 November 2011 Congress of Deputies election results in Teruel
Parties and coalitions
Popular vote
Seats
Votes
%
±pp
Total
+/−
People's Party –Aragonese Party (PP–PAR)1
39,993
51.78
+3.59
2 +1
Spanish Socialist Workers' Party (PSOE)
25,426
32.92
–11.58
1 –1
Aragonese Union –United Left : Plural Left (CHA–IU)2
6,103
7.90
+2.94
0
±0
Union, Progress and Democracy (UPyD)
2,656
3.44
+2.99
0
±0
Blank Seats (EB)
466
0.60
New
0
±0
Animalist Party Against Mistreatment of Animals (PACMA)
260
0.34
+0.23
0
±0
Pirate Party (Pirata)
218
0.28
New
0
±0
Socialists for Teruel (SxT)
169
0.22
New
0
±0
For a Fairer World (PUM+J)
151
0.20
+0.17
0
±0
Communist Unification of Spain (UCE)
93
0.12
New
0
±0
Blank ballots
1,694
2.19
+1.10
Total
77,229
3
±0
Valid votes
77,229
97.85
–1.39
Invalid votes
1,700
2.15
+1.39
Votes cast / turnout
78,929
70.28
–6.29
Abstentions
33,372
29.72
+6.29
Registered voters
112,301
Sources[12]
2008 general election [ ]
Summary of the 9 March 2008 Congress of Deputies election results in Teruel
Parties and coalitions
Popular vote
Seats
Votes
%
±pp
Total
+/−
Spanish Socialist Workers' Party (PSOE)
38,617
44.50
+3.41
2 ±0
People's Party (PP)
34,386
39.62
–1.21
1 ±0
Aragonese Party (PAR)
7,440
8.57
+0.61
0
±0
United Left (IU)
2,270
2.62
–0.24
0
±0
Aragonese Union (CHA)
2,029
2.34
–2.73
0
±0
Union, Progress and Democracy (UPyD)
388
0.45
New
0
±0
The Greens–Green Group (LV–GV)
170
0.20
New
0
±0
Citizens–Party of the Citizenry (C's)
113
0.13
New
0
±0
Anti-Bullfighting Party Against Mistreatment of Animals (PACMA)
93
0.11
New
0
±0
Spanish Phalanx of the CNSO (FE–JONS)
55
0.06
±0.00
0
±0
Communist Party of the Peoples of Spain (PCPE)
49
0.06
–0.07
0
��0
Aragon United Citizens Party (pCUA)
43
0.05
New
0
±0
National Democracy (DN)
34
0.04
+0.01
0
±0
For a Fairer World (PUM+J)
30
0.03
New
0
±0
Social Democratic Party–Federation of Independents of Aragon (PSD–FIA)
30
0.03
New
0
±0
Spanish Alternative (AES)
21
0.02
New
0
±0
Family and Life Party (PFyV)
18
0.02
–0.03
0
±0
Authentic Phalanx (FA)
17
0.02
New
0
±0
Spain 2000 (E–2000)
16
0.02
New
0
±0
National Alliance (AN)
13
0.01
New
0
±0
Centrist Party (PCTR)
10
0.01
New
0
±0
Blank ballots
944
1.09
–0.44
Total
86,786
3
±0
Valid votes
86,786
99.24
+0.03
Invalid votes
667
0.76
–0.03
Votes cast / turnout
87,453
76.57
+0.21
Abstentions
26,759
23.43
–0.21
Registered voters
114,212
Sources[13]
2004 general election [ ]
Summary of the 14 March 2004 Congress of Deputies election results in Teruel
Parties and coalitions
Popular vote
Seats
Votes
%
±pp
Total
+/−
Spanish Socialist Workers' Party (PSOE)
36,152
41.09
+7.28
2 +1
People's Party (PP)
35,920
40.83
–7.10
1 –1
Aragonese Party (PAR)
7,000
7.96
–1.88
0
±0
Aragonese Union (CHA)
4,463
5.07
+1.71
0
±0
United Left –The Greens (IU–LV)
2,514
2.86
–0.03
0
±0
Communist Party of the Peoples of Spain (PCPE)
110
0.13
New
0
±0
Citizens for Blank Votes (CenB)
99
0.11
New
0
±0
Democratic and Social Centre (CDS)
81
0.09
New
0
±0
Spanish Phalanx of the CNSO (FE–JONS)
54
0.06
New
0
±0
Republican Left (IR)
53
0.06
New
0
±0
Family and Life Party (PFyV)
47
0.05
New
0
±0
Humanist Party (PH)
40
0.05
–0.01
0
±0
National Democracy (DN)
30
0.03
New
0
±0
The Phalanx (FE)
29
0.03
–0.07
0
±0
Spanish Democratic Party (PADE)
23
0.03
±0.00
0
±0
Republican Social Movement (MSR)
18
0.02
New
0
±0
Blank ballots
1,349
1.53
+0.11
Total
87,982
3
±0
Valid votes
87,982
99.21
+0.63
Invalid votes
705
0.79
–0.63
Votes cast / turnout
88,687
76.36
+4.17
Abstentions
27,454
23.64
–4.17
Registered voters
116,141
Sources[14]
2000 general election [ ]
Summary of the 12 March 2000 Congress of Deputies election results in Teruel
Parties and coalitions
Popular vote
Seats
Votes
%
±pp
Total
+/−
People's Party (PP)
40,383
47.93
–1.30
2 ±0
Spanish Socialist Workers' Party –Progressives (PSOE–p)
28,488
33.81
–7.41
1 ±0
Aragonese Party (PAR)
8,294
9.84
New
0
±0
Aragonese Union (CHA)
2,831
3.36
+1.52
0
±0
United Left of Aragon (IU)
2,438
2.89
–3.11
0
±0
The Greens–Green Group–SOS Nature (LV–GV)
317
0.38
New
0
±0
The Phalanx (FE)
81
0.10
New
0
±0
Aragonese Initiative (INAR)
65
0.08
New
0
±0
Humanist Party (PH)
51
0.06
New
0
±0
Natural Law Party (PLN)
36
0.04
New
0
±0
Spain 2000 Platform (ES2000)
32
0.04
New
0
±0
Spanish Democratic Party (PADE)
25
0.03
New
0
±0
Catalan State (EC)
18
0.02
New
0
±0
Blank ballots
1,193
1.42
+0.16
Total
84,252
3
±0
Valid votes
84,252
98.58
–0.87
Invalid votes
1,211
1.42
+0.87
Votes cast / turnout
85,463
72.19
–5.30
Abstentions
32,927
27.81
+5.30
Registered voters
118,390
Sources[15]
1996 general election [ ]
Summary of the 3 March 1996 Congress of Deputies election results in Teruel
Parties and coalitions
Popular vote
Seats
Votes
%
±pp
Total
+/−
People's Party –Aragonese Party (PP–PAR)1
45,207
49.23
–2.24
2 +1
Spanish Socialist Workers' Party (PSOE)
37,856
41.22
+0.89
1 –1
United Left of Aragon (IU)
5,506
6.00
+1.57
0
±0
Aragonese Union (CHA)
1,691
1.84
+1.32
0
±0
Centrist Union (UC)
227
0.25
–1.57
0
±0
Workers' Revolutionary Party (PRT)
94
0.10
New
0
±0
Authentic Spanish Phalanx (FEA)
91
0.10
New
0
±0
Blank ballots
1,158
1.26
+0.60
Total
91,830
3
±0
Valid votes
91,830
99.45
+0.11
Invalid votes
504
0.55
–0.11
Votes cast / turnout
92,334
77.49
+1.66
Abstentions
26,826
22.51
–1.66
Registered voters
119,160
Sources[16]
1993 general election [ ]
Summary of the 6 June 1993 Congress of Deputies election results in Teruel
Parties and coalitions
Popular vote
Seats
Votes
%
±pp
Total
+/−
Spanish Socialist Workers' Party (PSOE)
36,327
40.33
+0.25
2 ±0
People's Party (PP)
34,293
38.07
+5.18
1 ±0
Aragonese Party (PAR)
12,070
13.40
+2.84
0
±0
United Left of Aragon (IU)
3,990
4.43
+0.18
0
±0
Democratic and Social Centre (CDS)
1,644
1.82
–6.87
0
±0
Aragonese Union (CHA)
465
0.52
+0.28
0
±0
The Ecologists (LE)
200
0.22
–0.21
0
±0
The Greens (LV)
193
0.21
–0.14
0
±0
Ruiz-Mateos Group–Independent Party–Social Movement (ARM–PAI–MAS)
86
0.10
–0.49
0
±0
Humanist Party (PH)
63
0.07
–0.02
0
±0
Revolutionary Workers' Party (POR)
56
0.06
New
0
±0
Coalition for a New Socialist Party (CNPS)
54
0.06
New
0
±0
Natural Law Party (PLN)
46
0.05
New
0
±0
Communist Unification of Spain (UCE)
0
0.00
New
0
±0
Blank ballots
597
0.66
–0.03
Total
90,084
3
±0
Valid votes
90,084
99.34
+0.20
Invalid votes
594
0.66
–0.20
Votes cast / turnout
90,678
75.83
+4.90
Abstentions
28,900
24.17
–4.90
Registered voters
119,578
Sources[17]
1989 general election [ ]
Summary of the 29 October 1989 Congress of Deputies election results in Teruel
Parties and coalitions
Popular vote
Seats
Votes
%
±pp
Total
+/−
Spanish Socialist Workers' Party (PSOE)
33,744
40.08
–1.00
2 ±0
People's Party (PP)1
27,695
32.89
+0.08
1 ±0
Regionalist Aragonese Party (PAR)
8,894
10.56
+0.91
0
±0
Democratic and Social Centre (CDS)
7,319
8.69
–1.91
0
±0
United Left (IU)
3,580
4.25
+2.69
0
±0
Ruiz-Mateos Group (Ruiz-Mateos)
497
0.59
New
0
±0
Workers' Socialist Party (PST)
410
0.49
–0.01
0
±0
The Ecologist Greens (LVE)
365
0.43
New
0
±0
Workers' Party of Spain–Communist Unity (PTE–UC)2
354
0.42
–0.57
0
±0
The Greens–Green List (LV–LV)
291
0.35
New
0
±0
Aragonese Union (UA–CHA)
203
0.24
New
0
±0
Spanish Phalanx of the CNSO (FE–JONS)
97
0.12
–0.24
0
±0
Communist Party of the Peoples of Spain (PCPE)
88
0.10
New
0
±0
Humanist Party (PH)
74
0.09
New
0
±0
Blank ballots
585
0.69
–0.18
Total
84,196
3
±0
Valid votes
84,196
99.14
+0.70
Invalid votes
731
0.86
–0.70
Votes cast / turnout
84,927
70.93
+0.53
Abstentions
34,799
29.07
–0.53
Registered voters
119,726
Sources[18]
1986 general election [ ]
Summary of the 22 June 1986 Congress of Deputies election results in Teruel
Parties and coalitions
Popular vote
Seats
Votes
%
±pp
Total
+/−
Spanish Socialist Workers' Party (PSOE)
35,785
41.08
+0.11
2 ±0
People's Coalition (AP –PDP –PL )1
28,583
32.81
–0.72
1 ±0
Democratic and Social Centre (CDS)
9,233
10.60
+5.88
0
±0
Regionalist Aragonese Party (PAR)
8,405
9.65
New
0
±0
United Left (IU)2
1,363
1.56
+0.37
0
±0
Democratic Reformist Party (PRD)
956
1.11
New
0
±0
Communists' Unity Board (MUC)
860
0.99
New
0
±0
Workers' Socialist Party (PST)
434
0.50
+0.08
0
±0
Spanish Phalanx of the CNSO (FE–JONS)
312
0.36
New
0
±0
Republican Popular Unity (UPR)3
224
0.26
+0.13
0
±0
Communist Unification of Spain (UCE)
205
0.24
+0.08
0
±0
Blank ballots
754
0.87
+0.21
Total
87,114
3
±0
Valid votes
87,114
98.44
+0.27
Invalid votes
1,378
1.56
–0.27
Votes cast / turnout
88,492
70.40
–9.65
Abstentions
37,209
29.60
+9.65
Registered voters
125,701
Sources[19]
1982 general election [ ]
Summary of the 28 October 1982 Congress of Deputies election results in Teruel
Parties and coalitions
Popular vote
Seats
Votes
%
±pp
Total
+/−
Spanish Socialist Workers' Party (PSOE)
38,834
40.97
+13.84
2 +1
People's Alliance–People's Democratic–Aragonese Party (AP –PDP –PAR )1
31,779
33.53
+25.27
1 +1
Union of the Democratic Centre (UCD)
15,570
16.43
–39.02
0
–2
Democratic and Social Centre (CDS)
4,472
4.72
New
0
±0
Communist Party of Aragon (PCA–PCE)
1,124
1.19
–2.05
0
±0
New Force (FN)2
975
1.03
–1.34
0
±0
Socialist Party of Aragon (PSAr)3
626
0.66
–0.07
0
±0
Workers' Socialist Party (PST)
399
0.42
New
0
±0
Communist Unification of Spain (UCE)
148
0.16
New
0
±0
Communist Party of Spain (Marxist–Leninist) (PCE (m–l))
125
0.13
New
0
±0
Falangist Movement of Spain (MFE)
99
0.10
New
0
±0
Communist Left (LCR –MC )4
0
0.00
–0.44
0
±0
Blank ballots
627
0.66
+0.13
Total
94,778
3
±0
Valid votes
94,778
98.17
–0.72
Invalid votes
1,767
1.83
+0.72
Votes cast / turnout
96,545
80.05
+10.39
Abstentions
24,055
19.95
–10.39
Registered voters
120,600
Sources[20]
1979 general election [ ]
Summary of the 1 March 1979 Congress of Deputies election results in Teruel
Parties and coalitions
Popular vote
Seats
Votes
%
±pp
Total
+/−
Union of the Democratic Centre (UCD)
46,775
55.45
+5.25
2 ±0
Spanish Socialist Workers' Party (PSOE)1
22,886
27.13
+5.89
1 ±0
Democratic Coalition (CD)2
6,971
8.26
–8.01
0
±0
Communist Party of Spain (PCE)
2,737
3.24
+0.62
0
±0
National Union (UN)3
2,000
2.37
+2.01
0
±0
Coalition for Aragon (PSAr –PSDA)
615
0.73
New
0
±0
Party of Labour of Spain (PTE)
475
0.56
New
0
±0
Workers' Communist Party (PCT)
322
0.38
New
0
±0
Communist Movement –Organization of Communist Left (MC–OIC)
247
0.29
New
0
±0
Republican Left (IR)
246
0.29
New
0
±0
Carlist Party (PC)
197
0.23
New
0
±0
Communist Organization of Spain (Red Flag) (OCE–BR)
152
0.18
New
0
±0
Workers' Revolutionary Organization (ORT)
151
0.18
+0.18
0
±0
Revolutionary Communist League (LCR)
128
0.15
New
0
±0
Blank ballots
448
0.53
+0.02
Total
84,350
3
±0
Valid votes
84,350
98.89
+0.77
Invalid votes
945
1.11
–0.77
Votes cast / turnout
85,295
69.66
–14.93
Abstentions
37,146
30.34
+14.93
Registered voters
122,441
Sources[21]
1977 general election [ ]
Summary of the 15 June 1977 Congress of Deputies election results in Teruel
Parties and coalitions
Popular vote
Seats
Votes
%
±pp
Total
+/−
Union of the Democratic Centre (UCD)
46,820
50.20
n/a 2 n/a
Spanish Socialist Workers' Party (PSOE)
16,423
17.61
n/a
1 n/a
People's Alliance (AP)
15,180
16.27
n/a
0
n/a
Independent (INDEP)
6,158
6.60
n/a
0
n/a
People's Socialist Party –Socialist Unity (PSP–US)
3,387
3.63
n/a
0
n/a
Communist Party of Spain (PCE)
2,442
2.62
n/a
0
n/a
Spanish Social Reform (RSE)
1,842
1.97
n/a
0
n/a
National Alliance July 18 (AN18)
332
0.36
n/a
0
n/a
Independent Liberal Party (PLI)
209
0.22
n/a
0
n/a
Blank ballots
479
0.51
n/a
Total
93,272
3
n/a
Valid votes
93,272
98.12
n/a
Invalid votes
1,783
1.88
n/a
Votes cast / turnout
95,055
84.59
n/a
Abstentions
17,321
15.41
n/a
Registered voters
112,376
Sources[22]
References [ ]
Congress of Deputies constituencies in
Spain
Coordinates : 40°40′N 0°40′W / 40.667°N 0.667°W / 40.667; -0.667