Hybrid electric vehicles in the United States

The fleet of hybrid electric vehicles in the United States, with 5.8 million units sold through December 2020,[1] is the second largest in the world after Japan (7.51 million by March 2018).[2] American sales of hybrid electric vehicles represented about 36% of the global stock of hybrids sold worldwide through April 2016.[3]
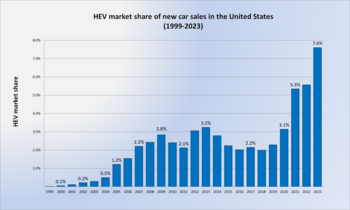
Sales of hybrid vehicles in the U.S. began to decline following the financial crisis of 2007–08, and after a short recovery, reached its peak in 2013 with almost 500,000 units sold and a record market share of 3.19%, but began to decline again in 2014 due to low gasoline prices and increased sales of plug-in electric cars.[4][5][3] The market share slightly recovered in 2019 to 2.3%, and 3.2% in 2020.[1] Since their inception in 1999, a total of 5,803,917 hybrid electric automobiles and sport utility vehicles have been sold in the country through 2020.[1]
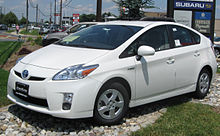
The top selling hybrid electric vehicle in the country is the conventional Toyota Prius, which has sold 1,643,000 units since 2000 through April 2016, representing a 40.8% market share of all hybrids sold in the U.S. since 1999.[3] Cumulative sales of the Prius nameplate totaled 1,932,805 units delivered through April 2016, representing a 48.0% market share of total hybrid sales in the U.S.[6][7][8][4][5][9][10]
California has been the state leading hybrid sales in the U.S.,[11][12][13] followed by New York and Florida.[11] In terms of new hybrids sold per capita, the District of Columbia was the leader.[11] From January to July 2013, the three cities with the highest electric drive car registrations, including hybrids, all-electric cars and plug-in hybrids, were all located in California: Atherton (19.4%) and Los Altos (16.1%) in the Silicon Valley, followed by Santa Monica (15.0%), located in Los Angeles County.[14][15]
Purchases from the Obama administration occurring for 25% of Ford and General Motors hybrid-electric vehicles sold between January 2009 and late 2010. During this period hybrids accounted for about 10% of the 145,473 vehicles bought by the U.S. General Services Administration.[16]
Markets and sales[]
The market of hybrid electric vehicles in the United States is the second largest in the world after Japan[3] with cumulative sales of 5.4 million units through December 2019.[18] American sales of hybrid electric vehicles represented about 36% of the stock of hybrids sold worldwide through April 2016.[3] Cumulative hybrid car sales in the American market passed the 1 million milestone in 2007, the 2 million mark in May 2011,[19] the 3 million milestone in October 2013,[20] and 4 million in April 2016, allowing the U.S. to rank as the world's second largest hybrid market after Japan.[3]
Sales of hybrid vehicles in the U.S. began to decline following the financial crisis of 2007–08, and after a short recovery, began to decline again in 2014 due to low gasoline prices, and had a small rebound in 2019.[3][5][18] Hybrid sales in the American market achieved its highest market share ever in 2013, capturing 3.19% of new carsales that year.[5][3] At the end of 2015 the hybrid take rate had fallen to 2.21%, dropped to 1.99% in 2016, slightly recovered to 2.4% in 2019.[3][9][18]
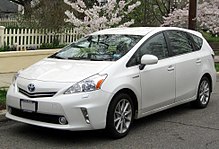
A total of 5,374,000 hybrid electric automobiles and sport utility vehicles (SUVs) have been sold in the country through December 2019.[18] Sales are led by the Toyota Prius, which passed the 1 million mark in April 2011,[21] and has sold 1,643,000 units since 2000 through April 2016, representing a 40.8% market share of all hybrids sold in the U.S. since their inception in 1999.[3] The Toyota Prius family is the market leader with 1,932,805 units sold through April 2016, representing a 48.0% market share of total hybrid sales in the U.S.[6][7][8][4][5][9][10] Out of the 9.0145 million hybrids sold worldwide by Toyota Motor Company through April 2016, the United States accounted for 44.7% of TMC global hybrid sales.[3][22]

Sales of Prius family vehicles in California represented 26% of all Prius purchases in the U.S. during 2012. With 60,688 units sold during this year, the Prius became the best selling nameplate in California, ahead of the previous leader, the Honda Civic (57,124 units) and the third ranked, the Toyota Camry (50,250 units).[23] Again in 2013, the Prius nameplate was the best selling vehicle in California with 69,728 units sold in the state, ahead of the Honda Civic (66,982) and the Honda Accord (63,194).[24][25] Nationwide, the best selling vehicle in 2013 was the Ford F-Series pickup, which has been the best selling vehicle for more than three decades.[26]

As of April 2016, sales of the conventional Prius are followed by the Toyota Camry Hybrid, with 345,640 units sold since 2006, the Honda Civic Hybrid, with cumulative sales of 234,610 vehicles since 2002, the Ford Fusion Hybrid with 166,341 units since 2009, and the Toyota Prius c with 165,075 units since 2012.[3] Among the hybrids built by American manufacturers, the siblings Lincoln MKZ/Mercury Milan/Fusion Hybrids rank first, with combined sales of 200,899 units since 2009 through 2015, followed by the Ford Escape Hybrid and its sibling the Mercury Mariner Hybrid with combined sales of 130,803 vehicles between 2004 and 2012, when the hybrid lineup was discontinued. Ranking next is the Ford C-Max Hybrid, with 72,330 units sold since 2012 through 2015, and the Chevrolet Malibu Hybrid with 38,204 units since 2008.[6][7][8][4][5][10]
- 2012
A total of 434,498 hybrid electric vehicles were sold during 2012, and the hybrid market share of total new car sales in the country was 3.0%, up from 2.1% in 2011.[8] The top five selling hybrids during 2012 were the Toyota Prius liftback (147,503), the second generation Camry Hybrid (45,626), Prius v (1,669), Prius c (35,733), and the Hyundai Sonata Hybrid (20,754).[8] Toyota sold 223,905 Priuses among the various HEV family members in the U.S. in 2012, representing together a market share of 51.5% of all hybrid sold in the country that year.[8]
- 2013
During 2013 hybrid sales totaled 495,685 units, up 14.1% from 2012 and representing a market share of 3.19% of new car sales.[4] The top five selling hybrids during this period were the conventional Prius (145,172), second generation Camry Hybrid (44,448), Prius c (41,979), second generation Fusion Hybrid (37,270), and the Prius v (34,989).[4] Combined Prius family vehicles reached 222,140 units representing a market share of 44.8%, down from 51.5% in the year 2012,[8][4] while Ford Motor Company increased its market share of the conventional hybrid market from 7.5% in 2012 to 14.7% in 2013.[4][27]
models in 2014.[5]
Ford experienced record sales of its hybrids models in the U.S. during 2013, with 72,795 units sold, almost triple the 2012 total.[4][28] During the second quarter of 2013 Ford achieved its best hybrid sales quarter ever, up 517% over the same quarter of 2012.[29] In 2013 Toyota's hybrid market share in the U.S. declined from 2012 totals due to new competition, particularly from Ford with the arrival of new products such as the C-Max Hybrid and the new styling of the Fusion. Except for the Prius c, sales of the other models of the Prius family and the Camry Hybrid suffered a decline from 2012, while the Fusion Hybrid experienced a 164.3% increased from 2012, and C-Max Hybrid sales climbed 156.6%.[4]
- 2014
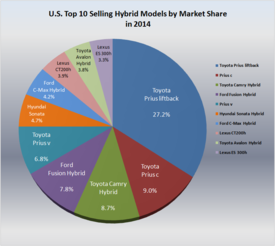
Hybrid sales totaled 452,152 units, down 8.8% from the previous year. The hybrid market share was 2.75% of new car sales, down from 3.19% in 2013, and the lowest since 2011. The best selling Prius Liftback was down 15.4% from 2013, driving the decline in sales of the segment.[5] The top five selling hybrids in 2014 were the conventional Prius (122,776), Prius c (40,570), second generation Camry Hybrid (39,515), second generation Fusion Hybrid (35,405), and the Prius v (30,762), all down from the previous year.[5] Combined Prius family vehicles reached 194,108 units representing a market share of 42.9%, down from 44.8% the previous year.[4][5] Some of the few models with a significant growth in their year-to-year sales were the second generation Honda Accord, Infinti Q50 Hybrid, Nissan Pathfinder Hybrid, and the Chevrolet Impala eAssist.[5]
Geographical distribution[]

California has been the state leading hybrid sales in the U.S. with 55,553 vehicles sold in 2009,[11] 74,932 in 2008,[12] and 91,417 in 2007.[13] In 2009 it was followed by New York (15,438) and Florida (14,949).[11] In terms of new hybrids sold per capita, the District of Columbia was the leader in 2009 with 3.79 hybrids per 1000 residents, followed by California (1.54) and Washington (1.53).[11] The top 5 U. S. metropolitan area markets for sales of hybrid electric vehicles in 2009 were Los Angeles (26,677), New York (21,193), San Francisco (15,799), Washington, D.C. (11,595), and Chicago (8,990).[11] From January to July 2013, the three cities with the highest electric drive car registrations, including hybrids, all-electric cars and plug-in hybrids, were all located in California: Atherton (19.4%) and Los Altos (16.1%) in the Silicon Valley, followed by Santa Monica (15.0%), located in Los Angeles County.[14][15]
The top 5 U. S. metropolitan area markets for sales of hybrid electric vehicles in 2009 were Los Angeles (26,677), New York (21,193), San Francisco (15,799), Washington, D.C. (11,595), and Chicago (8,990).[11] The following table summarizes the top metropolitan area markets in terms of new hybrids sold per capita.
| Top U.S. metropolitan markets for hybrid electric vehicles in 2008-2009[11][30] | |||||
|---|---|---|---|---|---|
| Rank 2009 |
Metropolitan Area |
New registered hybrids per 1000 households (2009) |
Rank 2008 |
Metropolitan Area |
New registered hybrids per 1000 households (2008) |
| 1 | Portland, OR | 8.8 | 1 | Portland, OR | 12.17 |
| 2 | Helena, MT | 6.7 | 2 | San Francisco, CA | 8.84 |
| 3 | San Francisco, CA | 6.7 | 3 | Monterey, CA | 7.16 |
| 4 | Washington, DC | 5.1 | 4 | Santa Barbara, CA | 6.94 |
| 5 | Los Angeles, CA | 4.8 | 5 | San Diego, CA | 6.57 |
| 6 | San Diego, CA | 4.7 | 6 | Los Angeles, CA | 6.08 |
| 7 | Seattle, WA | 4.7 | 7 | Charlottesville, VA | 5.42 |
| 8 | Juneau, AK | 4.6 | 8 | Seattle, WA | 4.90 |
| 9 | Santa Barbara, CA | 4.4 | 9 | Washington, DC | 4.85 |
| 10 | Monterey, CA | 4.3 | 10 | Sacramento, CA | 4.85 |
| U.S. metropolitan area average |
1.8 | U.S. metropolitan area average |
2.18 | ||
Considering hybrid sales between January 2010 through September 2011, the top selling metropolitan region was the San Francisco Bay Area, with 8.4% of all new cars sold during that period, followed by Monterey-Salinas with 6.9%, and Eugene, Oregon, with 6.1%. The following seven top selling markets are also on the West Coast, including Seattle-Tacoma and Los Angeles with 5.7%, San Diego with 5.6%, and Portland with 5.4%. The Washington D.C. Metro Area, with 4.2%, is the next best selling region out of the West Coast.[31]
Historical sales by model (1999-2014)[]
This section needs to be updated. (January 2019) |
The following table presents historical hybrid sales figures by vehicle model in the United States since 1999 through December 30, 2014, in order of total historical sales from 1999 to 2014.[6][7][4][5] Family of vehicles sharing nameplate/marque (i.e. Toyota Prius) or exactly the same powertrain (i.e. Ford Fusion Hybrid and Lincoln MKZ Hybrid) are grouped together.
| Annual hybrid electric vehicle sales in the United States by model between 1999 and 2014 | |||||||||||||||||
|---|---|---|---|---|---|---|---|---|---|---|---|---|---|---|---|---|---|
| Vehicle | 1999 | 2000 | 2001 | 2002 | 2003 | 2004 | 2005 | 2006 | 2007 | 2008 | 2009 | 2010 | 2011 | 2012 | 2013 | 2014 | Total 1999-2014 |
| Toyota Prius Prius c Prius v |
5,562 | 15,556 | 20,119 | 24,600 | 53,991 | 107,897 | 106,971 | 181,221 | 158,574 | 139,682 | 140,928 | 136,463(2) | 147,503 | 145,172 | 122,776 | 1,498,616 | |
| 35,733 | 41,979 | 40,570 | 118,282 | ||||||||||||||
| 40,669 | 34,989 | 30,762 | 114,819 | ||||||||||||||
| 223,905 | 222,140 | 194,108 | 1,731,717 | ||||||||||||||
| Toyota Camry | 31,341 | 54,477 | 46,272 | 22,887 | 14,587 | 9,241 | 45,656 | 44,448 | 39,515 | 308,424 | |||||||
| Honda Civic | 13,700 | 21,800 | 25,571 | 25,864 | 31,251 | 32,575 | 31,297 | 15,119 | 7,336 | 4,703 | 7,156 | 7,719 | 5,070 | 229,161 | |||
| Ford Fusion Lincoln MKZ Mercury Milan |
15,554 0 1,468 |
20,816 1,192 1,416 |
11,286 5,739 0 |
14,100 6,067 0 |
37,270 7,469 0 |
35,405 10,033 0 |
134,431 30,500 2,884 | ||||||||||
| 17,022 | 23,424 | 17,025 | 20,167 | 44,739 | 45,438 | 167,815 | |||||||||||
| Lexus RX400h/450h | 20,674 | 20,161 | 17,291 | 15,200 | 14,464 | 15,119 | 10,723 | 12,223 | 11,307 | 9,351 | 146,513 | ||||||
| Ford Escape Mercury Mariner |
2,993 0 |
18,797 998 |
20,149 3,174 |
21,386 3,722 |
17,173 2,329 |
14,787 1,693 |
11,182 890 |
10,089 0 |
1,441 0 |
0 0 |
0 0 |
117,997 12,806 | |||||
| 2,993 | 19,795 | 23,323 | 25,108 | 19,502 | 16,480 | 12,072 | 10,089 | 1,441 | 0 | 0 | 130,803 | ||||||
| Toyota Highlander | 17,989 | 31,485 | 22,052 | 19,441 | 11,086 | 7,456 | 4,549 | 5,291 | 5,070 | 3,621 | 128,040 | ||||||
| Hyundai Sonata Kia Optima |
19,672(2) | 20,754 | 21,761 | 21,052 | 83,240 | ||||||||||||
| 10,084 | 13,919 | 13,776 | 37,779 | ||||||||||||||
| 30,838 | 35,680 | 34,828 | 121,019 | ||||||||||||||
| Honda Insight | 17 | 3,788 | 4,726 | 2,216 | 1,200 | 583 | 666 | 722 | 0 | 0 | 20,572 | 20,962 | 15,549 | 5,846 | 4,802 | 3,965 | 85,614 |
| Lexus CT 200h | 14,381 | 17,671 | 15,071 | 17,673 | 64,796 | ||||||||||||
| Ford C-Max Hybrid | 10,935 | 28,056 | 19,162 | 58,153 | |||||||||||||
| Honda Accord | 1,061 | 16,826 | 5,598 | 3,405 | 196 | 0 | 0 | 0 | 0 | 979 | 13,977 | 42,042 | |||||
| Chevrolet Malibu | 2,093 | 4,162 | 405 | 24 | 16,664 | 13,779 | 1,018 | 38,145 | |||||||||
| Nissan Altima | 8,388 | 8,819 | 9,357 | 6,710 | 3,236 | 103 | 0 | 0 | 36,613 | ||||||||
| Lexus ES 300h | 7,041 | 16,562 | 14,837 | 38,440 | |||||||||||||
| Toyota Avalon | 747 | 16,468 | 17,048 | 34,263 | |||||||||||||
| Honda CR-Z | 5,249 | 11,330 | 4,192 | 4,550 | 3,562 | 28,883 | |||||||||||
| Buick LaCrosse eAssist | 1,801 | 12,010 | 7,133 | 7,353 | 28,297 | ||||||||||||
| Lexus HS 250h | 6,699 | 10,663 | 2,864 | 649 | 5 | 0 | 20,880 | ||||||||||
| Chevy Tahoe GMC Yukon |
3,745 1,610 |
3,300 1,933 |
1,426 1,221 |
519 598 |
533 560 |
376 288 |
65 31 |
9,964 6,241 | |||||||||
| 5,355 | 5,233 | 2,647 | 1,117 | 1,093 | 664 | 96 | 16,205 | ||||||||||
| Saturn Vue | 4,403 | 2,920 | 2,656 | 50 | 0 | 0 | 0 | 0 | 10,029 | ||||||||
| Subaru XV Crosstrek Hybrid | 7,926 | 7,926 | |||||||||||||||
| Volkswagen Jetta Hybrid | 162 | 5,655 | 1,939 | 7,756 | |||||||||||||
| Lexus GS 450h | 1,784 | 1,645 | 678 | 469 | 305 | 282 | 607 | 522 | 183 | 6,475 | |||||||
| Chevrolet Silverado GMC Sierra |
1,598 0 |
2,393 0 |
1,165 0 |
469 471 |
104 65 |
5,729 536 | |||||||||||
| 940 | 169 | 30 | 6,295 | ||||||||||||||
| Cadillac Escalade | 801 | 1,958 | 1,210 | 819 | 708 | 372 | 41 | 5,909 | |||||||||
| Buick Regal eAssist | 123 | 2,654 | 2,893 | 662 | 6,332 | ||||||||||||
| Porsche Cayenne | 206 | 1,571 | 1,180 | 615 | 650 | 4,222 | |||||||||||
| Infiniti Q50 | 307 | 3,456 | 3,763 | ||||||||||||||
| Nissan Pathfinder Hybrid | 334 | 2,480 | 2,814 | ||||||||||||||
| Acura ILX | 972 | 1,461 | 379 | 2,812 | |||||||||||||
| Lexus LS600hL | 937 | 907 | 258 | 129 | 84 | 54 | 115 | 65 | 2,549 | ||||||||
| Infiniti QX60 Hybrid | 676 | 1,678 | 2,354 | ||||||||||||||
| Infiniti M35h/Q70 | 378 | 691 | 475 | 180 | 1,724 | ||||||||||||
| Saturn Aura | 772 | 285 | 527 | 54 | 0 | 0 | 0 | 0 | 1,638 | ||||||||
| BMW ActiveHybrid 3 | 402 | 905 | 151 | 1,458 | |||||||||||||
| Audi Q5 Hybrid | 270 | 854 | 283 | 1,407 | |||||||||||||
| Mercedes-Benz S400 | 801 | 309 | 121 | 64 | 10 | 1,305 | |||||||||||
| Mazda Tribute | 570 | 484 | 90 | 0 | 0 | 1,144 | |||||||||||
| BMW ActiveHybrid 5 | 404 | 520 | 112 | 1,036 | |||||||||||||
| Volkswagen Touareg Hybrid | 390 | 250 | 118 | 30 | 788 | ||||||||||||
| Porsche Panamera S | 52 | 570 | 164 | 0 | 786 | ||||||||||||
| BMW ActiveHybrid 7 | 102 | 338 | 231 | 31 | 45 | 747 | |||||||||||
| Mercedes-Benz ML450 | 627 | 1 | 20 | 11 | 20 | 679 | |||||||||||
| Chevrolet Impala eAssist | 56 | 565 | 621 | ||||||||||||||
| Mercedes-Benz E400 Hybrid | 282 | 158 | 440 | ||||||||||||||
| Lexus NX Hybrid | 354 | 354 | |||||||||||||||
| BMW ActiveHybrid X6 | 205 | 43 | 4 | 0 | 0 | 252 | |||||||||||
| Acura RLX Hybrid | 133 | 133 | |||||||||||||||
| Chrysler Aspen | 46 | 33 | 0 | 0 | 0 | 0 | 0 | 79 | |||||||||
| Dodge Durango | 9 | 0 | 0 | 0 | 0 | 0 | 9 | ||||||||||
| All hybrids sold | 17 | 9,350 | 20,282 | 36,035 | 47,600 | 84,199 | 209,711 | 252,636 | 352,274 | 312,386 | 290,271 | 274,210 | 268,752 | 434,498 | 495,771 | 452,152 | 3,540,199 |
| New car sales (millions)[4][5][32][33] |
16.043 | 15.869 | 14.646 | 15.067 | 14.754 | 15.012 | 14.966 | 14.264 | 13.819 | 13.195 | 10.402 | 11.589 | 12.734 | 14.442 | 15.531 | 16.435 | 228.766 |
| Hybrid market share | 0.0001% | 0.06% | 0.14% | 0.24% | 0.32% | 0.56% | 1.40% | 1.77% | 2.55% | 2.37% | 2.79% | 2.37% | 2.11% | 3.01% | 3.19% | 2.75% | 1.55% |
| Notes: (1) Sources: 2011, 2012 and 2013 HybridCars.com,[7][8][4] all other figures from Alternative Fuels and Advanced Vehicle Data Center (U.S. DoE).[6] (2) For 2011 Toyota reported consolidated figures for the Prius family, therefore during 2011, sales of the Toyota Prius v, which began sales by mid October 2011, were reported together with the conventional Prius liftback. The figure breaks down in 128,064 conventional Prius and 8,399 Prius v. During 2011, sales of the Kia Optima Hybrid were reported together with the Hyundai Sonata.[7][8] | |||||||||||||||||
Top sales by model (2019)[34][]
92,525 	Toyota RAV4
49,603 	Ford Fusion & Milan
47,862 	Toyota Prius
26,043 	Toyota Camry
23,817 	Honda Accord
23,686 	Honda Insight
18,336 	Kia Niro
18,248 	Toyota Highlander
16,299 	Toyota Corolla
16,116 	Lexus RX 450h
15,558 	Hyundai Ioniq Hybrid
9,649 	Lexus NX Hybrid
8,608 	Lexus  ES Hybrid
8,603 	Lexus UX
6,552 	Toyota Avalon
Over 50% of hybrids sold in the US in 2019 are the six Toyota models. Since Toyota has introduced two new hybrid SUVs, the Toyota Venza and the Toyota Sienna hybrids.
Toyota hybrid sales 2020 (percent of all sales of this model that are alternative fuels)
SUVs
- 115,974 TOYOTA RAV4 HYBRID 26.9%
- 48,455 TOYOTA HIGHLANDER HYBRID 22.8%
- 13,073 TOYOTA VENZA HYBRID 100.0%
- 9,690 TOYOTA SIENNA HYBRID 45.5%
- 3,200 TOYOTA RAV4 PRIME 0.7%
- 190,392 22.7%
cars
- 43,525 TOYOTA PRIUS HYBRID 100.0%
- 33,826 TOYOTA CAMRY HYBRID 11.5%
- 17,628 TOYOTA COROLLA HYBRID 15.1%
- 6,714 TOYOTA AVALON HYBRID 36.4%
- 499 TOYOTA MIRAI 100.0%
- 102,192 16.8%
Economical and environmental performance comparison[]
This section needs to be updated. (January 2019) |


among hybrid models sold in the U.S. (models 2009-2016)[35][36]
| Vehicle | Year model |
EPA City mileage (mpg) |
EPA Highway mileage (mpg) |
Tailpipe emissions (grams per mile CO2) |
EPA Air Pollution Score(1) |
Annual Petroleum Use (barrel) | |
|---|---|---|---|---|---|---|---|
| Ford Explorer Hybrid[37] | 2020 | 27 | 29 | 322 | 6/10 | 11.8 | |
| Ford Escape Hybrid (4th gen)[38] | 2020 | 44 | 37 | 224 | 9/10 | 8.2 | |
| Toyota Prius Eco (4th gen)[39] | 2016 | 58 | 53 | 158 | 7/8* | 6.6 | |
| Toyota Prius (4th gen)[39] | 2016 | 54 | 50 | 170 | 10* | 5.9 | |
| Toyota Prius c | 2012/16 | 53 | 46 | 178 | 10* | 6.3 | |
| Toyota Prius (3rd gen) | 2010/15 | 51 | 48 | 178 | 8/9* | 6.6 | |
| Honda Accord (2nd gen) | 2014/15 | 50 | 45 | 188 | NA | 7.0 | |
| Toyota Prius (2nd gen) | 2009 | 48 | 45 | 193 | 8/9* | 7.2 | |
| Honda Civic Hybrid (3rd gen) | 2014/15 | 45 | 47 | 196 | 10/9 | 7.3 | |
| Honda Civic Hybrid (3rd gen) | 2012/13 | 44 | 44 | 202 | 7/8 | 7.5 | |
| Volkswagen Jetta Hybrid | 2013/16 | 42 | 48 | 200 | 9/9* | 7.3 | |
| Ford Fusion (2nd gen) | 2013/16 | 44 | 41 | 209 | 7/9* | 7.8 | |
| Toyota Prius v | 2012/16 | 44 | 40 | 212 | 7/8* | 7.8 | |
| Lexus CT 200h | 2011/16 | 43 | 40 | 212 | 7/8* | 7.8 | |
| Honda Insight (2nd gen) | 2012/14 | 41 | 44 | 212 | 7/8 | 7.8 | |
| 2010/11 | 40 | 43 | 217 | 7/8 | 8.0 | ||
| Honda Civic Hybrid (2nd gen) | 2011 | 40 | 43 | 217 | 8 | 8.0 | |
| 2009/10 | 40 | 45 | 212 | 9 | 7.8 | ||
| Hyundai Sonata Hybrid SE | 2016 | 40 | 44 | 215 | 9 | 7.8 | |
| Toyota Camry Hybrid LE (XV50) Toyota Camry Hybrid XLE (XV50) |
2012/16 | 43 | 39 | 217 | 7/9* | 8.0 | |
| 40 | 38 | 222 | 7/9* | 8.2 | |||
| Lexus ES 300h | 2013/16 | 40 | 39 | 222 | 7/8* | 8.2 | |
| Toyota Avalon Hybrid | 2013/16 | 40 | 39 | 224 | 7/8* | 8.2 | |
| Ford C-Max Hybrid | 2013/16 | 42 | 37 | 225 | 7/9* | 8.2 | |
| Ford Fusion Hybrid Mercury Milan Hybrid Lincoln MKZ Hybrid |
2010/12 | 41 | 36 | 228 | 7 | 8.4 | |
| 2010/11 | 41 | 36 | 228 | 7 | 8.4 | ||
| 2011/12 | 41 | 36 | 228 | 7 | 8.4 | ||
| Lincoln MKZ Hybrid (2nd gen) | 2013/14 | 38 | 37 | 233 | 7/9 | 8.7 | |
| Acura ILX Hybrid | 2013/14 | 39 | 38 | 234 | 7/9* | 8.7 | |
| Hyundai Sonata Hybrid Kia Optima Hybrid |
2013/15 | 36 | 40 | 237 | 9 | 8.7 | |
| 2011/12 | 34 | 39 | 212 | 9 | 9.1 | ||
| Hyundai Sonata Hybrid Limited Kia Optima Hybrid EX |
2013/15 | 36 | 40 | 239 | 8 | 8.9 | |
| 2011/12 | 35 | 39 | 242 | 8 | 8.9 | ||
| Honda CR-Z CVT | 2013/15 | 36 | 39 | 238 | 8/9* | 8.9 | |
| 2011/12 | 35 | 39 | 240 | 8/9* | 8.9 | ||
| Lexus HS 250h | 2010/12 | 35 | 34 | 254 | 7/8* | 9.4 | |
| Honda CR-Z Manual 6 spd | 2013/16 | 31 | 38 | 261 | 9/9* | 9.7 | |
| 2011/12 | 31 | 37 | 261 | 9/9* | 9.7 | ||
| Nissan Altima Hybrid | 2009/10 | 35 | 33 | 261 | 9.0* | 9.7 | |
| 2011 | 33 | 33 | 269 | 9* | 10.0 | ||
| Toyota Camry Hybrid (XV40) | 2009/10 | 33 | 34 | 261 | 7 | 9.7 | |
| 2011 | 31 | 35 | 269 | 7 | 10.0 | ||
| Lexus NX 300h | 2015/16 | 35 | 31 | 270 | 8 | 10.0 | |
| Toyota RAV4 Hybrid AWD | 2016 | 34 | 31 | 270 | 8 | 10.0 | |
| Ford Escape Hybrid FWD(2) Ford Escape Hybrid 4WD |
2010/12 | 34 | 31 | 278 | 7 | 10.3 | |
| 2010/12 | 30 | 27 | 306 | 7 | 11.4 | ||
| Infiniti Q50 | 2014/15 | 29 | 36 | 286 | 6 | 10.6 | |
| Lexus GS 450h | 2013/16 | 29 | 34 | 283 | 8 | 10.6 | |
| Lexus RX 450h Lexus RX 450h AWD |
2010/15 | 32 | 28 | 297 | 6 | 11 | |
| 2014/16 | 30 | 28 | 309 | NA | 11.4 | ||
| Infiniti M35h Infiniti M35h AWD |
2012/13 | 27 | 32 | 306 | 6 | 11.4 | |
| Chevrolet Malibu eAssist Chevrolet Malibu Hybrid |
2013/14 | 25 | 37 | 305 | 5 | 11.4 | |
| 2009/10 | 26 | 34 | 306 | 5 | 11.4 | ||
| Buick Regal eAssist Buick LaCrosse eAssist |
2012/13 | 25 | 36 | 305 | 5 | 11.4 | |
| Buick Regal eAssist Buick LaCrosse eAssist |
2014 | 25 | 36 | 308 | 5/8 | 11.4 | |
| Chevrolet Impala eAssist | 2013/14 | 25 | 35 | 308 | 5/8 | 11.4 | |
| Toyota Highlander Hybrid 4WD | 2011/16 | 28 | 28 | 317 | 8 | 11.8 | |
| 2009/10 | 27 | 25 | 342 | 8 | 12.7 | ||
| Saturn Vue Hybrid 6 cyl, 3.6L Saturn Vue Hybrid 4 cyl, 2.4 L |
2009 | 27 | 30 | 317 | NA | 11.8 | |
| 2009/10 | 25 | 32 | 317 | 6 | 11.8 | ||
| BMW ActiveHybrid 3 | 2013/15 | 25 | 33 | 313 | 6 | 11.8 | |
| Mercedes-Benz E400 Hybrid | 2013/15 | 24 | 30 | 336 | 9/9 | 12.7 | |
| Audi Q5 Hybrid | 2013/16 | 24 | 30 | 337 | 6/6 | 12.7 | |
| BMW ActiveHybrid 5 | 2013/16 | 23 | 30 | 346 | 6 | 12.7 | |
| BMW ActiveHybrid 7/7L | 2013/15 | 22 | 30 | 350 | 6 | 13.2 | |
| 2011/12 | 17 | 24 | 444 | 6 | 16.5 | ||
| Porsche Panamera S Hybrid | 2012/13 | 22 | 30 | 364 | 6 | 13.2 | |
| Lexus GS 450h | 2009/11 | 22 | 25 | 386 | 7 | 14.3 | |
| Mercedes-Benz ML450 | 2010/11 | 20 | 24 | 404 | 8 | 15.0 | |
| Porsche Cayenne S Hybrid | 2011/14 | 20 | 24 | 413 | 6 | 15.7 | |
| VW Touareg Hybrid | 2011/15 | 20 | 24 | 413 | 6 | 15.7 | |
| Mercedes-Benz S400 | 2010/13 | 19 | 25 | 414 | 9 | 15.7 | |
| Cadillac Escalade Hybrid 2WD/4WD Cadillac Escalade Hybrid 2WD Cadillac Escalade Hybrid 2WD |
2011 to 2013 | 20 | 23 | 415 | 6 | 15.7 | |
| 2010 | 21 | 22 | 404 | NA | 15.0 | ||
| 2009 | 20 | 21 | 444 | 5 | 16.5 | ||
| Dodge Durango HEV 4WD | 2009 | 20 | 22 | 423 | NA | 15.7 | |
| Chevrolet Silverado Hybrid 2WD Chevrolet Silverado Hybrid 4WD Chevrolet Tahoe Hybrid 2WD GMC Sierra Hybrid 2WD GMC Yukon Hybrid2WD Silverado/Tahoe/Sierra/Yukon 4WD |
2009 | 21 | 22 | 423 | 5 | 15.7 | |
| 2009 | 20 | 20 | 444 | 5 | 16.5 | ||
| 2010 | 21 | 22 | 404 | 5 | 15.0 | ||
| 2011 to 2013 | 20 | 23 | 418 | 6 | 15.7 | ||
| 2011 to 2013 | 20 | 23 | 423 | 6 | 15.7 | ||
| Lexus LS 600h L | 2009/10 | 20 | 22 | 423 | 8 | 15.7 | |
| 2011 to 2013 | 19 | 23 | 444 | 8 | 16.5 | ||
| BMW ActiveHybrid X6 | 2011 | 17 | 19 | 494 | 5/6 | 18.3 | |
| Source: U.S. Department of Energy and U.S. Environmental Protection Agency[35] Notes: (1) All states except California and Northeastern states, * otherwise. (2) Performance is the same for the Mazda Tribute Hybrid 2WD and the Mercury Mariner Hybrid 2WD. | |||||||
See also[]
- Alternative fuel vehicle
- Comparison of Toyota hybrids
- Electric car
- Flexible-fuel vehicles in the United States
- Green vehicle
- Government incentives for fuel efficient vehicles in the United States
- Hydrogen vehicle
- Plug-in electric vehicle
- Plug-in electric vehicles in California
- Plug-in electric vehicles in the United States
- Plug-in hybrid
References[]
- ^ Jump up to: a b c d Stacy C. Davis; Robert G. Boundy (April 2021). "Transportation Energy Data Book: Edition 39 (updated April 2021)" (PDF). Oak Ridge National Laboratory, Office of Energy Efficiency and Renewable Energy, U.S. Department of Energy. Retrieved 2021-05-17. See Table 6.2: Hybrid and Plug-In Vehicle Sales, 1999-2020
- ^ "Hybrids account for nearly 20 percent of cars in Japan, automobile association says". The Japan Times. 2018-10-27. Retrieved 2018-12-15.
- ^ Jump up to: a b c d e f g h i j k l m Cobb, Jeff (2016-06-06). "Americans Buy Their Four-Millionth Hybrid Car". HybridCars.com. Retrieved 2016-06-06.
- ^ Jump up to: a b c d e f g h i j k l m n o p Jeff Cobb (2015-01-06). "December 2013 Dashboard". HybridCars.com and Baum & Associates. Retrieved 2014-01-06.
- ^ Jump up to: a b c d e f g h i j k l m n o Jeff Cobb (2015-01-06). "December 2014 Dashboard". HybridCars.com and Baum & Associates. Retrieved 2015-01-22.
- ^ Jump up to: a b c d e f g "U.S. HEV sales by Model (1999-2013)". Alternative Fuels and Advanced Vehicle Data Center (U.S. DoE). Retrieved 2015-01-18. Click on the graph to show sales by model and year total. Source: HybridCars.com)
- ^ Jump up to: a b c d e f g h "December 2011 Dashboard: Sales Still Climbing". HybridCARS.com. 2012-01-09. Archived from the original on 2012-01-12. Retrieved 2012-01-10.
- ^ Jump up to: a b c d e f g h i j k Jeff Cobb (2013-04-22). "December 2012 Dashboard". HybridCars.com and Baum & Associates. Retrieved 2013-09-10. See the section: December 2012 Hybrid Cars Numbers. A total of 434,498 hybrid electric vehicles were sold during 2012. Ford sold 32,543 hybrids in the U.S. during 2012, including 14,100 Ford Fusion Hybrids, 10,935 C-Max Hybrids, 6,067 Lincoln MKZ Hybrids, and 1,441 Ford Escape Hybrids.
- ^ Jump up to: a b c Cobb, Jeff (2016-05-04). "April 2016 Dashboard". HybridCars.com and Baum & Associates. Retrieved 2016-06-06.
- ^ Jump up to: a b c d Cobb, Jeff (2016-01-06). "December 2015 Dashboard". HybridCars.com and Baum & Associates. Retrieved 2016-06-05. Hybrid car sales totaled 384,404 units in 2015.
- ^ Jump up to: a b c d e f g h i "December 2009 Dashboard: Year-End Tally". hybridCars.com. 2010-01-20. Archived from the original on 2010-01-22. Retrieved 2010-09-13.
- ^ Jump up to: a b "February 2009 Hybrid Market Dashboard" (PDF). hybridCars.com. 2009-03-13. Retrieved 2010-03-15.
- ^ Jump up to: a b "February 2008 Hybrid Market Dashboard" (PDF). hybridCars.com. 2008-03-14. Retrieved 2010-03-15.
- ^ Jump up to: a b Greg Asciutto (2013-09-25). "Santa Monica a top city for electric vehicles". Santa Monica Daily Press. Retrieved 2013-09-29.
- ^ Jump up to: a b Jaclyn Trop (2013-09-20). "Santa Monica Bets on Electric Cars, but Consumers Are Slow to Switch". The New York Times. Retrieved 2013-09-29.
- ^ Scott Doggett (2010-11-23). "Obama Administration Buys Nearly 1 in 4 Hybrids as Consumer Market Slumps". Edmunds.com. Archived from the original on 2010-11-28. Retrieved 2011-02-05.
- ^ Cobb, Jeff (2018-01-04). "December 2017 Dashboard". HybridCars.com and Baum & Associates. Retrieved 2018-02-03. Sales figures for 2016 and 2017 are reported.
- ^ Jump up to: a b c d e Stacy C. Davis & Robert G. Boundy (April 2020). "Transportation Energy Data Book: Edition 38.1" (PDF). Oak Ridge National Laboratory, Office of Energy Efficiency and Renewable Energy, U.S. Department of Energy. Retrieved 2020-05-14. See Tables 6.1 (annual sales of HEVs and PHEVs) 6.2 for 2018 and 2019 HEV market shares (the complete historical series from 1999 to 2019 is available)
- ^ Christie Schweinsberg (2011-06-07). "U.S. Hybrid Sales Hit 2 Million Mark". Ward's. Archived from the original on 2013-07-29. Retrieved 2011-06-07.
- ^ Jeff Cobb (2013-11-04). "Americans Buy Their 3,000,000th Hybrid". HybridCars.com. Retrieved 2013-11-04.
- ^ "Toyota sells One-Millionth Prius in the US". Green Car Congress. 2011-04-06. Retrieved 2011-04-07.
- ^ Jump up to: a b "Worldwide Sales of Toyota Hybrids Surpass 9 Million Units" (Press release). Toyota City, Japan: Toyota. 2016-05-20. Retrieved 2016-06-05.
- ^ Jerry Hirsch (2013-01-22). "Toyota Prius topples Honda Civic as bestselling car in California". Los Angeles Times. Retrieved 2013-01-22. The sales figure includes the Prius liftback, Prius v, Prius c and Prius PHV.
- ^ Bloomberg (2014-02-13). "Toyota Prius keeps Calif. sales crown; Tesla moves up". Automotive News. Retrieved 2014-02-16.
- ^ California New Car Dealers Association (CNCDA) (February 2014). "California Auto Outlook: Fourth Quarter 2013". CNCDA. Archived from the original on 2014-02-17. Retrieved 2014-02-16.
- ^ Jerry Hirsch (2014-02-15). "California auto buyers favor Toyota Prius; rest of U.S. prefers trucks". Los Angeles Times. Retrieved 2014-02-16.
- ^ Craig Trudell (2013-12-30). "Ford Widens U.S. Sales Lead Over Toyota on Hybrid Models". Bloomberg News. Retrieved 2014-05-01.
- ^ PR Newswire (2013-07-23). "Ford Delivers Best Hybrid Sales Quarter Ever; Grows Its Market Share and Attracts New Customers to the Brand". Market Watch. Retrieved 2013-08-30.
- ^ "December 2008 Dashboard: The Key Is Production Numbers". hybridCars.com. 2009-01-13. Archived from the original on 2009-03-01. Retrieved 2010-03-13.
- ^ Sara Carothers and Alyson Hurt (2011-11-22). "Map: Hybrid And Electric Sales Across The Country". National Public Radio. Retrieved 2012-02-02.
- ^ "BTS | Table 1-12: U.S. Sales or Deliveries of New Aircraft, Vehicles, Vessels, and Other Conveyances". Bts.gov. Archived from the original on 2006-09-24. Retrieved 2010-12-12.
- ^ "Archived copy" (PDF). Archived from the original (PDF) on 2011-07-19. Retrieved 2010-03-29.CS1 maint: archived copy as title (link)
- ^ "Alternative Fuels and Advanced Vehicle Data Center (U.S. DoE)".
- ^ Jump up to: a b "Hybrid Vehicles: Compare side-by-side". U.S. Department of Energy and U.S. Environmental Protection Agency. Retrieved 2014-06-12. Click on 2009, 2010, 2011, 2012, 2013 and 2014 models. See also here [1]
- ^ United States Environmental Protection Agency and U.S. Department of Energy (2015-12-18). "Model Year 2016 Fuel Economy Guide - Electric vehicles & Plug-in Hybrid Electric Vehicles" (PDF). fueleconomy.gov. Retrieved 2015-12-18. See pp. 27-28 for all-electric vehicles and pp. 30-31 for plug-in hybrid electric vehicles. The average 2016 vehicle gets 25 mpg
- ^ "2020 Ford Explorer HEV RWD". fueleconomy.gov. Retrieved 2020-08-13.
- ^ "2020 Ford Escape AWD HEV". fueleconomy.gov. Retrieved 2020-08-13.
- ^ Jump up to: a b U. S. Environmental Protection Agency and U.S. Department of Energy (2015-12-18). "Compare Side-by-Side - 2015 Toyota Prius, 2016 Toyota Prius and 2016 Toyota Prius Eco". Fueleconomy.gov. Retrieved 2015-12-18.
External links[]
- 2013 VehicleTechnologies Market Report, Oak Ridge National Laboratory
- Clean Car Calculator (Institute for Energy Efficiency)
- Clean Cities - 2014 Vehicle Buyer's Guide, National Renewable Energy Laboratory (NREL), U.S. Department of Energy, December 2013.
- EPA Green Vehicle Guide
- EPA's hybrids' payback time comparison
- Every 2014 And 2015 Hybrid Car In The U.S.: Ultimate Guide, Green Car Reports, August 2014.
- Hybrid Analysis - Total Cost of Ownership for 2017 model year hybrids, Vincentric, August 2018.
- Light Duty Electric Drive Vehicles Monthly Sales Updates, Argonne National Laboratory
- Model Year 2017 Fuel Economy Guide, U.S. Environmental Protection Agency and U.S. Department of Energy, July 2018 (see pp. 40–41 for hybrid models).
- Top Ten EPA-Rated Fuel Sippers (2018) - including BEVs and PHEVs
- UCS Hybrid Scorecard (Union of Concerned Scientists)
- U.S. HEV Sales by Model, Alternative Fuels and Advanced Vehicle Data Center, U.S. Department of Energy
- Hybrid electric vehicles
- Electric vehicles
- Road transportation in the United States