Plug-in electric vehicles in the United States

The adoption of plug-in electric vehicles in the United States is supported by the American federal government, and several states and local governments. As of September 2021, cumulative sales in the U.S. totaled 2.13 million highway legal plug-in electric cars since 2010,[4] led by all-electric cars.[5] The American stock represented 20% of the global plug-in car fleet in use by the end of 2019, and the U.S. had the world's third largest stock of plug-in passenger cars after China (47%) and Europe (25%).[6]
The U.S. market share of plug-in electric passenger cars increased from 0.14% in 2011, to 0.66% in 2015,[7][8] to 1.13% in 2017, and achieved a record take rate of 2.1% in 2018, but slightly declined to 1.9% in 2019.[9][10][11] California is the largest plug-in car regional market in the country, with almost 835,000 plug-in electric vehicles sold by the end of 2020.[12][13]
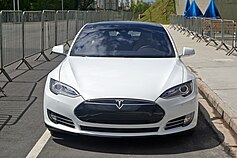
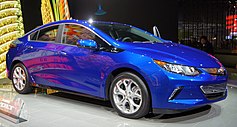
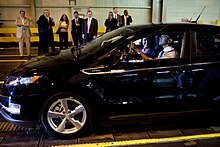
As of December 2020, the Tesla Model 3 all-electric car is the all-time best selling plug-in electric car with an estimated 395,600 units delivered, followed by the Tesla Model S electric car with about 172,400, and the Chevrolet Volt plug-in hybrid with 157,125 units of both generations.[1][2][3] The Model S was the best selling plug-in car in the U.S. for three consecutive years, from 2015 to 2017,[14][15] and the Model 3 also has topped sales for three years running, from 2018 to 2020.[2][16][17]
The Energy Improvement and Extension Act of 2008 granted federal tax credits for new qualified plug-in electric vehicles, which is worth between US$2,500 and US$7,500 depending on battery capacity.[18] As of 2014, Washington, D.C. and 37 states and had established incentives and tax or fee exemptions for BEVs and PHEVs, or utility-rate breaks, and other non-monetary incentives such as free parking and high-occupancy vehicle lane access.[19]
Government support[]
In his 2011 State of the Union address, President Barack Obama set the goal for the U.S. to become the first country to have one million electric vehicles on the road by 2015.[20] This goal was established based on forecasts made by the U.S. Department of Energy (DoE), using production capacity of PEV models announced to enter the U.S. market through 2015. The DoE estimated a cumulative production of 1,222,200 PEVS by 2015, and was based on manufacturer announcements and media reports accounting production goals for the Fisker Karma, Fisker Nina, Ford Transit Connect, Ford Focus Electric, Chevrolet Volt, Nissan Leaf, Smith Newton, Tesla Roadster, Tesla Model S and Th!nk City.[21]
Considering that actual PEV sales were lower than initially expected, as of early 2013, several industry observers have concluded that this goal was unattainable.[22][23][24][25] Obama's goal was achieved only in September 2018.[26][27]

In 2008, San Francisco Mayor Gavin Newsom, San Jose Mayor Chuck Reed and Oakland Mayor Ron Dellums announced a nine-step policy plan for transforming the Bay Area into the "Electric Vehicle (EV) Capital of the U.S.".[28] Other local and state governments have also expressed interest in electric cars.[29]
Governor of California Jerry Brown issued an executive order in March 2012 that established the goal of getting 1.5 million zero-emission vehicles (ZEVs) on California roads by 2025.[30][31][32]
American Recovery and Reinvestment Act[]
President Barack Obama pledged US$2.4 billion in federal grants to support the development of next-generation electric vehicles and batteries.[33][34] $1.5 billion in grants to U.S. based manufacturers to produce highly efficient batteries and their components; up to $500 million in grants to U.S. based manufacturers to produce other components needed for electric vehicles, such as electric motors and other components; and up to $400 million to demonstrate and evaluate plug-in hybrids and other electric infrastructure concepts—like truck stop charging station, electric rail, and training for technicians to build and repair electric vehicles (green collar jobs).[35]
In March 2009, as part of the American Recovery and Reinvestment Act, the U.S. Department of Energy announced the release of two competitive solicitations for up to $2 billion in federal funding for competitively awarded cost-shared agreements for manufacturing of advanced batteries and related drive components as well as up to $400 million for transportation electrification demonstration and deployment projects. This initiative aimed to help meet President Barack Obama's goal of putting one million plug-in electric vehicles on the road by 2015.[20][36]
Tax credits[]
New plug-in electric vehicles[]
Federal incentives[]

First the Energy Improvement and Extension Act of 2008, and later the American Clean Energy and Security Act of 2009 (ACES) granted tax credits for new qualified plug-in electric drive motor vehicles.[18] The American Recovery and Reinvestment Act of 2009 (ARRA) also authorized federal tax credits for converted plug-ins, though the credit is lower than for new plug-in electric vehicle (PEV).[37]
As defined by the 2009 ACES Act, a PEV is a vehicle which draws propulsion energy from a traction battery with at least 5 kwh of capacity and uses an offboard source of energy to recharge such battery.[18] The tax credit for new plug-in electric vehicles is worth US$2,500 plus US$417 for each kilowatt-hour of battery capacity over 5 kwh, and the portion of the credit determined by battery capacity cannot exceed US$5,000. Therefore, the total amount of the credit, between US$2,500 and US$7,500, will vary depending on the capacity of the battery (4 to 16 kWh) used to power the vehicles.[38]
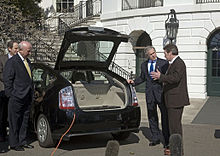
The qualified plug-in electric vehicle credit phases out for a plug-in manufacturer over the one-year period beginning with the second calendar quarter after the calendar quarter in which at least 200,000 qualifying plug-in vehicles from that manufacturer have been sold for use in the U.S. Cumulative sales started counting sales after December 31, 2009. After reaching the cap, qualifying PEVs for one quarter still earn the full credit, the second quarter after that quarter plug-in vehicles are eligible for 50% of the credit for six months, then 25% of the credit for another six months and finally the credit is phased out.[18] Both the Nissan Leaf electric vehicle and the Chevrolet Volt plug-in hybrid, launched in December 2010, are eligible for the maximum $7,500 tax credit.[39] The Toyota Prius Plug-in Hybrid, released in January 2012, is eligible for a US$2,500 tax credit due to its smaller battery capacity of 5.2 kWh.[40] All Tesla cars and the Chevrolet Bolts and BMW i3 BEV are eligible for the US$7,500 tax credit.
A 2016 study conducted by researchers from the University of California, Davis found that the federal tax credit was the reason behind more than 30% of the plug-in electric sales. The impact of the federal tax incentive is higher among owners of the Nissan Leaf, with up to 49% of sales attributable to the federal incentive. The study, based on a stated preference survey of more than 2,882 plug in vehicle owners in 11 states, also found that the federal tax credit shifts buyers from internal combustion engine vehicles to plug-in vehicles and advances the purchase timing of new vehicles by a year or more.[41]
In July 2018, Tesla Inc. was the first plug-in manufacturer to pass 200,000 sales and the full tax credit will be available until the end 2018, with the phase out beginning in January 2019.[42] General Motors combined sales of plug-in electric vehicles passed 200,000 units in November 2018. The full tax credit will be available until the end of March 2019 and thereafter reduces gradually until it is completely phase out beginning on April 1, 2020.[43][44] In order of cumulative sales, as of November 2018, Nissan has delivered 126,875 units, Ford 111,715, Toyota 93,011 and the BMW Group 79,679 plug-in electric cars.[45]
State incentives[]

As of November 2014, 37 states and Washington, D.C. have established incentives and tax or fee exemptions for BEVs and PHEVs, or utility-rate breaks, and other non-monetary incentives such as free parking and high-occupancy vehicle lane access regardless of the number of occupants.[19] In California, for example, the Clean Vehicle Rebate Project (CVRP) was established to promote the production and use of zero-emission vehicles (ZEVs). Eligible vehicles include only new Air Resources Board-certified or approved zero-emission or plug-in hybrid electric vehicles.[46] Among the eligible vehicles are neighborhood electric vehicles, battery electric, plug-in hybrid electric, and fuel cell vehicles including cars, trucks, medium- and heavy-duty commercial vehicles, and zero-emission motorcycles. Vehicles must be purchased or leased on or after March 15, 2010. Rebates initially of up to US$5,000 per light-duty vehicle, and later lowered to up to US$2,500, are available for individuals and business owners who purchase or lease new eligible vehicles. Certain zero-emission commercial vehicles are also eligible for rebates up to US$20,000.[47][48][49] California's zero-emission (ZEV) regulations are anticipated to result in 1.5 million electric vehicles on the road by 2025 ( i.e., 15% sales of total states in 2025); moreover, California's mixed incentives means to reach 40% of electric vehicle sales in the entire U.S.[38]
Electric vehicle purchases made in the U.S. are eligible for $2,500 to $7,500, depending on the make and model of the vehicle, in federal tax credit.[50]
The following table summarizes some of the state incentives:[51][52]
| State | Amount of incentive |
Type of PEV/vehicle |
Type of incentive |
Carpool lane access |
Comments |
|---|---|---|---|---|---|
| Arizona | BEVs | Lower vehicle licensing tax | Yes | Eligibility for PHEVs depends on the extent to which the vehicle is powered by electricity. Maximum of $75 available to individuals for installation of EV charging outlets. | |
| California | up to $2,500 | BEVs | Purchase rebate | Yes | Free access to HOVs through January 1, 2019, which also benefits natural gas vehicles and hydrogen fuel cell vehicles.[54] The amount of subsidies received is limited by annual income as of March 29, 2016. |
| up to $2,500 | PHEVs | Purchase rebate | Yes | PHEV free access to HOV lanes until January 1, 2019.[55] The cap was originally for the first 70,000 applicants. The cap was later raised to 85,000 and the limit was reached in December 2015. Per SB-838, and effective as of September 13, 2016, the Green Clean Air Vehicle Decal limit imposed by AB 95 has been removed.[56] | |
| up to $1,500 | Electric motorcycles and NEVs |
Purchase rebate | Yes | All motorcycles have free access to HOV lanes. | |
| Colorado | up to $6,000 | BEVs and PHEVs |
Income tax credit | No | Tax credit totaling 75 to 85% of the cost premium for a vehicle that uses or is converted to use an alternative fuel, is a hybrid electric vehicle or has its power source replaced with one that uses an alternative fuel. A 20% rebate also available for EV charger installation.[57] |
| Connecticut | up to $3,000 | BEVs, PHEV | Rebate | No | CHEAPR provides up to $3,000 for fuel cell EV, EV or plug-in hybrid electric vehicle. Rebates are offered on a first-come, first-served basis. |
| Delaware | up to $2,200 | EV | Rebate | No | Customers with at a grid-integrated EV may qualify to receive kilowatt-hour credits for energy discharged to the grid from the EV's battery at the same rate that the customer pays to charge the battery. |
| District of Columbia | BEVs and PHEVs |
Excise tax exemption and reduced registration fees | No | A tax credit up to 50% of the equipment costs for the purchase and installation of electric vehicle charging station, up to $1,000 per residential install. | |
| Florida | BEVs and PHEVs |
Yes | Access to HOVs through January 1, 2018 if displaying the EV decal. Florida Statutes protects consumers from additional charges from insurance providers from insuring electric vehicles. | ||
| Georgia | $0 | ZEVs | Income tax credit | Yes | Tax credit of 20% of the cost of a zero emission vehicle up to $5,000 purchased before July 1, 2015. Plug-in hybrids were not eligible for this incentive.[58] The incentive removal reduced sales of small EVs but had little effect on large EVs.[59] |
| up to $2,500 | Alternative fuel conversion |
Income tax credit | Yes | Tax credit of 10% of the conversion cost for a vehicle converted to run solely on an alternative fuel and meets the standards for a low-emission vehicle up to $2,500.[58] | |
| up to $20,000 | Commercial AFVs | Income tax credit | Yes | Tax credit for new commercial medium-duty or heavy-duty AFVs or Medium-duty hybrid EVs that operate using at least 90% alternative fuel, expires June 30, 2017.[60] | |
| Hawaii | BEVs and PHEVs |
Parking | Yes | Carpool lane access and reduced rates for electric vehicle charging. EVs with EV license plates are exempt from certain parking fees charged by any non-federal government authorities. | |
| Idaho | BEVs, PHEV | Inspection Exemption | No | EVs are exempt from state motor vehicle inspection and maintenance programs. | |
| Illinois | BEVs, PHEVs and conversions |
Inspection Exemption | No | Vehicles powered exclusively by electricity are exempt from state motor vehicle emissions inspections; this was suspended in March 2015. Covered 80% of cost premium or electric conversion price, up to $4,000. | |
| Indiana | up to $1,650 | BEVs, PHEV | No | Credit to install residential charging station and free plug-in electric vehicle charging during off-peak hours until Jan. 31, 2017. | |
| Louisiana | up to $3,000 | BEVs, PHEVs and conversions |
Inspection Exemption | No | Tax credit of 50% of cost premium for BEV/PHEV purchase, 50% of conversion cost, or a tax credit worth 10% of the cost of a new BEV/PHEV vehicle up to $3,000. This same credit also applies to charge station costs. |
| Maryland | up to $3,000 | BEVs and PHEVs |
Yes[61] | Plug-in EVs are eligible for an excise tax credit until July 1, 2020.[62] The state also offers a US$900 rebate for buying and installation of wall connectors for individuals; US$5,000 for business, or state or local governments; and US$7,000 for retail service station dealers.[63] | |
| Massachusetts | up to $1,000 | BEVs and PHEVs |
Purchase rebate | Up to $1,000 rebate for purchasing PEVs, funds are limited.[64] | |
| Michigan | BEVs, PHEV | Inspection exemption | No | Alternative fuel vehicles are exempt from emissions inspection requirements. Indiana Michigan Power, Consumers Energy and DTE Energy offer other incentives. | |
| Minnesota | BEVs, PHEV | No | All public utilities must file a tariff that allows a customer to purchase electricity solely for the purpose of recharging an electric vehicle. The tariff must include either a time-of-day or off-peak rate. | ||
| Mississippi | BEVs, PHEV | Income tax credit | No | 0% interest loans for public school districts and municipalities to purchase alternative fuel school buses and other motor vehicles, convert school buses and other motor vehicles to use alternative fuels, purchase alternative fuel equipment, and install fueling stations. | |
| Missouri | up to $15,000 | BEVs, PHEV | No | Tax credit for the cost of installing a qualified alternative fueling station, until Jan. 1, 2018, and are exempt from state emissions inspection requirements. | |
| Montana | up to $500 | Alternative fuel conversion | Income tax credit | No | Credit only available for conversion costs up to $500 or 50% of conversion cost. Includes electric car conversion.[65] |
| Nebraska | BEVs, PHEV | Loans | No | Provides low-cost loans for purchase of EVs, the conversion of conventional vehicles to operate on alternative fuels, and the construction or purchase of a fueling station or equipment. | |
| Nevada | BEVs, PHEV | Yes | Exempt from emissions testing requirements and local public metered parking areas must have areas for EVs to park without paying a fee. Carpool lane access and reduced rates for electric vehicle charging. | ||
| New Hampshire | N/A | N/A | N/A | N/A | N/A |
| New Jersey | up to $5000 | BEVs, PHEV | Purchase rebate + sales tax exemption | Yes | Sales tax exemption for qualifying BEVs only, not PHEVs. The Turnpike offers a 10% discount from off-peak toll rates on the New Jersey Turnpike for vehicles that have a fuel economy of 45 miles per gallon or higher. |
| New York | BEVs, PHEVs and HEVs |
Yes | Plug-in electric vehicles and hybrid electric vehicles with a combined fuel economy rating of at least 45 mpg‑US (5.2 L/100 km; 54 mpg‑imp) and that also meet the California Air Resources Board SULEV emissions standard, are eligible for the Clean Pass Program. Eligible vehicles which display the Clean Pass vehicle sticker are allowed to use the Long Island Expressway HOV lanes, regardless of the number of occupants.[66] Drivers of qualified vehicles may also receive a 10% discount on established E-ZPass accounts with proof of registration.[67] A tax credit for 50 percent of the cost, up to $5,000, for the purchase and installation of a charging station until Dec. 31, 2017. | ||
| North Carolina | PHEV | Yes | Qualified PEVs are exempt from state emissions inspection requirements. | ||
| Ohio | EV | Yes | Vehicles powered exclusively by electricity, propane, or natural gas are exempt from state vehicle emissions inspections after receiving a one-time verification inspection. | ||
| Oklahoma | 75% cost | Income tax credit | No | A tax credit is available for up to 75 percent of the cost of installing charging stations. | |
| Oregon | BEVs | Income tax credit | No | A tax credit for 25% of charging station costs, up to $750 (more for commercial use). | |
| Pennsylvania | up to $2,000 | BEVs and PHEVs |
Purchase rebate | No | 250 rebates to assist with the purchase of new EVs. As of June 24, 2015, 193 rebates remain.[68] |
| Rhode Island | PHEV | Inspection exemption | No | Vehicles powered exclusively by electricity are exempt from state emissions control inspections. | |
| South Carolina | up to $1,500 | BEVs and PHEVs |
Income tax credit | No | Tax credit equaling 20% of federal credit for PHEVs and BEVs. |
| Tennessee | BEVs and PHEVs |
Rebate | Yes | Rebate is limited. HOV lane access. | |
| Texas | No | No credits exist as of 2020. | |||
| Utah | up to $1,500 | Conversions only | Income tax credit | Yes | Credit to convert a vehicle to run on propane, natural gas, or electricity. Allowed carpool lane access. |
| up to $1,500 | BEVs and PHEVs |
Income tax credit | Yes | Until Dec. 31, 2016 | |
| Virginia | BEVs and PHEVs |
No | Alternative fuel and hybrid electric vehicles are exempt from emissions testing. | ||
| Washington | BEVs | Sales tax | No | Beginning on July 1, 2016, a sales tax exemption applies to the first US$32,000 of the selling price of a qualifying new plug-in electric car, which translates into a tax savings between US$2,600 to US$3,100 for plug-in car buyers depending on where the dealer is located within the state, as the sales tax varies by county. The incentive applies towards the purchase or lease of a new car all-electric vehicle, or a plug-in hybrid with at least 30 mi (48 km) of all-electric range – such as the Chevrolet Volt and the BMW i3 REx. The new law also raises the previous purchase price cap to US$42,500, which will allow buyers of the Chevrolet Bolt EV, the next generation Nissan Leaf, and the Tesla Model 3 – all with 200 mi (320 km) of electric range – to be eligible for the incentive.[69][70] The tax exemption was brought back starting August 1, 2019 with a US$45,000 price cap for the first US$25,000 of the selling price. This ramps down to US$20,000 on August 1, 2021, and US$15,000 on August 1, 2023, phasing out completely after July 31, 2025.[71][72] | |
| Washington, D.C. | BEVs | Sales tax | No | Vehicles that operate exclusively on electricity, hydrogen, natural gas, or propane are exempt from excise taxes. |
New proposals[]

Several separate initiatives have been pursued unsuccessfully at the federal level since 2011 to transform the tax credit into an instant cash rebate. The objective of these initiatives is to make new qualifying plug-in electric cars more accessible to buyers by making the incentive more effective. The rebate would be available at the point of sale allowing consumers to avoid a wait of up to a year to apply the tax credit against income tax returns.[73][74][75]
In March 2014, the Obama Administration included a provision in the FY 2015 Budget to increase the maximum tax credit for plug-in electric vehicles and other advanced vehicles from US$7,500 to US$10,000. The new maximum tax credit would not apply to luxury vehicles with a sales price of over US$45,000, such as the Tesla Model S and the Cadillac ELR, which would be capped at US$7,500.[76] In November 2017, House Republicans proposed scrapping the US$7,500 tax credit as part of a sweeping tax overhaul.[77]
Charging equipment[]
Until 2010 there was a federal tax credit equal to 50% of the cost to buy and install a home-based charging station with a maximum credit of US$2,000 for each station. Businesses qualified for tax credits up to US$50,000 for larger installations.[39][78] These credits expired on December 31, 2010, but were extended through 2013 with a reduced tax credit equal to 30% with a maximum credit of up to US$1,000 for each station for individuals and up to US$30,000 for commercial buyers.[79][80] In 2016, the Obama administration and several stake holders announced $4.5 billion in loan guarantees for public charge stations, along with other initiatives.[81]
EV Everywhere Challenge[]
On March 7, 2012, President Barack Obama launched the EV Everywhere Challenge as part of the U.S. Department of Energy's Clean Energy Grand Challenges, which seeks to solve some of the U.S. biggest energy challenges and make clean energy technologies affordable and accessible to the vast majority of American households and businesses. The EV Everywhere Challenge has the goal of advancing electric vehicle technologies to have the country, by 2022, to produce a five-passenger electric vehicle that would provide both a payback time of less than five years and the ability to be recharged quickly enough to provide enough range for the typical American driver.[82][83]
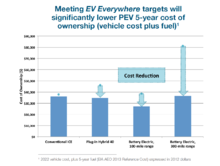
In January 2013 the Department of Energy (DoE) published the "EV Everywhere Grand Challenge Blueprint," which set the technical targets of the PEV program in four areas: battery research and development; electric drive system research and development; vehicle lightweighting; and advanced climate control technologies. The DoE set several specific goals, established in consultation with stakeholders.[84] The key goals to be met over the next five years to make plug-in electric vehicles competitive with conventional fossil fuel vehicles are:
- Cutting battery costs from their current US$500/kWh to US$125/kWh
- Eliminating almost 30% of vehicle weight through lightweighting
- Reducing the cost of electric drive systems from US$30/kW to US$8/kW
The DoE aim is to level the purchase plus operating (fuel) cost of an all-electric vehicle with a 280 mi (450 km) range with the costs of an internal combustion engine (ICE) vehicle of similar size. The DoE expects than even before the latter goals are met, the 5-year cost of ownership of most plug-in hybrid electric vehicles and of all-electric vehicles with shorter ranges, such as 100 mi (160 km), will be comparable to the same cost of ICE vehicles of similar size.[84][85]

In order to achieve these goals, the DoE is providing up to US$120 million over the next five years to fund the new Joint Center for Energy Storage Research (JCESR), a research center led by the Argonne National Laboratory in Chicago.[85][86] An initial progress report for the initiative was released in January 2014. Four results of the first year of the initiative were reported:[87]
- DOE research and development reduced the cost of electric drive vehicle batteries to US$325/ kWhr, 50% lower than 2010 costs.
- In the first year of the Workplace Charging Challenge, more than 50 U.S. employers joined the Challenge and pledged to provide charging access at more than 150 sites.
- DOE investments in EV Everywhere technology topped US$225 million in 2013, addressing key barriers to achieving the Grand Challenge.
- Consumer acceptance of electric vehicles grew: 97,000 plug-in electric vehicles were sold in 2013, nearly doubling 2012 sales.
- Workplace Charging Challenge
In January 2013, during the Washington Auto Show, Secretary of Energy Steven Chu announced an initiative to expand the EV Everywhere program with the "Workplace Charging Challenge." This initiative is a plan to install more electric vehicle charging stations in workplace parking lots. There are 21 founding partners and ambassadors for the program, including Ford, Chrysler, General Motors, Nissan, Tesla Motors, 3M, Google, Verizon, Duke Energy, General Electric, San Diego Gas & Electric, Siemens, Plug In America, and the Rocky Mountain Institute. The initiative's target is to increase the number of U.S. employers offering workplace charging by tenfold in the next five years. Initially, the DoE will not provide funding for this initiative.[88][89]
U.S. military[]
This section needs to be updated. (September 2014) |

The U.S. Army announced in 2009 that it will lease 4,000 Neighborhood Electric Vehicles (NEVs) within three years. The Army plans to use NEVs at its bases for transporting people around the base, as well as for security patrols and maintenance and delivery services. The Army accepted its first six NEVs at Virginia's Fort Myer in March 2009 and will lease a total of 600 NEVs through the rest of the year, followed by the leasing of 1,600 NEVs for each of the following two years.[90]

U.S. Air Force officials announced, in August 2011, a plan to establish Los Angeles Air Force Base, California, as the first federal facility to replace 100% of its general purpose fleet with plug-in electric vehicles. As part of the program, all Air Force-owned and -leased general purpose fleet vehicles on the base will be replaced with PEVs. There are approximately 40 eligible vehicles, ranging from passenger sedans to two-ton trucks and shuttle buses. The replacement PEVs include all-electric, plug-in hybrids, and extended-range electric vehicles. Electrification of Los Angeles AFB's general purpose fleet is the first step in a Department of Defense effort to establish strategies for large-scale integration of PEVs.[91]
By May 2013, it was announced that, as part of a test program created in January 2013, 500 plug-in electric vehicles with vehicle-to-grid (V2G) technology would be in use at six military bases, purchased using an investment of $20 million. If the program succeeds, there will be 3,000 V2G vehicles in 30 bases.[92]
Safety laws[]
Due to the low noise typical of electric vehicles at low speeds, the National Highway Traffic Safety Administration ruled that all hybrids and EVs must emit artificial noise when idling, accelerating to 19 mph (30 km/h) or going in reverse by September 2019.[93][94]
U.S. commitments to the 2015 Paris Agreement[]
As a signatory party to the 2015 Paris Climate Agreement, the United States government committed to reduce its greenhouse gas emissions, among others, from the transportation sector.[95] Already in 2015, the Federal government had set targets to reduce its own carbon footprint 30% by 2025, and acquire 20% of all new passenger vehicles as zero emission (all-electric of fuel cell) or plug-in hybrid by 2020, and 50% by 2025.[95][96] These goals are part of the U.S. nationally determined contributions (NDCs) to achieve the worldwide emissions reduction goal set by the Paris Agreement.[95][97]
On June 1, 2017, President Donald Trump announced that the U.S. would cease all participation in the 2015 Paris Agreement on climate change mitigation.[98]
On November 3, 2020, then President-elect Joe Biden announced that his administration will reverse President Donald Trump's United States withdrawal from the Paris Agreement by re-entering the United States into the Paris Agreement to continue to reiterated commitment in the agreement and move forward with the proposed Green New Deal legislation, to fight the global climate change problems as soon as Biden is inaugurated into office on January 20, 2021, succeeding then-outgoing Trump as President of the United States. Joe Biden also criticized Trump for withdrawing and ceasing all US participation from the UN Paris Agreement on June 1, 2017, and as Biden said that withdrawing from the UN Paris Agreement is a huge mistake. Joe Biden promises to introduce and transition to more energy-efficient buildings, increase generation of renewable energy by gradually moving away from the dependence of fracking and fossil fuels as energy sources in the US, and introduce more electric vehicles to all 50 US states.
As of 5 August 2021, the Biden Administration expects 50% of all vehicles sold in the US to be electric vehicles by 2030 and expects fossil fuel vehicles to be banned and gradually phased out from the US by the 2030-2040 timeframe.[99][100][101]
Operating costs and fuel economy[]
This section needs to be updated. (December 2015) |
The following table shows the U.S. Environmental Protection Agency (EPA) official ratings for fuel economy (miles per gallon gasoline equivalent) and EPA's estimated out-of-pocket fuel costs for all plug-in electric passenger vehicles rated by EPA in the United States since 2010 up to December 2016.[102][103][104]
| Vehicle | Model year |
Operating mode (AER) |
EPA fuel economy ratings | Cost to drive 25 miles |
Annual fuel cost(2) (15,000 mi) |
Notes | ||
|---|---|---|---|---|---|---|---|---|
| Combined | City | Highway | ||||||
| Hyundai Ioniq Electric[102][105] | 2017 | All-electric (124 mi) |
136 mpg-e (25 kW·h/100 mi) |
150 mpg-e (22 kW·h/100 mi) |
122 mpg-e (28 kW·h/100 mi) |
$0.81 | $500 | The 2017 Hyundai Ioniq Electric is the most fuel efficient EPA-certified vehicle of all fuel types considered in all years,[106] |
| Toyota Prius Prime[107] | 2017 | Electricity (25 mi) |
133 mpg‑e (25.9 kW⋅h/100 mi) | - | - | - | - | The 2017 Prius Prime is the most energy-efficient vehicle with a gasoline engine in all-electric mode (EV mode). The combined gasoline/electricity rating is not available yet. The Prime runs entirely on electricity in EV mode in more situations.[108] |
| Gasoline only | 54 mpg | 55 mpg/ 53 mpg |
- | - | ||||
| BMW i3 (60 A·h)[104][109] | 2014/15/16 | All-electric (81 mi) |
124 mpg-e (27 kW-hrs/100 mi) |
137 mpg-e (25 kW-hrs/100 mi) |
111 mpg-e (30 kW-hrs/100 mi) |
$0.88 | $500 | The 2014/15/16 BMW i3 was the most fuel efficient EPA-certified vehicle of all fuel types considered in all years until November 2017.[110] |
| Scion iQ EV[111] | 2013 | All-electric (38 mi) |
121 mpg-e (28 kW-hrs/100 mi) |
138 mpg-e (24 kW-hrs/100 mi) |
105 mpg-e (32 kW-hrs/100 mi) |
$0.84 | $500 | The iQ EV is only available in limited numbers for special fleet use, such as carsharing programs.[112][113][114] |
| Chevrolet Bolt EV[115] | 2017 | All-electric (238 mi) |
119 mpg-e (28 kW-hrs/100 mi) |
128 mpg-e (16.7 kW⋅h/100 km) |
110 mpg-e (19 kW⋅h/100 km) |
$0.92 | $550 | |
| Chevrolet Spark EV[116] | 2014/15/16 | All-electric (82 mi) |
119 mpg-e (28 kW-hrs/100 mi) |
121 mpg-e (28 kW-hrs/100 mi) |
138 mpg-e (24 kW-hrs/100 mi) |
$0.92 | $550 | |
| BMW i3 (94 A·h)[117] | 2017 | All-electric (114 mi) |
118 mpg-e (29 kW-hrs/100 mi) |
129 mpg-e | 106 mpg-e | $0.94 | $550 | |
| Honda Fit EV[118] | 2013/14 | All-electric (82 mi) |
118 mpg-e (29 kW-hrs/100 mi) |
132 mpg-e (26 kW-hrs/100 mi) |
105 mpg-e (32 kW-hrs/100 mi) |
$0.94 | $550 | |
| BMW i3 REx (60 A·h)[104][119] | 2014/15/16 | Electricity only (72 mi) |
117 mpg-e (29 kW-hrs/100 mi) |
97 mpg‑e (35 kW⋅h/100 mi) | 79 mpg‑e (44 kW⋅h/100 mi) | $0.94 | $650 | The EPA classifies the i3 REx as a series plug-in hybrid while CARB as a range-extended battery-electric vehicle (BEVx).[109][120][121] The 2014/15 i3 REx is the most fuel efficient EPA-certified vehicle with a gasoline engine ever with a combined gasoline/electricity rating of 88 mpg-e (city 97 mpg-e/hwy 79 mpg-e).[122] |
| Gasoline only (78 mi) |
39 mpg | 41 mpg | 37 mpg | $1.77 | ||||
| Volkswagen e-Golf[103][123] | 2015/16 | All-electric (83 mi) |
116 mpg-e (29 kW-hrs/100 mi) |
126 mpg-e (27 kW-hrs/100 mi) |
105 mpg-e (32 kW-hrs/100 mi) |
$0.88 | $550 | |
| Fiat 500e[124] | 2013/14/15 | All-electric (87 mi) |
116 mpg-e (29 kW-hrs/100 mi) |
122 mpg-e (28 kW-hrs/100 mi) |
108 mpg-e (31 kW-hrs/100 mi) |
$0.88 | $550 | |
| Nissan Leaf (24 kW-hr)[125] | 2013/14/15/16 | All-electric (84 mi) |
114 mpg-e (30 kW-hrs/100 mi) |
126 mpg-e (27 kW-hrs/100 mi) |
101 mpg-e (33 kW-hrs/100 mi) |
$0.89 | $550 | The 2016 model year Leaf correspond to the variant with the 24 kW-hr battery pack. |
| Honda Accord PHEV[126] | 2014 | Electricity and gasoline (13 mi) |
115 mpg-e (29 kW-hrs/100 mi) |
- | - | $1.36 | $950 | The first 13 mi it has a combined rating of 115 mpg-e. After the first 13 mi the car functions like a regular hybrid.[104] The Accord has a rating for combined EV/hybrid operation of 57 mpg-e.[127] |
| Gasoline only | 46 mpg | 47 mpg | 46 mpg | |||||
| Nissan Leaf (30 kW-hr)[103][125] | 2016 | All-electric (107 mi) |
112 mpg-e (30 kW-hrs/100 mi) |
124 mpg-e (27 kW-hrs/100 mi) | 101 mpg-e (33 kW-hrs/100 mi) | $0.90 | $550 | Model with the 30 kW-hr battery pack. |
| Mitsubishi i[128] | 2012/13/14/16 | All-electric (62 mi) |
112 mpg-e (30 kW-hrs/100 mi) |
126 mpg-e (27 kW-hrs/100 mi) |
99 mpg-e (34 kW-hrs/100 mi) |
$0.90 | $550 | |
| Fiat 500e[129] | 2016 | All-electric (84 mi) |
112 mpg-e (30 kWh/100 mi) |
121 mpg-e (28 kWh/100 mi) |
103 mpg-e (33 kWh/100 mi) |
$0.90 | $550 | |
| BMW i3 REx (94 A·h)[117] | 2017 | Electricity only (97 mi) |
111 mpg-e (30 kWh/100 mi) |
- | - | - | $650 | The EPA classifies the i3 REx as a series plug-in hybrid while CARB as a range-extended battery-electric vehicle (BEVx). |
| Gasoline only (83 mi) |
35 mpg | - | - | - | ||||
| Smart electric drive[130] | 2013/14/15/16 | All-electric (68 mi) |
107 mpg-e (32 kW-hrs/100 mi) |
122 mpg-e (28 kW-hrs/100 mi) |
93 mpg-e (36 kW-hrs/100 mi) |
$0.96 | $600 | Third generation model. Ratings and costs are for both convertible and coupe models. |
| Chevrolet Volt (second generation)[131][132] | 2016/17 | Electricity only (53 mi) |
106 mpg-e (31 kW-hrs/100 mi) |
113 mpg-e (29 kW-hrs/100 mi) |
99 mpg-e (34 kW-hrs/100 mi) |
$1.01 | $650 | The 2016 Volt has a combined gasoline/electricity fuel economy of 77 mpg-e (city 82 mpg-e/ hwy 72 mpg-e).[122] It uses regular gasoline. |
| Gasoline only | 42 mpg | 43 mpg | 42 mpg | $1.37 | ||||
| Kia Soul EV[103][133] | 2015/16 | All-electric (93 mi) |
105 mpg-e (32 kW-hrs/100 mi) |
120 mpg-e (28 kW-hrs/100 mi) |
92 mpg-e (37 kW-hrs/100 mi) |
$0.96 | $600 | The Soul EV has the largest all-electric range in city driving of its class, with 104 mi (167 km).[134] |
| Ford Focus Electric[135] | 2012/13/14/15/16 | All-electric (76 mi) |
105 mpg-e (32 kW-hrs/100 mi) |
110 mpg-e (31 kW-hrs/100 mi) |
99 mpg-e (34 kW-hrs/100 mi) |
$0.96 | $600 | |
| BMW ActiveE[136] | 2011 | All-electric (94 mi) |
102 mpg-e (33 kW-hrs/100 mi) |
107 mpg‑e (32 kW⋅h/100 mi) | 96 mpg‑e (36 kW⋅h/100 mi) | $0.99 | $600 | |
| Nissan Leaf[137] | 2011/12 | All-electric (73 mi) |
99 mpg-e (34 kW-hrs/100 mi) |
106 mpg-e (32 kW-hrs/100 mi) |
92 mpg-e (37 kW-hrs/100 mi) |
$1.02 | $600 | |
| Hyundai Sonata PHEV[138] | 2016 | Electricity and gasoline (27 mi) |
99mpg-e (34 kW-hrs/100 mi) |
- | - | $1.10 | $950 | During the first 27 mi uses some gasoline. The actual all-electric range is between 0 and 27 mi.[138] |
| Gasoline only | 40 mpg | - | - | $2.18 | ||||
| Chevrolet Volt[139] | 2013/14 | Electricity only (38 mi) |
98 mpg-e (35 kW-hrs/100 mi) |
- | - | $1.14 | $800 | The 2013/14 Volt has a combined gasoline/electricity rating of 62 mpg-e (city 63 mpg-e/hwy 61 mpg-e) and uses premium gas.[122] |
| Gasoline only | 37 mpg | 35 mpg | 40 mpg | $1.86 | ||||
| Ford Fusion Energi[140] | 2017 | Electricity and gasoline (22 mi) |
97 mpg-e (35 kW-hrs/100 mi) |
- | - | $1.16 | $750 | The actual all-electric range is between 0 and 21 mi.[140] |
| Gasoline only | 42 mpg | - | - | $1.37 | ||||
| Tesla Model S[104][141] | 2013/14 | All-electric (208 mi) |
95 mpg-e (35 kW-hrs/100 mi) |
94 mpg-e (36 kW-hrs/100 mi) |
97 mpg-e (35 kW-hrs/100 mi) |
$1.05 | $650 | Model with 60 kWh battery pack |
| Toyota Prius PHV[142] | 2012/13/14 | Electricity and gasoline (11 mi) |
95 mpg-e (29 kW-hrs/100 mi plus 0.2 gallons/100 mi) |
- | - | $1.43 | $900 | After the first 11 mi the car functions like a regular Prius hybrid The 2012/14 Prius has a rating for combined EV/hybrid operation of 58 mpg-e (city 59 mpg-e/hwy 56 mpg-e).[122] |
| Gasoline only | 50 mpg | 51 mpg | 49 mpg | $1.74 | ||||
| Chevrolet Volt[143] | 2011/12 | Electricity only (35 mi) |
94 mpg-e (36 kW-hrs/100 mi) |
95 mpg-e (36 kW-hrs/100 mi) |
93 mpg-e (37 kW-hrs/100 mi) |
$1.08 | $1,000 | Both model year 2011 and 2012 have the same operating costs, but the 2011 Volt has a rating of 93 mpg-e for combined driving in all-electric mode. |
| Gasoline only | 37 mpg | 35 mpg | 40 mpg | $2.57 | ||||
| Tesla Model S[144] | 2013 | All-electric (139 mi) |
94 mpg-e (36 kW-hrs/100 mi) |
93 mpg‑e (37 kW⋅h/100 mi) | 96 mpg‑e (36 kW⋅h/100 mi) | $1.08 | $650 | Model with 40 kWh battery pack. This model was officially rated by the EPA but Tesla canceled its production due to lack of demand.[145] |
| Tesla Model X AWD – 90D[146] | 2016 | All-electric (257 mi) |
92 mpg-e (34 kW-hrs/100 mi) |
90 mpg-e (37 kW-hrs/100 mi) |
94 mpg-e (32 kW-hrs/100 mi) |
$1.11 | $650 | Model with 90kWh battery pack |
| Tesla Model X AWD – P90D[146] | 2016 | All-electric (250 mi) |
89 mpg-e (38 kW-hrs/100 mi) |
89 mpg-e (38 kW-hrs/100 mi) |
90 mpg-e (38 kW-hrs/100 mi) |
$1.14 | $700 | Model with 90kWh battery pack |
| Tesla Model S[141] | 2012/13/14 | All-electric (265 mi) |
89 mpg-e (38 kW-hrs/100 mi) |
88 mpg-e (38 kW-hrs/100 mi) |
90 mpg-e (37 kW-hrs/100 mi) |
$1.14 | $700 | Model with 85kWh battery pack |
| Ford C-Max Energi[147][148] Ford Fusion Energi[147][148] |
2013/16 | Electricity and gasoline (20 mi) |
88 mpg-e (37 kW-hrs/100 mi) |
95 mpg‑e (36 kW⋅h/100 mi) | 81 mpg‑e (42 kW⋅h/100 mi) | $1.36 | $1,050 | The Energi did not use any gasoline for the first 20 mi in EPA tests, but depending on the driving style, the car may use both gasoline and electricity during EV mode. The Energi models have a combined EV/hybrid operation rating of 51 mpg-e (city 55 mpg-e/hwy 46 mpg-e).[122] |
| Gasoline only | 38 mpg | 40 mpg | 36 mpg | $2.29 | ||||
| Smart electric drive[130] | 2011 | All-electric (63 mi) |
87 mpg-e (39 kW-hrs/100 mi) |
94 mpg‑e (37 kW⋅h/100 mi) | 79 mpg‑e (44 kW⋅h/100 mi) | $1.17 | $700 | Second generation model. Ratings are costs for both cabriolet and coupe models. |
| Audi A3 e-tron ultra[149] | 2016 | Electricity only (17 mi) |
86 mpg-e (38 kW-hrs/100 mi) |
- | - | $1.44 | $1,000 | During the first 17 mi uses some gasoline. The actual all-electric range is between 0 and 17 mi.[149] |
| Gasoline only | 39 mpg | - | - | $2.04 | ||||
| Cadillac ELR[150] | 2016 | Electricity only (40 mi) |
85 mpg-e (39 kW-hrs/100 mi) |
- | - | $1.17 | $950 | |
| Gasoline only | 32 mpg | - | - | $2.48 | ||||
| Mercedes-Benz B-Class Electric Drive[104][151] | 2014/15/16 | All-electric (87 mi) |
84 mpg-e (40 kW-hrs/100 mi) |
85 mpg-e (40 kW-hrs/100 mi) |
83 mpg-e (41 kW-hrs/100 mi) |
$1.20 | $700 | |
| Chrysler Pacifica Hybrid[152] | 2017 | Electricity only (33 mi) |
84 mpg-e (40 kWh/100 mi) |
- | - | $1.73 | $900 | During the first 33 mi uses some gasoline. The actual all-electric range is between 0 and 33 mi.[152] |
| Gasoline only | 32 mpg | - | - | $1.83 | ||||
| Audi A3 e-tron[149] | 2016 | Electricity only (16 mi) |
83 mpg-e (40 kW-hrs/100 mi) |
- | - | $1.60 | $1,100 | During the first 16 mi uses some gasoline. The actual all-electric range is between 0 and 16 mi.[149] |
| Gasoline only | 35 mpg | - | - | $2.27 | ||||
| Cadillac ELR[153] | 2014/15 | Electricity only (37 mi) |
82 mpg-e (41 kW-hrs/100 mi) |
- | - | $1.23 | $1,100 | The 2014 ELR has a combined EV/gasoline rating of 54 mpg-e (city 54 mpg-e/hwy 55 mpg-e).[122] |
| Gasoline only | 33 mpg | 31 mpg | 35 mpg | $2.89 | ||||
| Cadillac ELR Sport[150] | 2016 | Electricity only (36 mi) |
80 mpg-e (43 kW-hrs/100 mi) |
- | - | $1.29 | $1,050 | |
| Gasoline only | 30 mpg | - | - | $2.65 | ||||
| Toyota RAV4 EV[104][154] | 2012 | All-electric (103 mi) |
76 mpg-e (44 kW-hrs/100 mi) |
78 mpg-e (43 kW-hrs/100 mi) |
74 mpg-e (46 kW-hrs/100 mi) |
$1.32 | $800 | |
| BMW i8[104][155] | 2014/15 | Electricity and gasoline (15 mi) |
76 mpg-e (43 kW-hrs/100 mi) |
- | - | $2.19 | $1,550 | The i8 does not run on 100% electricity as it consumes 0.1 gallons per 100 mi in EV mode (all-electric range = 0 mi) The i8 has a rating for combined EV/hybrid operation of 37 mpg-e.[127] |
| Gasoline only | 28 mpg | 28 mpg | 29 mpg | $3.40 | ||||
| Coda[156] | 2012/13 | All-electric (88 mi) |
73 mpg-e (46 kW-hrs/100 mi) |
77 mpg-e (44 kW-hrs/100 mi) |
68 mpg-e (50 kW-hrs/100 mi) |
$1.38 | $850 | |
| BMW 330e[157] | 2016 | Electricity and gasoline (14 mi) |
72 mpg-e (47 kWh/100 mi) |
- | - | $1.74 | $1,050 | During the first 14 mi uses some gasoline. The actual all-electric range is between 0 and 14 mi.[157] Premium gasoline. |
| Gasoline only | 31 mpg | - | - | $2.02 | ||||
| Porsche 918 Spyder[158] | 2015 | Electricity only (12 mi) |
67 mpg-e (50 kW-hrs/100 mi) |
- | - | $1.50 | $2,100 | |
| Gasoline only | 22 mpg | - | - | $4.33 | ||||
| BYD e6[159] | 2012 | All-electric (122 mi) |
62 mpg-e (54 kW-hrs/100 mi) |
60 mpg-e (56 kW-hrs/100 mi) |
64 mpg-e (52 kW-hrs/100 mi) |
$1.62 | $950 | |
| BMW 740e iPerformance[160] | 2017 | Electricity only (14 mi) |
64 mpg-e (52 kWh/100 mi) |
- | - | $2.03 | $1,350 | During the first 14 mi uses some gasoline. The actual all-electric range is between 0 and 14 mi.[160] |
| Gasoline only | 27 mpg | - | - | $2.48 | ||||
| BMW X5 xDrive40e[161] | 2016 | Electricity only (14 mi) |
56 mpg-e (59 kW-hrs/100 mi) |
- | - | $2.45 | $1,700 | During the first 14 mi uses some gasoline. The actual all-electric range is between 0 and 14 mi.[161] |
| Gasoline only | 24 mpg | - | - | $3.31 | ||||
| Mercedes-Benz S 500 e[162] | 2015 | Electricity only (14 mi) |
58 mpg-e (59 kW-hrs/100 mi) |
- | - | $2.34 | $1,750 | During the first 14 mi uses some gasoline. The all-electric range varies between 0 and 12 mi.[162] |
| Gasoline only | 26 mpg | - | - | $3.06 | ||||
| Fisker Karma[163] | 2012 | Electricity only (33 mi) |
54 mpg-e (62 kW-hrs/100 mi) |
- | - | $1.86 | $1,750 | |
| Gasoline only | 20 mpg | 20 mpg | 21 mpg | $4.76 | ||||
| Volvo XC90 T8[164] | 2016 | Electricity and gasoline (14 mi) |
53 mpg-e (58 kWh/100 mi) |
- | - | $2.19 | $1,400 | During the first 14 mi uses some gasoline. The actual all-electric range is between 0 and 13 mi.[164] Premium gasoline. |
| Gasoline only | 25 mpg | - | - | $2.51 | ||||
| Porsche Panamera S E-Hybrid[165] | 2014 | Electricity and gasoline (16 mi) |
50 mpg-e (52 kW-hrs/100 mi) |
- | - | $3.49 | $1,850 | The all-electric range is between 0 to 15 mi.[165] The S E-Hybrid has a rating for combined EV/hybrid operation of 31 mpg-e.[127] |
| Gasoline only | 25 mpg | 23 mpg | 29 mpg | $3.81 | ||||
| Porsche Cayenne S E-Hybrid[166] | 2015 | Electricity and gasoline (14 mi) |
47 mpg-e (69 kW-hrs/100 mi) |
- | - | $2.07 | $2,100 | |
| Gasoline only | 22 mpg | - | - | $4.33 | ||||
| McLaren P1[104][167] | 2014 | Electricity and gasoline (19 mi) |
18 mpg-e (25 kW-hrs/100 mi) |
- | - | $5.38 | $3,200 | The P1 does not run on 100% electricity as it consumes 4.8 gallons per 100 mi in EV mode (all-electric range = 0 mi)[167] The P1 has a rating for combined EV/hybrid operation of 17 mpg-e.[127] |
| Gasoline only | 17 mpg | 16 mpg | 20 mpg | $5.60 | ||||
| Notes: (1) In November 2010, EPA introduced MPGe as comparison metric on its new sticker for fuel economy for the Nissan Leaf and the Chevrolet Volt.[168][169] Before, the EPA rating for on board energy efficiency for electric vehicles was expressed as kilowatt-hour per 100 miles.[170][171] The window sticker of the 2009 Mini E showed an energy consumption of 33 kW-hrs/100 mi in the city and 36 kW-hrs/100 mi on the highway (equivalent to 102 mpg city and 94 mpg on the highway).[170] The 2009 Tesla Roadster was rated 32 kW-hrs/100 mi in city and 33 kW-hrs/100 mi on the highway (equivalent to 105 mpg city and 102 mpg highway).[172]
(2) Based on 45% highway and 55% city driving. Values rounded to the nearest $50. Electricity cost of US$0.12/kw-hr, premium gasoline price of US$3.81 per gallon (used by the Volt, Karma, BMW i3 REx, Mercedes S500e, McLaren P1 and all Porsche models), and regular gasoline price of US$3.48 per gallon (as of 12 March 2014). Conversion 1 gallon of gasoline=33.7 kW-hr. | ||||||||
Air pollution and greenhouse gas emissions[]
Electric cars, as well as plug-in hybrids operating in all-electric mode, emit no harmful tailpipe pollutants from the onboard source of power, such as particulates (soot), volatile organic compounds, hydrocarbons, carbon monoxide, ozone, lead, and various oxides of nitrogen. The clean air benefit is usually local because, depending on the source of the electricity used to recharge the batteries, air pollutant emissions are shifted to the location of the generation plants.[173] In a similar manner, plug-in electric vehicles operating in all-electric mode do not emit greenhouse gases from the onboard source of power, but from the point of view of a well-to-wheel assessment, the extent of the benefit also depends on the fuel and technology used for electricity generation. From the perspective of a full life cycle analysis, the electricity used to recharge the batteries must be generated from renewable or clean sources such as wind, solar, hydroelectric, or nuclear power for PEVs to have almost none or zero well-to-wheel emissions.[173][174]
EPA estimates[]
The following table compares tailpipe and upstream CO2 emissions estimated by the U.S. Environmental Protection Agency for all series production model year 2014 plug-in electric vehicles available in the U.S. market. Total emissions include the emissions associated with the production and distribution of electricity used to charge the vehicle, and for plug-in hybrid electric vehicles, it also includes emissions associated with tailpipe emissions produced from the internal combustion engine. These figures were published by the EPA in October 2014 in its annual report "Light-Duty Automotive Technology, Carbon Dioxide Emissions, and Fuel Economy Trends." All emissions are estimated considering average real world city and highway operation based on the EPA 5-cycle label methodology, using a weighted 55% city and 45% highway driving.[127]
For purposes of an accurate estimation of emissions, the analysis took into consideration the differences in operation between plug-in hybrids. Some, like the Chevrolet Volt, can operate in all-electric mode without using gasoline, and others operate in a blended mode like the Toyota Prius PHV, which uses both energy stored in the battery and energy from the gasoline tank to propel the vehicle, but that can deliver substantial all-electric driving in blended mode. In addition, since the all-electric range of plug-in hybrids depends on the size of the battery pack, the analysis introduced a utility factor as a projection of the share of miles that will be driven using electricity by an average driver, for both, electric only and blended EV modes. Since all-electric cars do not produce tailpipe emissions, the utility factor applies only to plug-in hybrids. The following table shows the overall fuel economy expressed in terms of miles per gallon gasoline equivalent (mpg-e) and the utility factor for the ten MY2014 plug-in hybrids available in the U.S. market, and EPA's best estimate of the CO2 tailpipe emissions produced by these PHEVs.[127]
In order to account for the upstream CO2 emissions associated with the production and distribution of electricity, and since electricity production in the United States varies significantly from region to region, the EPA considered three scenarios/ranges with the low end scenario corresponding to the California powerplant emissions factor, the middle of the range represented by the national average powerplant emissions factor, and the upper end of the range corresponding to the powerplant emissions factor for the Rocky Mountains. The EPA estimates that the electricity GHG emission factors for various regions of the country vary from 346 g CO2/kWh in California to 986 g CO2/kWh in the Rockies, with a national average of 648 g CO2/kWh.[127]
| Vehicle | Overall fuel economy (mpg-e) |
Utility factor(2) (share EV miles) |
Tailpipe CO2 (g/mi) |
Tailpipe + total upstream CO2 | ||
|---|---|---|---|---|---|---|
| Low (g/mi) |
Avg (g/mi) |
High (g/mi) | ||||
| BMW i3 | 124 | 1 | 0 | 93 | 175 | 266 |
| Chevrolet Spark EV | 119 | 1 | 0 | 97 | 181 | 276 |
| Honda Fit EV | 118 | 1 | 0 | 99 | 185 | 281 |
| Fiat 500e | 116 | 1 | 0 | 101 | 189 | 288 |
| Nissan Leaf | 114 | 1 | 0 | 104 | 194 | 296 |
| Mitsubishi i | 112 | 1 | 0 | 104 | 195 | 296 |
| Smart electric drive | 107 | 1 | 0 | 109 | 204 | 311 |
| Ford Focus Electric | 105 | 1 | 0 | 111 | 208 | 316 |
| Tesla Model S (60 kWh) | 95 | 1 | 0 | 122 | 229 | 348 |
| Tesla Model S (85 kWh) | 89 | 1 | 0 | 131 | 246 | 374 |
| BMW i3 REx(3) | 88 | 0.83 | 40 | 134 | 207 | 288 |
| Mercedes-Benz B-Class ED | 84 | 1 | 0 | 138 | 259 | 394 |
| Toyota RAV4 EV | 76 | 1 | 0 | 153 | 287 | 436 |
| BYD e6 | 63 | 1 | 0 | 187 | 350 | 532 |
| Chevrolet Volt | 62 | 0.66 | 81 | 180 | 249 | 326 |
| Toyota Prius Plug-in Hybrid | 58 | 0.29 | 133 | 195 | 221 | 249 |
| Honda Accord Plug-in Hybrid | 57 | 0.33 | 130 | 196 | 225 | 257 |
| Cadillac ELR | 54 | 0.65 | 91 | 206 | 286 | 377 |
| Ford C-Max Energi | 51 | 0.45 | 129 | 219 | 269 | 326 |
| Ford Fusion Energi | 51 | 0.45 | 129 | 219 | 269 | 326 |
| BMW i8 | 37 | 0.37 | 198 | 303 | 351 | 404 |
| Porsche Panamera S E-Hybrid | 31 | 0.39 | 206 | 328 | 389 | 457 |
| McLaren P1 | 17 | 0.43 | 463 | 617 | 650 | 687 |
| Average gasoline car | 24.2 | 0 | 367 | 400 | 400 | 400 |
| Notes: (1) Based on 45% highway and 55% city driving. (2) The utility factor represents, on average, the percentage of miles that will be driven using electricity (in electric only and blended modes) by an average driver. (3) The EPA classifies the i3 REx as a series plug-in hybrid[104][127] | ||||||
Union of Concerned Scientists[]
2012 study[]
The Union of Concerned Scientists (UCS) published a study in 2012 that assessed average greenhouse gas emissions in the U.S. resulting from charging plug-in car batteries from the perspective of the full life-cycle (well-to-wheel analysis) and according to fuel and technology used to generate electric power by region. The study used the Nissan Leaf all-electric car to establish the analysis baseline, and electric-utility emissions are based on EPA's 2009 estimates. The UCS study expressed the results in terms of miles per gallon instead of the conventional unit of grams of greenhouse gases or carbon dioxide equivalent emissions per year in order to make the results more friendly for consumers. The study found that in areas where electricity is generated from natural gas, nuclear, hydroelectric or renewable sources, the potential of plug-in electric cars to reduce greenhouse emissions is significant. On the other hand, in regions where a high proportion of power is generated from coal, hybrid electric cars produce less CO2-e equivalent emissions than plug-in electric cars, and the best fuel efficient gasoline-powered subcompact car produces slightly less emissions than a PEV. In the worst-case scenario, the study estimated that for a region where all energy is generated from coal, a plug-in electric car would emit greenhouse gas emissions equivalent to a gasoline car rated at a combined city/highway driving fuel economy of 30 mpg‑US (7.8 L/100 km; 36 mpg‑imp). In contrast, in a region that is completely reliant on natural gas, the PEV would be equivalent to a gasoline-powered car rated at 50 mpg‑US (4.7 L/100 km; 60 mpg‑imp).[175][176]
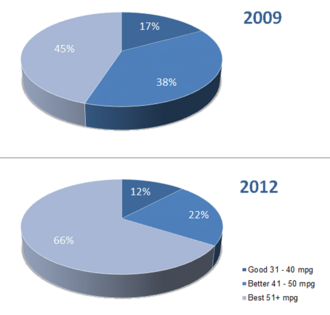
The study concluded that for 45% of the U.S. population, a plug-in electric car will generate lower CO2 equivalent emissions than a gasoline-powered car capable of combined 50 mpg‑US (4.7 L/100 km; 60 mpg‑imp), such as the Toyota Prius and the Prius c. The study also found that for 37% of the population, the electric car emissions will fall in the range of a gasoline-powered car rated at a combined fuel economy of 41 to 50 mpg‑US (5.7 to 4.7 L/100 km; 49 to 60 mpg‑imp), such as the Honda Civic Hybrid and the Lexus CT200h. Only 18% of the population lives in areas where the power-supply is more dependent on burning carbon, and the greenhouse gas emissions will be equivalent to a car rated at a combined fuel economy of 31 to 40 mpg‑US (7.6 to 5.9 L/100 km; 37 to 48 mpg‑imp), such as the Chevrolet Cruze and Ford Focus.[176][177][178] The study found that there are no regions in the U.S. where plug-in electric cars will have higher greenhouse gas emissions than the average new compact gasoline engine automobile, and the area with the dirtiest power supply produces CO2 emissions equivalent to a gasoline-powered car rated at 33 mpg‑US (7.1 L/100 km).[175]
The following table shows a representative sample of cities within each of the three categories of emissions intensity used in the UCS study, showing the corresponding miles per gallon equivalent for each city as compared to the greenhouse gas emissions of a gasoline-powered car:
| Regional comparison of full life cycle assessment of greenhouse gas emissions resulting from charging plug-in electric vehicles expressed in terms of miles per gallon of a gasoline-powered car with equivalent emissions[175][177][178] | |||||
|---|---|---|---|---|---|
| Rating scale by emissions intensity expressed as miles per gallon |
City | PEV well-to-wheels carbon dioxide equivalent (CO2-e) emissions per year expressed as mpg US |
Percent reduction in CO2-e emissions compared with 27 mpg US average new compact car |
Combined EPA's rated fuel economy and GHG emissions for reference gasoline-powered car[179] | |
| Best LowestCO2-e emissions equivalent to over 50 mpg‑US (4.7 L/100 km) |
Juneau, Alaska | 112 mpg‑US (2.10 L/100 km) | 315% | 2012 Toyota Prius/Prius c 50 mpg‑US (4.7 L/100 km) | |
| San Francisco | 79 mpg‑US (3.0 L/100 km) | 193% | |||
| New York City | 74 mpg‑US (3.2 L/100 km) | 174% | |||
| Portland, Oregon | 73 mpg‑US (3.2 L/100 km) | 170% | Greenhouse gas emissions (grams/mile) | ||
| Boston | 67 mpg‑US (3.5 L/100 km) | 148% | Tailpipe CO2 | Upstream GHG | |
| Washington, D.C. | 58 mpg‑US (4.1 L/100 km) | 115% | 178 g/mi (111 g/km) | 44 g/mi (27 g/km) | |
| Better Moderate CO2-e emissions equivalent to between 41 mpg‑US (5.7 L/100 km) to 50 mpg‑US (4.7 L/100 km) |
Phoenix, Arizona | 48 mpg‑US (4.9 L/100 km) | 78% | 2012 Honda Civic Hybrid 44 mpg‑US (5.3 L/100 km) | |
| Miami | 47 mpg‑US (5.0 L/100 km) | 74% | |||
| Houston | 46 mpg‑US (5.1 L/100 km) | 70% | Greenhouse gas emissions (grams/mile) | ||
| Columbus, Ohio | 41 mpg‑US (5.7 L/100 km) | 52% | Tailpipe CO2 | Upstream GHG | |
| Atlanta | 41 mpg‑US (5.7 L/100 km) | 52% | 202 g/mi (125 g/km) | 50 g/mi (31 g/km) | |
| Good Highest CO2-e emissions equivalent to between 31 mpg‑US (7.6 L/100 km) to 40 mpg‑US (5.9 L/100 km) |
Detroit | 38 mpg‑US (6.2 L/100 km) | 41% | 2012 Chevrolet Cruze 30 mpg‑US (7.8 L/100 km) | |
| Des Moines, Iowa | 37 mpg‑US (6.4 L/100 km) | 37% | |||
| St. Louis, Missouri | 36 mpg‑US (6.5 L/100 km) | 33% | Greenhouse gas emissions (grams/mile) | ||
| Wichita, Kansas | 35 mpg‑US (6.7 L/100 km) | 30% | Tailpipe CO2 | Upstream GHG | |
| Denver | 33 mpg‑US (7.1 L/100 km) | 22% | 296 g/mi (184 g/km) | 73 g/mi (45 g/km) | |
| Source: Union of Concerned Scientists, 2012.[175] Notes: The Nissan Leaf is the baseline car for the assessment, with an energy consumption rated by EPA at 34 kWh/100 mi or 99 miles per gallon gasoline equivalent (2.4 L/100 km) combined. The ratings are based on a region's mix of electricity sources and its average emissions intensity over the course of a year. In practice the electricity grid is very dynamic, with the mix of power plants constantly changing in response to hourly, daily and seasonal electricity demand, and availability of electricity resources. | |||||
2014 update[]
In September 2014 the UCS published an updated analysis of its 2012 report. The 2014 analysis found that 60% of Americans, up from 45% in 2009, live in regions where an all-electric car produce fewer CO2 equivalent emissions per mile than the most efficient hybrid. The UCS study found several reasons for the improvement. First, electric utilities have adopted cleaner sources of electricity to their mix between the two analysis. The 2014 study used electric-utility emissions based on EPA's 2010 estimates, but since coal use nationwide is down by about 5% from 2010 to 2014, actual efficiency in 2014 is expected to be better than estimated in the UCS study. Second, electric vehicles have become more efficient, as the average model year 2013 all-electric vehicle used 0.325 kWh/mile, representing a 5% improvement over 2011 models. The Nissan Leaf, used as the reference model for the baseline of the 2012 study, was upgraded in model year 2013 to achieve a rating of 0.30 kWh/mile, a 12% improvement over the 2011 model year model rating of 0.34 kWh/mile. Also, some new models are cleaner than the average, such as the BMW i3, which is rated at 0.27 kWh by the EPA. An i3 charged with power from the Midwest grid would be as clean as a gasoline-powered car with about 50 mpg‑US (4.7 L/100 km), up from 39 mpg‑US (6.0 L/100 km) for the average electric car in the 2012 study. In states with a cleaner mix generation, the gains were larger. The average all-electric car in California went up to 95 mpg‑US (2.5 L/100 km) equivalent from 78 mpg‑US (3.0 L/100 km) in the 2012 study. States with dirtier generation that rely heavily on coal still lag, such as Colorado, where the average BEV only achieves the same emissions as a 34 mpg‑US (6.9 L/100 km; 41 mpg‑imp) gasoline-powered car. The author of the 2014 analysis noted that the benefits are not distributed evenly across the U.S. because electric car adoption is concentrated in the states with cleaner power.[180][181]
2015 study[]
| External media | |
|---|---|
| Images | |
| Video | |
In November 2015 the Union of Concerned Scientists published a new report comparing two battery electric vehicles (BEVs) with similar gasoline vehicles by examining their global warming emissions over their full life-cycle, cradle-to-grave analysis. The two BEVs modeled, midsize and full-size, are based on the two most popular BEV models sold in the United States in 2015, the Nissan Leaf and the Tesla Model S. The study found that all-electric cars representative of those sold today, on average produce less than half the global warming emissions of comparable gasoline-powered vehicles, despite taken into account the higher emissions associated with BEV manufacturing. Considering the regions where the two most popular electric cars are being sold, excess manufacturing emissions are offset within 6 to 16 months of average driving. The study also concluded that driving an average EV results in lower global warming emissions than driving a gasoline car that gets 50 mpg‑US (4.7 L/100 km) in regions covering two-thirds of the U.S. population, up from 45% in 2009. Based on where EVs are being sold in the United States in 2015, the average EV produces global warming emissions equal to a gasoline vehicle with a 68 mpg‑US (3.5 L/100 km) fuel economy rating. The authors identified two main reason for the fact that EV-related emissions have become even lower in many parts of the country since the first study was conducted in 2012. Electricity generation has been getting cleaner, as coal-fired generation has declined while lower-carbon alternatives have increased. In addition, electric cars are becoming more efficient. For example, the Nissan Leaf and the Chevrolet Volt, have undergone improvements to increase their efficiencies compared to the original models launched in 2010, and other even more efficient BEV models, such as the most lightweight and efficient BMW i3, have entered the market.[182]
National Bureau of Economic Research[]
One criticism to the UCS analysis and several other that have analyze the benefits of PEVs is that these analysis were made using average emissions rates across regions instead of marginal generation at different times of the day. The former approach does not take into account the generation mix within interconnected electricity markets and shifting load profiles throughout the day.[183][184] An analysis by three economist affiliated with the National Bureau of Economic Research (NBER), published in November 2014, developed a methodology to estimate marginal emissions of electricity demand that vary by location and time of day across the United States. The study used emissions and consumption data for 2007 through 2009, and used the specifications for the Chevrolet Volt (all-electric range of 35 mi (56 km)). The analysis found that marginal emission rates are more than three times as large in the Upper Midwest compared to the Western U.S., and within regions, rates for some hours of the day are more than twice those for others.[184] Applying the results of the marginal analysis to plug-in electric vehicles, the NBER researchers found that the emissions of charging PEVs vary by region and hours of the day. In some regions, such as the Western U.S. and Texas, CO2 emissions per mile from driving PEVs are less than those from driving a hybrid car. However, in other regions, such as the Upper Midwest, charging during the recommended hours of midnight to 4 a.m. implies that PEVs generate more emissions per mile than the average car currently on the road. The results show a fundamental tension between electricity load management and environmental goals as the hours when electricity is the least expensive to produce tend to be the hours with the greatest emissions. This occurs because coal-fired units, which have higher emission rates, are most commonly used to meet base-level and off-peak electricity demand; while natural gas units, which have relatively low emissions rates, are often brought online to meet peak demand. This pattern of fuel shifting explains why emission rates tend to be higher at night and lower during periods of peak demand in the morning and evening.[184]
Environmental footprint[]
In February 2014, the Automotive Science Group (ASG) published the result of a study conducted to assess the life-cycle of over 1,300 automobiles across nine categories sold in North America. The study found that among advanced automotive technologies, the Nissan Leaf holds the smallest life-cycle environmental footprint of any model year 2014 automobile available in the North American market with minimum four-person occupancy. The study concluded that the increased environmental impacts of manufacturing the battery electric technology is more than offset with increased environmental performance during operational life. For the assessment, the study used the average electricity mix of the U.S. grid in 2014.[185] In the 2014 mid-size cars category, the Leaf also ranked as the best all-around performance, best environmental and best social performance. The Ford Focus Electric, within the 2014 compact cars category, ranked as the best all-around performance, best environmental and best social performance. The Tesla Model S ranked as the best environmental performance in the 2014 full-size cars category.[186]
Charging infrastructure[]
As of February 2020, the United States had 84,866 charging points across the country, up from 19,472 in December 2013.[187][188] California led with 26,219 stations, followed by New York with 4,541. There were 592 CHAdeMO quick charging stations across the country by April 2014.[189]
Among the charging networks are Electrify America, launched in May 2019 as part of VW's settlement for the Dieselgate emissions scandal, and the , announced in March 2021, a group of six major power utilities in the Southeast and Midwest installing EV charging across 16 states, with the first chargers targeted for opening in 2022.[190][191]
| Top fifteen states ranked by number of public charging points available in the United States (as of February 2020)[187] | |||
|---|---|---|---|
| State | Number of points |
State | Number of points |
| California | 26,219 | Colorado | 2,440 |
| New York | 4,541 | Massachusetts | 2,376 |
| Texas | 4,497 | Missouri | 2,029 |
| Florida | 4,096 | Illinois | 1,933 |
| Washington | 3,016 | Maryland | 1,919 |
| Georgia | 2,910 | Total U.S. | 84,866 |
| Note: The U.S. DoE Alternative Fuels Data Center counts electric charging units or points, or EVSE, as one for each outlet available, and does not include residential electric charging infrastructure. Number of public charging points as of 2 February 2020.[187] | |||

Car2Go made San Diego the only North American city with an all-electric carsharing fleet when it launched service in 2011. As of March 2016, the carsharing service has 40,000 members and 400 all-electric Smart EDs in operation. However, due to lack of enough charging infrastructure Car2Go decided to replace all of its all-electric car fleet with gasoline-powered cars starting on 1 May 2016. When the carsharing service started Car2Go expected 1,000 charging stations to be deployed around the city, but only 400 were in place by early 2016. As a result, an average of 20% of the carsharing fleet is unavailable at any given time because the cars are either being charged or because they don't have enough electricity in them to be driven. Also, many of the company's San Diego members say they often worry their Car2Go will run out of charge before they finish their trip.[192] Car2Go merged with ReachNow into Share Now, which closed its North American operations in February 2020.
Charging stations by state[]
EV Charging by State
| State | Number of public EV charging stations[193] |
|---|---|
| Alabama | 714 |
| Alaska | 126 |
| Arizona | 1,881 |
| Arkansas | 540 |
| California | 24,224 |
| Colorado | 2,710 |
| Connecticut | 1,178 |
| Delaware | 244 |
| District of Columbia | 561 |
| Florida | 5,168 |
| Georgia | 3,013 |
| Hawaii | 610 |
| Idaho | 413 |
| Illinois | 2,220 |
| Indiana | 1,102 |
| Iowa | 796 |
| Kansas | 820 |
| Kentucky | 707 |
| Louisiana | 418 |
| Maine | 679 |
| Maryland | 2,380 |
| Massachusetts | 2,568 |
| Michigan | 2,507 |
| Minnesota | 1,944 |
| Mississippi | 383 |
| Missouri | 1,386 |
| Montana | 454 |
| Nebraska | 430 |
| Nevada | 1,219 |
| New Hampshire | 370 |
| New Jersey | 1,675 |
| New Mexico | 607 |
| New York | 4,970 |
| North Carolina | 2,266 |
| North Dakota | 219 |
| Ohio | 2,266 |
| Oklahoma | 896 |
| Oregon | 2,204 |
| Pennsylvania | 2,264 |
| Rhode Island | 263 |
| South Carolina | 841 |
| South Dakota | 395 |
| Tennessee | 1,448 |
| Texas | 4,734 |
| Utah | 1,787 |
| Vermont | 786 |
| Virginia | 2,265 |
| Washington | 3,840 |
| West Virginia | 370 |
| Wisconsin | 1,339 |
| Wyoming | 299 |
Plug-in Electric Vehicle Readiness Index[]

Researchers from the Indiana University School of Public and Environmental Affairs developed an index that identifies and ranks the municipal plug-in electric vehicle readiness ("PEV readiness"). The evaluation ranked the U.S. 25 largest cities by population along with five other large cities that have been included in other major PEV studies. The rankings also included the largest cities in states that joined California zero-emissions vehicle goal. A total of 36 major U.S. cities were included in the study. The evaluation found that Portland, Oregon ranks at the top of the list of major American cities that are the most ready to accommodate plug-in electric vehicles.[194]
Readiness is the degree to which adoption of electric vehicles is supported, as reflected in the presence of various types of policy instruments, infrastructure development, municipal investments in PEV technology, and participation in relevant stakeholder coalitions. The study also compares cities within states that participate in the Zero Emission Vehicle program, with those that do not, with the objective to understand whether participation in that program has a meaningful impact on PEV readiness.[194][195]
In order to accelerate the adoption of plug-in electric vehicles (PEV), many municipalities, along with their parent states, offer a variety of benefits to owners and operators of PEVs to make PEV adoption easier and more affordable. All six cities in the top of the ranking offer purchase incentives for PEVs and charging equipment. Four of the six offer time-of-use electricity rates, which makes overnight charging more affordable. The top-ranking cities also score well in categories such as public charging station density, special parking privileges, access to high occupancy vehicle (HOV) lanes, and streamlined processes for installing charging equipment. Those services and incentives are largely absent from the bottom six cities.[194]
The following is the full ranking of the 36 U.S. cities in 25 states included in the evaluation of PEV readiness:
| Ranking of 36 major U.S. cities by their "Plug-in Electric Vehicle Readiness" | |||||
|---|---|---|---|---|---|
| Rank | City/state | Rank | City/state | Rank | City/state |
| 1 | Portland, Oregon | 13 | Indianapolis, Indiana | 25 | Newark, New Jersey |
| 2 | Washington, D.C. | 14 | Orlando, Florida | 26 | Raleigh, North Carolina |
| 3 | Baltimore, Maryland | 15 | San Diego, California | 27 | Burlington, Vermont |
| 4 | New York City, NY | 16 | Seattle, Washington | 28 | Philadelphia, Pennsylvania |
| 5 | Denver, Colorado | 17 | San Jose, California | 29 | San Antonio, Texas |
| 6 | Los Angeles, California | 18 | Hartford, Connecticut | 30 | Charlotte, North Carolina |
| 7 | Atlanta, Georgia | 19 | Phoenix, Arizona | 31 | Memphis, Tennessee |
| 8 | Chicago, Illinois | 20 | Fort Worth, Texas | 32 | Detroit, Michigan |
| 9 | Austin, Texas | 21 | Honolulu, Hawaii | 33 | El Paso, Texas |
| 10 | San Francisco, California | 22 | Nashville, Tennessee | 34 | Portland, Maine |
| 11 | Boston, Massachusetts | 23 | Dallas, Texas | 35 | Providence, Rhode Island |
| 12 | Houston, Texas | 24 | Jacksonville, Florida | 36 | Columbus, Ohio |
| Source: Indiana University School of Public and Environmental Affairs (2016).[194] | |||||
Markets and sales[]
National market[]

Cumulative sales of highway legal plug-in electric cars in the U.S. since 2010 totaled 2,137,480 at the end of September 2021.[4] As of August 2020, the U.S. stock consisting of 1,008,118 electric cars (62.7%) and 600,143 plug-in hybrids (37.3%).[5][197] As of December 2019, the American stock represented 20% of the global plug-in car fleet in use, down from about 40% in 2014.[6][198] Sales in the American market are led by California with 668,827 plug-in electric vehicles sold up until 2019.[199][13]
As of December 2014, the United States had the world's largest stock of light-duty plug-in electric vehicles, and led annual plug-in car sales in calendar year 2014.[200][201] By May 2016, the European stock of light-duty had surpassed the U.S.[202] By the end of September 2016, the Chinese stock of plug-in passenger cars reached the level of the American plug-in stock,[203] and by November 2016, China's cumulative total plug-in passenger vehicles sales had surpassed those of Europe, allowing China to become the market with the world's largest stock of light-duty plug-in electric vehicles.[200][204] China also surpassed both the U.S. and Europe in terms of annual sales of light-duty plug-in electric vehicles since 2015.[205]

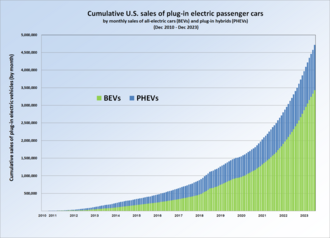
National sales increased from 17,800 units delivered in 2011 to 53,200 during 2012, and reached 97,100 in 2013, up 83% from the previous year.[209] During 2014 plug-in electric car sales totaled 123,347 units, up 27.0% from 2013, and fell to 114,248 units in 2015, down 7.4% from 2014.[8] A total of 157,181 plug-in cars were sold in 2016, up 37.6% from 2015,[210] rose to 199,818 in 2017, and achieved a record sales volume of 361,307 units in 2018.[16] Sales declined in 2019 to 329,528 units.[17]
The market share of plug-in electric passenger cars increased from 0.14% in 2011 to 0.37% in 2012, 0.62% in 2013, and reached 0.75% of new car sales in 2014.[7][211][8] As plug-in car sales slowed down during the 2015, the segment's market share fell to 0.66% of new car sales,[8][212] then increased to 0.90% in 2016.[15] The market share passed the 1% mark for the first time in 2017 (1.13%).[9] Then in 2018 the take-rate rose to 2.1%,[10] but declined to 1.9% in 2019.[11]

In July 2016, the Volt became the first plug-in vehicle in the American market to achieve the 100,000 unit sales milestone.[215] Leaf sales achieved the 100,000 unit milestone in October 2016, becoming the first all-electric vehicle in the country to pass that mark.[216] The Model S achieved the mark of 100,000 sales in the U.S. in June 2017, launched in June 2012, the Model S hit this milestone quicker than both the Volt and the Leaf.[217][218] Launched in July 2017, the Tesla Model 3 reached the 100,000 unit milestone in November 2018, hitting this milestone quicker than any previous model sold in the U.S.[219]
As of December 2018, the Chevrolet Volt plug-in hybrid listed as the all-time best selling plug-in electric car with 152,144 units of both generations.[220] The Model S was the best selling plug-in car in the U.S. for three consecutive years, from 2015 to 2017,[14] and the Model 3 topped sales in 2018 and 2019.[16][17] The Model 3 surpassed in 2019 the discontinued Chevrolet Volt to become the all-time best selling plug-in car in U.S. history, with an estimated 300,471 units delivered since inception, followed by the Tesla Model S all-electric car with about 157,992, and the Chevrolet Volt with 157,054.[1]
Sales by powertrain[]
As of December 2014, cumulative sales of plug-in electric vehicles in the U.S. since December 2010 were led by plug-in hybrids, with 150,946 units sold representing 52.7% of all plug-in car sales, while 135,444 all-electric cars (47.3%) had been delivered to retail customers.[196] During 2015, the all-electric segment grew much faster, with a total of 72,303 all-electric cars sold, up 6.6% year-on-year, while plug-in hybrid were down 22.4% year-on-year, with 42,959 units sold.[8] These results reversed the trend, and as of December 2015, a total of 206,508 all-electric cars and 193,904 plug-in hybrids have been sold since 2010, with all-electrics now representing 51.6% of cumulative sales.[196][222] The lead of battery electric cars continued in 2016, with 84,246 all-electrics sold, up 18.4% from 2015, representing 53.6% of the plug-in segment 2016 sales, while sales of plug-in hybrids totaled 72,935 unis, up 69.1% from 2015.[210] As of August 2016, the distribution of cumulative sales since 2010 between these two technologies is 52.8% all-electrics and 47.2% plug-in hybrids.[223]
Sales growth[]

Sales of series production plug-in cars during its first two years in the U.S. market were lower than the initial expectations.[22][23][25][225] Cumulative plug-in electric car sales since 2008 reached the 250,000 units in August 2014,[226] 500,000 in August 2016,[223] and the one million goal was achieved in September 2018.[26][27]
According to the U.S. Department of Energy, combined sales of plug-in hybrids and battery electric cars are climbing more rapidly and outselling by more than double sales of hybrid-electric vehicles over their respective 24 month introductory periods, as shown in the graph at the right.[84]
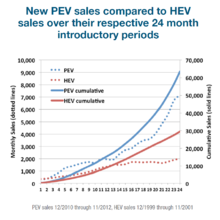
A more detailed analysis by the Office of Energy Efficiency and Renewable Energy over the same two-year introductory periods found that except for the initial months in the market, monthly sales of the Volt and the Leaf have been higher than the Prius HEV, and the Prius PHEV has outsold the regular Prius during its 8 months in the market. Over the first 24 months from introduction, the Prius HEV achieved monthly sales of over 1,700 in month 18, the Leaf achieved about 1,700 units in month 7, the Prius PHEV achieved nearly 1,900 sales in month 8, and the Volt achieved more than 2,900 sales in month 23.[227] A 2016 analysis by the Consumer Federation of America (CFA) found that 5 years after its introduction, sales of plug-in electric cars in the U.S. continued to outsell conventional hybrids. The analysis considered sales between January 2011 and December 2015.[228]
An analysis by Scientific American found a similar trend at the international level when considering the global top selling PEVs over a 36-month introductory period. Monthly sales of the Volt, Prius PHV and Leaf are performing better than the conventional Prius during their respective introductory periods, with the exception of the Mitsubishi i-MiEV, which has been outsold most of the time by the Prius HEV over their 36-month introductory periods.[229]
Key market features[]
According to Edmunds.com, leasing of plug-in cars instead of purchasing is dominant in the American market, with leasing accounting for 51% of all new all-electric cars and 73% of plug-in hybrids, compared with just 32% of gasoline-powered cars in 2016.[230]

As of 2016, the market of used plug-in electric cars is concentrated in California, the state with the biggest pool of used plug-in vehicles, especially all-electrics, followed by Colorado, Florida, Georgia, New York, Oregon and Texas. With the exception of used Teslas, all models depreciate more rapidly than conventionally powered cars and trucks. For all-electric cars depreciation varies between 60% to 75% in three years. In contrast, most conventionally powered vehicles in the same period depreciate between 45% to 50% . The Tesla Model S is more like conventional cars, with three-year depreciation of about 40%. And plug-in hybrids depreciate less than all-electric cars but still depreciate faster than conventionally powered cars.[230]
Researchers from the University of California, Davis conducted a study to identify the factors influencing the decision to adopt high-end battery electric vehicles (BEV), such as the Tesla Model S, as these vehicles are remarkably different from mainstream BEVs. Based on a questionnaire responded by 539 high-end adopters and in-depth interviews with 33 adopters, the 2016 study found that "environmental, performance, and technological motivations are reasons for adoption; the new technology brings a new segment of buyers into the market; and financial purchase incentives are not important in the consumer’s decision to adopt a high-end BEV."[231]
Car dealers' reluctance to sell[]
With the exception of Tesla Motors, almost all new cars in the United States are sold through dealerships, so they play a crucial role in the sales of electric vehicles, and negative attitudes can hinder early adoption of plug-in electric vehicles.[232][233] Dealers decide which cars they want to stock, and a salesperson can have a big impact on how someone feels about a prospective purchase. Sales people have ample knowledge of internal combustion cars while they do not have time to learn about a technology that represents a fraction of overall sales.[232] As with any new technology, and in the particular case of advanced technology vehicles, retailers are central to ensuring that buyers, especially those switching to a new technology, have the information and support they need to gain the full benefits of adopting this new technology.[233] A 2016 study indicated that 60% of Americans were not aware of electric cars.[234]
There are several reasons for the reluctance of some dealers to sell plug-in electric vehicles. PEVs do not offer car dealers the same profits as gasoline-powered cars. Plug-in electric vehicles take more time to sell because of the explaining required, which hurts overall sales and sales people commissions. Electric vehicles also may require less maintenance, resulting in loss of service revenue, and thus undermining the biggest source of dealer profits, their service departments. According to the National Automobile Dealers Association (NADS), dealers on average make three times as much profit from service as they do from new car sales. However, a NADS spokesman said there was not sufficient data to prove that electric cars would require less maintenance.[232] According to the New York Times, BMW and Nissan are among the companies whose dealers tend to be more enthusiastic and informed, but only about 10% of dealers are knowledgeable on the new technology.[232]

A study conducted at the Institute of Transportation Studies (ITS), at the University of California, Davis (UC Davis) published in 2014 found that many car dealers are less than enthusiastic about plug-in vehicles. ITS conducted 43 interviews with six automakers and 20 new car dealers selling plug-in vehicles in California's major metro markets. The study also analyzed national and state-level J.D. Power 2013 Sales Satisfaction Index (SSI) study data on customer satisfaction with new car dealerships and Tesla retail stores. The researchers found that buyers of plug-in electric vehicles were significantly less satisfied and rated the dealer purchase experience much lower than buyers of non-premium conventional cars, while Tesla Motors earned industry-high scores. According to the findings, plug-in buyers expect more from dealers than conventional buyers, including product knowledge and support that extends beyond traditional offerings.[233][235]
In 2014 Consumer Reports published results from a survey conducted with 19 secret shoppers that went to 85 dealerships in four states, making anonymous visits between December 2013 and March 2014. The secret shoppers asked a number of specific questions about cars to test the salespeople's knowledge about electric cars. The consumer magazine decided to conduct the survey after several consumers who wanted to buy a plug-in car reported to the organization that some dealerships were steering them toward gasoline-powered models. The survey found that not all sales people seemed enthusiastic about making PEV sales; a few outright discouraged it, and even one dealer was reluctant to even show a plug-in model despite having one in stock. And many sales people seemed not to have a good understanding of electric-car tax breaks and other incentives or of charging needs and costs. Consumer Reports also found that when it came to answering basic questions, sales people at Chevrolet, Ford, and Nissan dealerships tended to be better informed than those at Honda and Toyota. The survey found that most of the Toyota dealerships visited recommended against buying a Prius Plug-in and suggested buying a standard Prius hybrid instead. Overall, the secret shoppers reported that only 13 dealers "discouraged sale of EV," with seven of them being in New York. However, at 35 of the 85 dealerships visited, the secret shoppers said sales people recommended buying a gasoline-powered car instead.[236]
The ITS-Davis study also found that a small but influential minority of dealers have introduced new approaches to better meet the needs of plug-in customers. Examples include marketing carpool lane stickers, enrolling buyers in charging networks, and preparing incentive paperwork for customers. Some dealers assign seasoned sales people as plug-in experts, many of whom drive plug-ins themselves to learn and be familiar with the technology and relate the cars' benefits to potential buyers. The study concluded also that carmakers could do much more to support dealers selling PEVs.[233]
Regional markets[]
Concentration relative to population[]
As of July 2016, the U.S. average concentration was 1.51 plug-in cars registered per 1,000 people, while California's concentration was 5.83 registrations per 1,000 people. At the time, only Norway exceeded California's plug-in concentration per capita, by 3.69 times.[237][238] As of December 2017, the average national ownership per capita rose to 2.21 plug-ins per 1,000 people.[239]
In 2017 eight states had more than two plug-in vehicles registered per 1,000 people, of which, three are located in the West Coast. California had the highest concentration with 8.64 plug-ins per 1,000 people. Hawaii ranked second (5.12) followed by Washington (4.06), Oregon (3.84) Vermont (3.73), Colorado (2.33), Arizona (2.29), and Maryland (2.03).[239] Mississippi (0.20), Arkansas (0.28), West Virginia (0.30), Louisiana (0.31), Wyoming (0.37), and North Dakota (0.39) had the lowest concentration of plug-in cars in 2017.[239] In terms of growth from 2016 to 2017 for plug-in vehicle registrations per capita, five states had growth rates of 50% or higher: Vermont (56.4%) Maryland (54.2%), Massachusetts (52.5%), New Hampshire (50.2%), and Alaska (50.0%). The U.S. average growth rate from 2016 to 2017 was 30.2%.[240]

[]
The following table summarizes the ten states and metropolitan areas leading all-electric car adoption in terms of their market share of new light-vehicle registrations or sales during 2013 and 2014.
| Rank 2014(1) |
State[241] | Market share(2) 2014 CYTD(1) |
Rank 2013 |
State[241] | Market share(2) 2013 |
Rank | Metro area[242] | Market share 2013-2014(3) | |
| 1 | Georgia | 1.60% | 1 | Washington | 1.40% | 1 | San Francisco-Oakland-San Jose | 3.33% | |
| 2 | California | 1.41% | 2 | California | 1.28% | 2 | Atlanta | 2.15% | |
| 3 | Washington | 1.13% | 3 | Hawaii | 1.21% | 3 | Seattle-Tacoma | 1.83% | |
| 4 | Hawaii | 1.04% | 4 | Georgia | 0.94% | 4 | Honolulu | 1.71% | |
| 5 | Oregon | 0.67% | 5 | Oregon | 0.89% | 5 | Monterey-Salinas | 1.51% | |
| 6 | Utah | 0.31% | 6 | Washington, D.C. | 0.52% | 6 | San Diego | 1.34 % | |
| 7 | Colorado | 0.27% | 7 | Colorado | 0.33% | 7 | Santa Barbara-Santa Maria-San Luis Obispo | 1.29% | |
| 8 | Arizona | 0.20% | 8 | Utah | 0.31% | 8 | Portland | 1.25% | |
| 9 | Tennessee | 0.19% | 9 | Tennessee | 0.28% | 9 | Los Angeles | 1.08% | |
| 10 | Connecticut | 0.19% | 10 | Illinois | 0.25% | 10 | Eugene | 0.86% | |
| U.S. average | 0.32%[241] | 0.38%[243] | |||||||
| Notes: (1) CYTD: current year-to-date sales as of 30 June 2014 (2) New all-electric vehicle (BEV) registrations as % of total new registrations of light-vehicles only. (3) Sales of new all-electric vehicles as % of total new light-vehicle sales between April 2013 and March 2014. | |||||||||
A total of 52% of American plug-in electric car registrations from January to May 2013 were concentrated in five metropolitan areas: San Francisco (19.5%), Los Angeles (15.4%), Seattle (8.0%), New York (4.6%) and Atlanta (4.4%).[244][245] From January to July 2013, the three cities with the highest all-electric car registrations were all located in California, Atherton and Los Altos in the Silicon Valley, followed by Santa Monica, located in Los Angeles County.[246][247]
California[]


Governor Jerry Brown issued an executive order in March 2012 that established the goal of getting 1.5 million zero-emission vehicles (ZEVs) in California by 2025.[31][32] In January 2018, Governor Brown set a new goal of getting a total of 5 million zero-emission vehicles in California by 2030.[250] As of December 2020, cumulative sales totaled 834,518 plug-in electric vehicles registered, making California the leading plug-in market in the country.[12][251][252]
Until December 2014 California not only had more plug-in electric vehicles than any other American state but also more than any other country in the world.[253][254] In 2015 only two countries, Norway (22.4%) and the Netherlands (9.7%), achieved a higher plug-in market share than California.[255] By November 2016, with about 250,000 plug-in cars sold in the state since 2010, China was the only country market that exceeds California in terms of cumulative plug-in electric car sales.[256]
California's plug-in car market share was 3.5% of new car sales in 2016, while the U.S. take-rate was 0.90%.[210][257] In 2017, the state's market share reached nearly 5%, while the national share was 1.1%.[258][250][9] The plug-in market share rose to 7.8% in 2018, ahead of conventional hybrids (4.2%), with the all-electric segment reaching for the first time a higher take-rate as conventional hybrids.[248][259] The combined take-rate of plug-in cars in California slightly declined to 7.7% in 2019.[199]
- Incentives
California has been a leader in the promotion of plug-in electric vehicles as the state has in place several financial and non-financial incentives. In addition to the existing federal tax credit, plug-ins are eligible for a purchase rebate through the Clean Vehicle Rebate Project (CVRP).[49] Also, zero emission vehicles (ZEVs) and Enhanced Advanced Technology Partial Zero Emission Vehicle (Enhanced AT PZEV), have been entitled to a clean air sticker that allows the vehicle to be operated by a single occupant in California's carpool or high-occupancy vehicle lanes (HOV).[260] The limits for plug-in hybrids and expiration dates have been extended several times, and new rules went into force from January 1, 2019.[261][262]
In March 2016 California added income-based caps to its rebate system. Buyers with incomes less than 300% of the Federal poverty level get up to US$3,000 for a plug-in hybrid, US$4,000 for an all-electric car, and US$6,500 for a hydrogen fuel-cell car.[263] The income-base caps went into effect on 1 November 2016. Residents are not eligible for rebates if their gross annual income exceeds US$150,000 for single tax filers, US$204,000 for head of household filers and US$300,000 for joint filers.[264][265]
Georgia[]
Georgia ranked second in the U.S. after California in terms of total plug-in electric vehicles on the road by mid-2014 .[266] During the first half of 2014 Georgia ranked as the top selling all-electric car market in the U.S. at the state level with a 1.6% share of new light-vehicle registrations, ahead of California (1.41%), and up from 0.94% during 2013.[241] As of August 2014, there were about 12,000 electric vehicles registered in the state, of which, about 80% are registered in metro Atlanta's five core counties.[267] In the 12 months between April 2013 and March 2014, metro Atlanta was the second top selling all-electric car metropolitan market in the U.S., with a market share of 2.15% of total new light-vehicle sales in the state, 5.6 times the national average share of 0.38%.[243] Savannah ranks second in the state after Atlanta, with a market share of 0.13% of total new light-vehicle sales.[242]
Between August 2013 and May 2014, Atlanta was the top U.S. metropolitan market for the Nissan Leaf for eight out of the ten months,[243] and until July 2013, Atlanta was the third largest Leaf market behind San Francisco and Los Angeles.[268] Leaf sales are favored by Georgia's law, which caps sales of electric vehicles sold direct by a manufacturer to 150, setting a restrictive limit to Tesla Model S sales, and the law excluded plug-in hybrids for eligibility to the state's tax credit.[243]
- Tax credits
The State of Georgia considers alternative fuel vehicles (AFVs) those that run solely on alternative fuel and do not run on regular gasoline. AFVs includes vehicles that operate using battery electricity, propane, natural gas, and hydrogen fuel cell.[269] As incentives to accelerate all-electric vehicle adoption, in addition to the existing US$7,500 federal tax credit, Georgia offers an income tax credit of 20% of the vehicle cost up to US$5,000 for the purchase or leasing of a zero emission vehicle (ZEV). Plug-in hybrids are not eligible for this incentive because sometimes they are powered by electricity from their on-board combustion engine. There is also a 10% tax credit up to US$2,500 for the purchase and installation of qualified electric vehicle charger. This tax credit applies only to non-retail business enterprises and chargers installed at homes do not qualify.[58]

An income tax credit for the purchase of a new commercial medium-duty or heavy-duty AFVs started on July 1, 2015. Medium-duty hybrid electric vehicles also qualify. Eligible medium-duty AFVs with a gross vehicle weight rating (GVWR) between 8,500 to 26,001 lb (3,856 to 11,794 kg) qualify for a credit of up to US$12,000, while heavy-duty AFVs with a GVWR over 26,001 lb (11,794 kg) qualify for a credit of up to US$20,000. The credit is capped at US$250,000 per taxpayer. Qualified AFVs must be purchased before June 30, 2017, remain registered in Georgia for at least five years, and accumulate at least 75% of their annual mileage in Georgia. Up to US$2.5 million in total credits will be available each fiscal year.[270]
- Access to HOV lanes
The definition of alternate fuel vehicle for the purposes of an AFV License Plate in Georgia is different from the one for tax credit purposes. The Official Code of Georgia Annotated defines an AFV as a vehicle that has been certified by the EPA in accordance with the Federal Clean Air Act, therefore, both all-electric vehicles and plug-in hybrids are eligible for Georgia's AFV license plate.[271] All vehicles displaying a GA alternative fuel license plate are allowed to use high occupancy vehicle lanes (HOV) regardless of number of passengers. Alternative fuel vehicles displaying the proper alternative fuel license plat may obtain a Peach Pass electronic tag that grants them toll-free access to all Peach Pass controlled high-occupancy toll lanes (HOT) lanes.[272]
- Time-of-use electricity rates
Georgia Power, the primary utility in Atlanta, offers a time-of-use electric vehicle plan designed for plug-in charging. As of September 2014, the plan has about 1,500 customers statewide.[273] For a monthly fee of US$10, the utility lowers the overnight rate to 1.3 cents per Kilowatt hour (kWh) while raising the peak rate, from 2-7 p.m. from June through September, to 20.3 cents per kWh. There is also a shoulder rate of 6.2 cents per Kwh in between those times.[273] The average U.S. rate is 11.88 cents per kWh.[243]
- Charging infrastructure
As of April 2014, Georgia had 238 charging stations with 548 public outlets available across the state.[187] Of these, about 120 public charging stations are located in metro Atlanta, with only about half of these located inside the city limits of Atlanta. Considering the rapid growth of electric cars in the city, there is a shortage of charging infrastructure relative to supply of electric vehicles.[267]
The city of Atlanta is considering legislation to attend the needs of electric car owners and others who want to provide electric vehicle charging at their business, multifamily dwelling or private home. The measure aims to remove a major barrier to owning an electric vehicle by encouraging office and residential landlords to install electric vehicle chargers and reserved parking. Under the proposal, each electric vehicle charging station would be counted as one parking space, and the minimum parking requirement for developers and builders would be reduced by one space for each charging station provided, allowing up to a 10% reduction in minimum parking requirements. The city also wants to simplify the process required to obtain a permit to install electric vehicle chargers and make the spaces more identifiable.[267]
Hawaii[]

Hawaii has a high potential for mass adoption of plug-in electric vehicles due to the limited driving range imposed by the island geographies, and its high fuel costs, with gasoline prices, as of September 2013, ranging between US$4.25 and US$5.00 a gallon.[274][275] The number of registered plug-in electric vehicles increased from 581 units in 2011, to 967 in 2012,[276] and reached 1,551 units in June 2013.[277] As of August 2014, a total of 2,821 plug-in highway legal plug-in electric cars have been registered in Hawaii.[278]
In terms of EV adoption, Hawaii ranked in 2013 as the state with the third highest all-electric car market share with 1.21% of new car sales, and during the first half of 2014 ranked fourth with a 1.04% market share.[241] Accounting for sales of pure electric cars between April 2013 and March 2014, the Honolulu metropolitan area ranks as the fourth top selling BEV metro market in the United States, with 1.71% of new car sales.[242]
In January 2011 the state implemented a purchase rebate of up to US$5,000 available for both the purchase of a plug-in electric car purchase and a charging station, but limited to US$4,500 for the vehicle.[279] The rebate ended in May 2012 as high consumer demand depleted the fund. More than 450 rebates were issued totaling about US$2 million. Several efforts to add more funds were unsuccessful.[280]
Maryland[]

As of December 2015, there were 2,282 all-electric cars registered in Maryland. Sales of the Nissan Leaf and Tesla Model S account for about 70% of the electrics registered in the state.[281] As part of the incentives to promote electric vehicle adoption, drivers of approved plug-in electric vehicles can use Maryland's high occupancy vehicle (HOV) lanes at all times, even if they are traveling solo. This incentive is in effect until September 30, 2017.[61]
Plug-in electric vehicles purchased new and titled for the first time between July 1, 2014, and July 1, 2017, are eligible for a credit up to US$3,000, calculated as US$125 per kWh of battery capacity. Buyers of PEVs may apply for a tax credit against the imposed excise tax. The credit is returned to the taxpayer in the form of a check from the state. The tax credit is limited to one vehicle per individual and 10 vehicles per business. A qualified vehicle must meet the following criteria:[282]
- Has a gross vehicle weight rating of 8,500 pounds or less;
- Can achieve a maximum speed of at least 55 miles per hour;
- Is a two-, three-, or four-wheeled vehicle;
- Is propelled to a significant extent by an electric motor that draws electricity from a battery with a capacity of at least four kilowatt-hours (kWh) in the case of a four-wheeled motor vehicle, or at least two and a half kWh in the case of a two- or three-wheeled motor vehicle;
- Has not been modified from original manufacturer specifications; and
- Is purchased after October 1, 2010.
The state also offers a US$900 rebate for buying and installation of wall connectorsfor individuals, US$5,000 for business, or state or local governments, and US$7,000 for retail service station dealers. Between July 1, 2014, and June 30, 2016, rebate amounts are equal to the previous amounts, up to 50% of the costs of acquiring and installing qualified chargers.[283]
New York[]
The stock of plug-in electric vehicles in New York climbed from 1,000 units in early 2012, to over 10,000 plug-in vehicles by mid-September 2,014. The state of New York set the goal to deploy up to 3,000 EV charging stations in public and workplace locations across the state by 2018. As of September 2014, there are about 1,000 charging stations.[284]
Plug-in electric vehicles and hybrid electric vehicles with a combined fuel economy rating of at least 45 mpg‑US (5.2 L/100 km; 54 mpg‑imp) and that also meet the California Air Resources Board SULEV emissions standard, are eligible for the Clean Pass Program. Eligible vehicles which display the Clean Pass vehicle sticker are allowed to use the Long Island Expressway HOV lanes, regardless of the number of occupants.[285] Drivers of qualified vehicles may also receive a 10% discount on established E-ZPass accounts with proof of registration.[67] In New York state there are no purchase incentives.
Oregon[]
As of November 2013, there were about 3,500 plug-in electric vehicles registered in Oregon.[286] In 2013 the state was the fifth top selling all-electric car market in the U.S. at the state level with a 0.89% market share of new light-vehicle registrations, more than twice the national average share of 0.32%. During the first half of 2014 Oregon BEV share fell to 0.67% but continued to rank in the fifth place among the top selling states.[241]
In the 12 months between April 2013 and March 2014, two metropolitan areas in Oregon ranked among the top ten selling all-electric car metropolitan markets in the U.S. Portland ranked eighth with a 1.25% market share of total new light-vehicle sales, ahead of Los Angeles metropolitan area, and Eugene ranked in number 10 with a market share of 0.86%. The national average share during this period was 0.38%.[242]
- Incentives
A US$1,500 tax credit for the purchase of a new all-electric vehicle is no longer available.[286][287] There is a tax credit up to US$750 to cover 25% of the cost of purchasing and installing an electric vehicle charger station, and 35% for business owners. Beginning January 1, 2015, business owners that purchase two or more all-electric vehicles may be eligible for a tax credit of 35% of eligible costs for the incremental cost of purchasing the vehicles. This incentive ends on December 31, 2018.[272]
- Electric Avenue

Electric Avenue is a joint research and development initiative of Portland State University (PSU), Portland General Electric (PGE), and the City of Portland. The Electric Avenue was launched in August 2011 to learn about the interaction and performance of charging stations and a variety of electric vehicles. The initiative also aimed to understand the charging preferences and travel patterns of electric vehicle visitors. The charging infrastructure includes quick chargers and both Level 1 and Level 2 charging stations powered by 100% renewable energy from PGE, and offers charging at standard city parking rates. The site comprises eight on street parking spaces with seven available charging stations located along an entire block. The Electric Avenue is located in the south end of downtown Portland, at the PSU's campus adjacent to Portland's Sixth Avenue Transit Mall where light rail trains, electric street cars, buses, cars, bikes, and pedestrians share a well-integrated personal and public transit corridor.[288]
Texas[]
Texas is the second largest light-duty vehicle market in the U.S. after California, with over 20 million passenger and light truck vehicles registered at the end of 2013.[289] As of May 2014, there were about 5,000 plug-in electric vehicles registered in the state.[290] Accounting for sales of new all-electric vehicles between April 2013 and March 2014, the top three selling metropolitan markets in Texas in terms of market share of total new light-vehicle sales were the Austin metropolitan area with 0.47%, followed by Dallas-Ft. Worth with 0.21% and Houston area with 0.15%.[242] The national average share for the period was 0.38%, with Austin ranking in 15th place, and together with metro Atlanta, the only two cities in the top 15 that are not located on the West Coast.[243]
In November 2013 the Texas Commission on Environmental Quality approved a rebate program to provide financial incentives up to US$2,500 for the purchase or lease of new eligible vehicles powered by compressed natural gas (CNG), liquefied petroleum gas (LPG), or plug-in electric drive with battery capacity larger than 4 kWh.[290] The rebate amount for leasing depends on the lease term, only 4-year lease terms are eligible for the full US$2,500, just like new car purchases.[291] Total funding for the program is US$7.7 million, and the maximum number of vehicles allowed is 2,000 units for each plug-in electric drive and natural gas/propane vehicles for the length of the program.[290][291] Only purchases made on or after May 13, 2014, are eligible to apply for a rebate, and the program ends June 26, 2015 or until funding ends. As of 22 September 2014, there were US$67 million remaining in the rebate fund.[292]

Among plug-in cars sold nationwide, the Tesla Model S is not eligible for the rebate because only new PEVs purchased or leased from a dealer or leasing company licensed to operate in Texas may qualify. Tesla Motors is not authorized to sell its vehicles in the state due to its direct-sales business model.[290][293][294] But customers can buy directly from the company's website like in any other state.
- Texas River Cities Plug-In Electric Vehicle Initiative
Despite the low penetration of plug-in electric vehicles in the state, the Texas River Cities Plug-In Electric Vehicle Initiative (TRC) is one of the most comprehensive plans for electric vehicles and their infrastructure aimed to increase the long-term success of PEV adoption. The TRC initiative encompasses two major metropolitan areas in and around Austin and San Antonio.[295] Austin Energy, one of the project partners, had deployed 239 utility-operated publicly accessible charging stations in the TRC region by 2012. The utility company is the recipient of the U.S. Department of Energy funding for this initiative. The TRC region is projected to have 4,259 PEVs in 2015 and 17,336 in 2020.[296]
- Pecan Street demonstration project
This demonstration project is run by the Pecan Street Inc., a University of Texas based research consortium of research and industry partners focused on developing and testing advanced technology, business model, and customer behavior surrounding energy management systems. The project is supported by a US$10.4 million smart grid demonstration grant from the U.S. Department of Energy and more than US$14 million in matching funds from the project partners. The demonstration project began in 2010 and is taken place with volunteer residents at the Mueller neighborhood, a planned green community in Austin. The Pecan Street hosts an electric vehicle research program and provides incentives to participants with rebates of US$3,000 and US$7,500 to lease or purchase a PEV that is in addition to the federal tax credits. Through the research program, Pecan Street is studying grid load and monitoring home energy use through management equipment. As a result of the incentive program, Mueller has more plug-in electric vehicles per capita than any other U.S. neighborhood.[297][298][299]
General Motors is a sponsor of the Pecan Street demonstration and is supporting the project to learn the charging patterns of plug-in electric car owners, and to study how a residential fleet of electric vehicles might strain the electric grid if all owners try to charge them at the same, which is what the preliminary monitoring found when the plug-in cars return home in the evening. As of June 2013, the community had nearly 60 Chevrolet Volt owners alone thanks to GM's commitment to match the federal government's US$7,500 rebate incentive, which halves the purchase price of the Volt.[300]
Washington[]
The state set a goal to have 50,000 electric or other clean vehicles on the road by 2020.[19] As of 30 June 2016, there were 30,701 battery-powered and plug-in electric cars registered in Washington.[301] The Seattle metropolitan area concentrated 76% of the state PEV registrations, with 18,154 plug-ins in King County (59%), where the city of Seattle is located, 3,153 in Snohomish County (10.3%), and 2,040 in Pierce County (6.6%). Outside the metro area, Clark County has the largest number of PEV registrations with 1,467 units (4.8%).[301]

Washington was the top selling all-electric car market in the U.S. at the state level in 2013 with a 1.40% market share of new light-vehicle registrations, ahead of California (1.28%). Washington PEV share in 2013 was more than four times the national average share of 0.32%.[241] In the 12 months between April 2013 and March 2014, Seattle-Tacoma metro ranked as the third top selling all-electric car metropolitan market with a 1.83% market share of total new light-vehicle sales, only behind San Francisco-Oakland-San Jose (3.33%) and Atlanta (2.15%).[242]
- Incentives
New passenger cars, light-duty trucks, and medium-duty passenger vehicles that operate exclusively on electricity, hydrogen, natural gas, or propane are exempt from state motor vehicle sales and use taxes. Qualified vehicles must also meet the California motor vehicle emissions standards, and comply with the rules of the Washington Department of Ecology.[302] The initial sales tax exemption expired on July 1, 2015.[302] The sales tax exemption was renewed on July 1, 2015, for four years, but the incentive was limited to new plug-in cars that cost less than US$35,000. The approved cap excludes what legislators considered as luxury cars such as Tesla Motors and BMW i electric models. The same legislations that extended the incentives through 2019, raised the annual registration renewal fee for plug-in car owners from US$100 to US$150. That annual fee is designed to make electric vehicle drivers contribute toward highway maintenance in lieu of the gas taxes PEVs do not pay.[303]
In April 2016 governor Jay Inslee signed legislation to provide up to about US$3,100 off the purchase or lease of a new car all-electric vehicle, or a plug-in hybrid with at least 30 mi (48 km) of all-electric range – such as the Chevrolet Volt and the BMW i3 REx. The new law also raises the previous purchase price cap to US$42,500, which will allow buyers of the Chevrolet Bolt EV, the next generation Nissan Leaf, and the Tesla Model 3 – all with 200 mi (320 km) of electric range – to be eligible for the incentive. The new law goes into effect on July 1, 2016. Under the updated scheme, the sales tax exemption applies to the first US$32,000 of the selling price of a qualifying new plug-in electric car, which translates into a tax savings between US$2,600 to US$3,100 for plug-in car buyers depending on where the dealer is located within the state, as the sales tax vary by county.[69][70] As of April 2016, the state sales tax is 6.5%, and increases up to 9.8% depending on the county rate.[69]
This tax exemption expired on May 31, 2018, because legislators established that the tax break would end the month after the number of qualifying vehicles sold in the state after June 15, 2015, reached 7,500.[304] The legislature brought back a new exemption starting August 1, 2019 with a US$45,000 price cap for the first US$25,000 of the selling price. This ramps down to US$20,000 on August 1, 2021, and US$15,000 on August 1, 2023, phasing out completely after July 31, 2025.[71][72]
Puget Sound Energy (PSE) provides a US$500 rebate to the first 5,000 qualified customers for the purchase and installation of Level 2 electric vehicle charging station (EVSE). Eligible applicants must be PSE residential electric schedule 7 customers, must be the registered owner of an electric vehicle, and must install the charging station within a specified timeframe. PSE expects the rebate program to remain available until November 1, 2016, depending on available funds.[305][306]
Sales by model[]
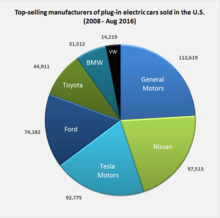
As of December 2018, there were 43 highway legal plug-in cars available in the American market for retail sales, 15 all-electric cars and 28 plug-in hybrids,[307] plus several models of electric motorcycles, utility vans and neighborhood electric vehicles (NEVs). As of November 2018, sales were concentrated to a few models, with the top 10 best selling plug-in cars accounting for about 84% of total sales during the first eleven months of 2018.[308] Car manufacturers are offering plug-in electric cars in the U.S. for retail customers under 21 brands or marques: Audi, BMW, Cadillac, Chevrolet, Chrysler, Fiat, Ford, Honda, Hyundai, Jaguar, Kia, Mercedes-Benz, MINI, Mitsubishi, Nissan, Porsche, Smart, Tesla, Toyota, Volkswagen, and Volvo.[309]
As of September 2016, only the Chevrolet Volt, Nissan Leaf, Tesla's Model S and Model X, BMW i3, Mitsubishi i, Porsche Panamera S E-Hybrid, Cadillac ELR, and Ford's C-Max and Fusion Energi plug-in hybrids were available nationwide. Several models, such as the Toyota RAV4, Fiat 500e, Honda Fit EV, and Chevrolet Spark EV, are compliance cars sold in limited markets, mainly California, available in order to raise an automaker's fleet average fuel economy to satisfy regulator requirements.[310][311][312][313]
As of November 2018, the top selling plug-in car manufacturers in the American market are Tesla with about 269,000 units delivered, GM with 203,941, Nissan with 126,875 units, Ford with 111,715, Toyota with 93,011 and the BMW Group with 79,679 plug-in electric cars.[45]
Top selling models[]

The Nissan Leaf was the U.S. top selling plug-in car in 2011 (9,674), and the Chevrolet Volt topped sales in 2012 (23,461).[7] Again in 2013, sales were led by the Chevrolet Volt with 23,094 units, followed by the Nissan Leaf with 22,610 cars, and the Tesla Model S with about 18,000 units.[314] In 2013 the Model S was the top selling car in the American full-size luxury sedan category, ahead of the Mercedes-Benz S-Class (13,303), the top selling car in the category in 2012.[314] In 2014 the Leaf took the sales lead, with 30,200 units sold, with the Volt ranking second with 18,805, followed by the Model S with 16,689 units.[8]
The Tesla Model S, with 25,202 units delivered, was the top selling plug-in car in 2015, followed by the Nissan Leaf with 17,269 units, and the Volt with 15,393.[8] Again in 2016, the Model S was the best selling plug-in car with about 29,156 units delivered, followed by the Volt with 24,739, and the Model X with about 18,028.[15] For the third consecutive year, the Tesla Model S was the top selling plug-in car with about 26,500 units sold in 2017, followed by the Chevrolet Bolt (23,297), Tesla Model X (~21,700).[9][315]
Sales in 2018 were led by the Tesla Model 3 with an estimated 139,782 units delivered, the first time a plug-in car sold more than 100 thousand units in a single year. Ranking next were the Toyota Prius Prime (27,595) and the Tesla Model X (~26,100).[16] Sales in 2019 were topped again by the Tesla Model 3 with an estimated 158,925 units delivered, followed by the Toyota Prius Prime (23,630), the Tesla Model X (19,225), the Chevrolet Bolt EV (16,418) and the Tesla Model S (14,100).[17]
The following table presents cumulative sales of the all-time top 10 best-selling highway-capable plug-in electric cars launched in the American market since 2008, with sales through December 2020.[16]
| Top 10 U.S. selling highway-capable plug-in electric passenger cars (produced between 2008 and December 2020 - cumulative sales since inception) | ||
|---|---|---|
| Model | Market launch |
Sales/Production |
 |
Jul 2017 | ~395,600 units sold through December 2020.[1][2] The Model 3 has been the top selling plug-in car in the U.S. for three consecutive years, from 2018 to 2019.[2][16][17] The electric sedan has been the U.S. top selling plug-in car every month since January 2018,[219][316][307] and reached the 100,000 unit milestone quicker than any previous EV model sold in the U.S.[219] In February 2019, the Model 3 became the U.S. all-time best selling plug-in car.[317][214] |
 (MY 2012)  (facelifted MY 2016) |
Jun 2012 | ~172,400 units sold through December 2020.[1][2] The Model S topped annual plug-in car sales in the U.S. between 2015 and 2017.[307] Until December 2018, the Model S was the U.S. all-time best selling all-electric car.[213] |
 first generation  second generation |
Dec 2010 | 157,125 Volts sold through December 2020 (both generations).[1][3] The Chevy Volt topped annual plug-in car sales in the U.S. in 2012 and 2013.[7][314] The Volt ranked as the U.S. all-time top selling plug-in electric car until January 2019.[213] Production of the first generation 2015 model year Volt ended in mid-May 2015.[318] Deliveries of the second generation Volt began in October 2015.[319] Production ended in February 2019.[320] The last 71 units were sold in 2020.[3] |
 first generation  second generation |
Dec 2010 | 151,471 Leafs sold through December 2020 (both generations).[1][321] The Leaf was the U.S. top selling plug-in car in 2011 and 2014.[7][8] |
 first generation  second generation |
Feb 2012 | Over 109,000 units sold through September 2019 (both generations).[1] A total of 44,767 first generation units sold through December 2016.[210][223][322][323] Production of the first generation Prius Plug-in ended in June 2015.[324] Dealerships run out of stock of the first generation model in September 2016.[325] Deliveries of the second generation Prius Prime began in November 2016.[326] |
 |
Sep 2015 | ~104,700 units sold through December 2020.[1][2] |
 |
Dec 2016 | 79,067 units sold through December 2020.[1][3] |
 |
March 2020 | 71,344 units sold through December 2020.[2] |
 |
Feb 2013 | More than 66,679 units sold through September 2019.[1] Production was scheduled to end by 2020, as part of Ford decision to discontinue in the North American market their entire passenger car line up.[327] |
 |
May 2014 | 43,496 units through December 2020 (both all-electric and REx models).[1][328] Until February 2017, the REx/BEV sales ratio was 3:1.[329]
|
Neighborhood electric vehicles[]
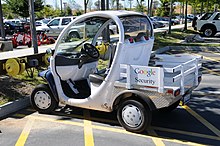
Low-Speed Vehicles (LSVs) are defined as "four-wheeled motor vehicles whose top speed is 20 to 25 mph (32 to 40 km/h) to be used in residential areas, planned communities, industrial sites, and other areas with low density traffic, and low-speed zones."[330] LSVs, more commonly known as neighborhood electric vehicles (NEVs), were defined in 1998 by the National Highway Traffic Safety Administration's Federal Motor Vehicle Safety Standard No. 500, which required safety features such as windshields and seat belts, but not doors or side walls.[331][332][333]
Since 1998 Global Electric Motorcars (GEM), the market leader in North America, has sold more than 50,000 GEM battery-electric vehicles worldwide as of October 2015.[334]
Modern production timeline[]
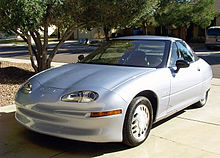


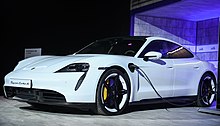
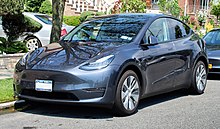

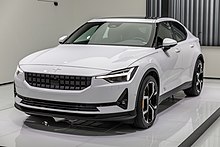

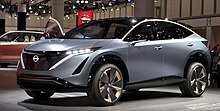


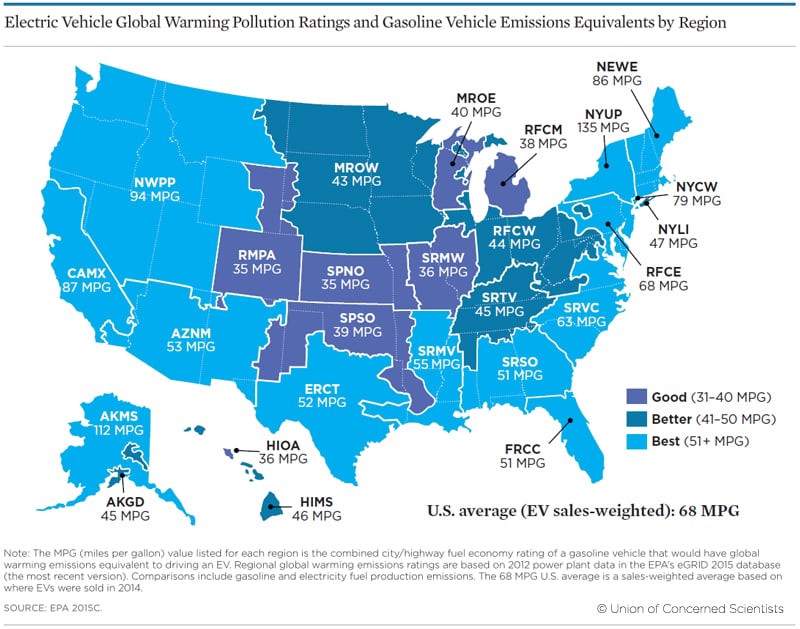
This is a list of all highway-capable plug-in electric vehicles available for retail customers in the U.S. for sale or leasing since the early 1990s.
1990-2003[]
- Chrysler TEVan (1993-1995)
- General Motors EV1 (1996-2003)
- Toyota RAV4 EV (1997-2003)
- Honda EV Plus (1997-1999)
- Nissan Altra (1998-2001)
- Dodge Caravan EPIC (1999 to 2001)
- Ford TH!NK City (1999-2003)
2008-2021[]
- 2008
- Tesla Roadster (production ended in 2011)
- 2009
- Mini E (demonstration program ended in 2011)
- 2010
- Chevrolet Volt (replaced by second generation in 2015)
- Nissan Leaf (replaced by second generation in 2017)
- Navistar eStar utility van
- 2011
- Th!nk City (no longer in production)
- Smart ED 2nd gen (available for leasing only)
- Wheego Whip LiFe (no longer in production)
- Fisker Karma (no longer in production)
- Azure Transit Connect Electric delivery van (no longer in production)
- Mitsubishi i (Mitsubishi i MiEV in the rest of the world)
- Smith Newton delivery truck
- 2012
- BMW ActiveE (demonstration program ended in 2014)
- Coda (no longer in production)
- Ford Focus Electric (limited production)
- Toyota Prius PHV (production ended in 2015)
- Boulder DV-500 delivery truck
- Amp Electric Vehicles (SUV and light truck conversions)
- Tesla Model S
- Honda Fit EV (limited production)
- Toyota RAV4 EV (2nd gen) (limited production)
- Ford C-Max Energi (production ended in 2018)
- 2013
- Honda Accord Plug-in Hybrid
- Ford Fusion Energi
- Scion iQ EV (limited production available only for carsharing fleets, not for retail customers)
- Smart electric drive 3rd gen (available with battery leasing option)
- Chevrolet Spark EV (limited production)
- Fiat 500e (limited production)
- Porsche Panamera S E-Hybrid
- Cadillac ELR (limited production)
- 2014
- BMW i3
- Porsche 918 Spyder (limited edition)
- Mercedes-Benz B-Class Electric Drive
- BMW i8 (production ended in 2020)
- Volkswagen e-Golf
- Kia Soul EV
- Porsche Cayenne S E-Hybrid
- 2015
- Mercedes-Benz S 500 Plug-in Hybrid
- Volvo XC 90 PHEV
- Tesla Model X
- Bolloré Bluecar (available only for the carsharing fleet - ended in 2020)
- Chevrolet Volt (second generation) (production ended in 2019)
- BMW X5 xDrive40e
- Hyundai Sonata PHEV
- Audi A3 Sportback e-tron
- Audi Q7 e-tron Quattro
- 2016
- BMW 330e iPerformance
- Mercedes-Benz GLE 550e Plug-in Hybrid
- Toyota Prius Prime (second generation Prius PHEV)
- Chevrolet Bolt EV
- BMW 740e iPerformance
- Mercedes-Benz C 350e Plug-in Hybrid
- 2017
- Chrysler Pacifica Hybrid
- BMW 530e iPerformance
- Tesla Model 3
- Kia Optima PHEV
- Honda Clarity Electric
- Honda Clarity Plug-in Hybrid
- Volvo XC60 Plug-in Hybrid
- Mini Cooper S E ALL4
- Hyundai Ioniq Electric
- Cadillac CT6 Plug-in Hybrid
- Volvo S90 T8 Plug-in Hybrid
- Mitsubishi Outlander P-HEV
- Nissan Leaf (second generation)
- 2018
- Hyundai Ioniq Plug-in
- Mercedes-Benz GLC 350e 4MATIC
- Karma Revero (updated version of the Fisker Karma)
- Jaguar I-Pace
- 2019
- Hyundai Kona
- Subaru Crosstrek Plug-in Hybrid
- Kia e-Niro
- Audi e-tron
- Mercedes-Benz EQC
- Porsche Taycan
- 2020
- Toyota RAV4 Prime
- Tesla Model Y
- Kandi K23 and K27
- SOLO (three-wheeler)
- Ford Mustang Mach-E
- Volvo V60 PHEV Engine Polestar
- Volvo S60 Plug-in Hybrid
- Polestar 1
- Polestar 2
- 2021
- Volkswagen ID.4
- Volvo XC40 Recharge
- Chevrolet Bolt EUV
- Ford Escape PHEV
- Lincoln Corsair Grand Touring PHEV
- Lucid Air
- Mazda MX-30
- Rivian R1T pickup truck
Future cars and trucks (2021–2023)[]
The following is a list of electric cars and plug-in hybrids with market launch in the United States scheduled up to 2023.
- Nissan Ariya
- GMC Hummer EV
- Ford F-150 Lightning
- Hyundai Ioniq 5
- Kia EV6
- BMW i4
- BMW iNext
- Mercedes-Benz EQS
- Cadillac Escalade EV
- Cadillac Lyriq
- Volvo C40 Recharge
- BrightDrop EV600
- Tesla Cybertruck
- Lordstown Endurance pickup truck
- Tesla Roadster second generation
- Toyota bZ4X
- Subaru Solterra
- Fisker eMotion
- Aptera (solar electric vehicle)
- Byton M-Byte
- Bollinger B1 and B2
- Bentley Continental Plug-In Hybrid
- Audi Q4 e-tron
- [335]
U.S. electric vehicle organizations[]
- CalCars (The California Cars Initiative)
- Drive Oregon
- Electric Auto Association (EAA) (North America)
- Electric Auto Association of Northern Nevada
- Electric Auto Association Silicon Valley
- Electric Car Society
- Humboldt Electric Vehicle Association
- NEDRA National Electric Drive Racing Association
- Oregon Electric Vehicle Association
- Plug In America
- PHEV Research Center
- Project EVIE
- RechargeIT (Google.org)
- San Francisco BayLEAFs
- Seattle Electric Vehicle Association
- World Electric Vehicle Association
See also[]
- CalCars
- Plug In America
- Electric car use by country
- Government incentives for plug-in electric vehicles
- Hybrid electric vehicles in the United States
- List of modern production plug-in electric vehicles
- List of modern production plug-in electric vehicles available in the United States
- New energy vehicles in China
- Plug-in electric vehicles in Canada
- Plug-in electric vehicles in California
- Plug-in electric vehicles in Europe
- Plug-in electric vehicles in France
- Plug-in electric vehicles in Germany
- Plug-in electric vehicles in Japan
- Plug-in electric vehicles in the Netherlands
- Plug-in electric vehicles in Norway
- Plug-in electric vehicles in Sweden
- Plug-in electric vehicles in the United Kingdom
- Plug-in hybrids in New York
References[]
- ^ a b c d e f g h i j k l m n o Kane, Mark (11 January 2020). "The Top 10 Plug-In Electric Cars In U.S. - 2019 Edition". InsideEVs.com. Retrieved 8 May 2020. At the end of 2019, the all-time top selling plug-in cars in the U.S. were the Tesla Model 3 with 300,471 units, the Tesla Model S with 157,92, and the Chevrolet Volt with 157,054 units.
- ^ a b c d e f g h i j C.J. Moore (2021-02-14). "Tesla's commanding lead in U.S. EVs illustrated by registration report". Automotive News. Retrieved 2021-02-14. According to Experian, in 2020 the top U.S. EVs by registrations were the Tesla Model 3 (95,135), Tesla Model Y (71,344), Chevrolet Bolt EV (19,664), the Tesla Model X (19,652), Tesla Model S (14,430) and the Nissan Leaf (8,972). All four Tesla models accounted for 200,561 registrations, up 16% from 2019.
- ^ a b c d e Kane, Mark (2021-01-07). "US: Chevrolet Doubled Bolt EV Sales In Q4 2020". InsideEVs.com. Retrieved 2021-01-07.
- ^ a b Argonne National Laboratory (October 2021). "Light Duty Electric Drive Vehicles Monthly Sales Updates: Plug-In Vehicle Sales". Argonne National Laboratory. Retrieved 2021-10-29.
Cumulatively, 424,483 PHEVs and BEVs have been sold in 2021. In total, 2,137,480 PHEVs and BEVs have been sold since 2010.
- ^ a b Argonne National Laboratory (2020-09-28). "FOTW #1153, September 28, 2020: Cumulative Plug-In Vehicle Sales in the United States Reach 1.6 Million Units". Vehicle Technologies Office, EERE, USDoE. Retrieved 2020-10-06.
- ^ a b c International Energy Agency (IEA), Clean Energy Ministerial, and Electric Vehicles Initiative (EVI) (June 2020). "Global EV Outlook 2020: Entering the decade of electric drive?" (PDF). IEA Publications. Retrieved 2020-06-15.CS1 maint: multiple names: authors list (link) See Statistical annex, pp. 247–252 (See Tables A.1 and A.12). The global stock of plug-in electric passenger vehicles totaled 7.2 million cars at the end of 2019, of which, 47% were on the road in China. The stock of plug-in cars consist of 4.8 million battery electric cars (66.6%) and 2.4 million plug-in hybrids (33.3%). In addition, the stock of light commercial plug-in electric vehicles in use totaled 378 thousand units in 2019, and about half a million electric buses were in circulation, most of which are in China.
- ^ a b c d e Jeff Cobb (2013-01-08). "December 2012 Dashboard". HybridCars.com and Baum & Associates. Retrieved 2013-01-14. See the section: U.S. Plug-in Electric sales for December 2012. A total of 53,172 plug-in electric vehicles were sold during 2012. Sales of the Fisker Karma, Coda and Wheego are not included in this figure, because these carmakers does not report monthly sales on a regular basis. Tesla Model S sales are estimated.
- ^ a b c d e f g h i j Cobb, Jeff (2016-01-06). "December 2015 Dashboard". HybridCars.com and Baum & Associates. Retrieved 2016-03-14. Plug-in electric car sales in the U.S. totaled 114,248 units in 2015, consisting of 71,105 all-electric cars and 43,143 plug-in hybrids, with corresponding market shares of 0.25% and 0.41%. Sales in 2014 totaled 123,347 units.
- ^ a b c d e Cobb, Jeff (2018-01-04). "December 2017 Dashboard". HybridCars.com and Baum & Associates. Retrieved 2018-01-21. Plug-in electric car sales in the U.S. totaled 194,479 units in 2017, consisting of 104,487 all-electric cars and 89,992 plug-in hybrids. The plug-in car segment achieved a market share of 1.13% of new car sales.
- ^ a b Irle, Roland. "USA Plug-in Sales for 2018 Full Year". EV-volumes.com. Retrieved 2019-01-25.
- ^ a b c California New Car Dealers Association (CNCDA) (February 2021). "California Auto Outlook Covering Fourth Quarter 2020: State New Light Vehicle Registrations Predicted to Approach 1.8 Million Units in 2021" (PDF). CNCDA. Retrieved 2021-02-07. A total of 132,742 plug-in electric passenger cars (101,628 BEVs and 31,114 PHEVs) and were registered in 2020. Registration figures between 2016 and 2019 were revised, resulting in significantly higher estimates than previously reported through 2019.
- ^ a b "Veloz: 2018 banner year for EV sales in California; up 84% from 2017; 312% increase from January to December". VELOZ. Green Car Congress. 2019-01-14. Retrieved 2019-01-23. Cumulative sales in California totaled 537,208 units between 2011 and 2018.
- ^ a b Cobb, Jeff (2018-01-22). "Tesla Quietly Sold 200,000th Model S Last Year". HybridCars.com. Retrieved 2018-01-22. "Tesla sold its 200,000 Model S in the fourth quarter of 2017, in October or early November, becoming the second plug-in car to cross this sales threshold after the Nissan Leaf (300,000 units by early 2017). As of December 2017, Tesla reported global sales of 212,874 Model S cars."
- ^ a b c Cobb, Jeff (2017-01-11). "America's Plug-in Car Sales Were Their Best Ever in 2016". HybridCars.com and Baum & Associates. Retrieved 2017-01-12. Plug-in electric car sales in the U.S. totaled 157,181 units, up 37.6% from 2015 (114,248). The plug-in car segment achieved an all-time high market share of 0.90% of new car sales in 2016. The top selling model for the second year in a row was the Tesla Model S with 29,156 units sold in 2016, followed by the Chevrolet Volt (24,739), Tesla Model X (18,028), Ford Energi Fusion (15,938), and the Nissan Leaf (14,006). As of December 2016, cumulative sales totaled 570,187 plug-in cars since 2008, with the Chevrolet Volt as the all-time best selling plug-in car with 113,489 units. The Tesla Model S ranks third with an estimated 92,317 units since its inception in 2012.
- ^ a b c d e f g h Kane, Mark (2019-01-24). "US Plug-In Electric Car Sales Charted: December 2018". InsideEVs.com. Retrieved 2019-01-24. See Graph: "Top 10 U.S. Plug-in cars (cumulative sales)" and "U.S. Plug-in Car Sales (cumulative)"
- ^ a b c d e f g h Loveday, Steven (17 January 2020). "FINAL UPDATE: Quarterly Plug-In EV Sales Scorecard". InsideEVs.com. Retrieved 8 May 2020. See Chart: "2019 Monthly/Q4 Sales Chart : Annual" - Cumulative sales in the U.S. totaled 329,528 units in 2019, and the top selling models were the Tesla Model 3 with 158,925 units, the Toyota Prius Prime with 23,630, the Tesla Model X with 19,225, the Chevrolet Bolt EV with 16,418 and the Tesla Model S with 14,100 units.
- ^ a b c d "Notice 2009-89: New Qualified Plug-in Electric Drive Motor Vehicle Credit". Internal Revenue Service. 2014-08-15. Retrieved 2014-09-22.
- ^ a b c Phuong Le (2014-11-27). "Inslee pushes incentives for electric cars". The Associated Press. The Seattle Times. Retrieved 2014-11-29.
- ^ a b Jerry Mitlitski (2011-02-18). "Raising the Volt-Age: Is Obama's Goal of 1 Million Electric Vehicles on U.S. Highways by 2015 Realistic?". Scientific American. Retrieved 2012-05-11.
- ^ U.S. Department of Energy (February 2011). "One Million Electric Vehicles By 2015 - February 2011 Status Report" (PDF). Office of Energy Efficiency and Renewable Energy (EERE). Retrieved 2013-02-27.
- ^ a b Bill Vlasic & Matthew L. Wald (2012-06-11). "Shaky Battery Maker Claims an Advance". The New York Times. Retrieved 2012-06-12.
- ^ a b Sharyl Attkisson (2012-06-02). "Electric vehicles fall drastically short of Obama's 1 million goal". CBS News. Retrieved 2012-06-12.
- ^ David Shepardson (2012-04-17). "Battery-powered autos proving a tough sell". The Detroit News. Archived from the original on 2012-06-11. Retrieved 2012-06-12.
- ^ a b "U.S. resets expectations for electric vehicle sales". Long Island Newsday. Reuters. 2013-01-31. Retrieved 2013-02-24.
- ^ a b Kane, Mark (2018-10-06). "Plug-In Electric Cars Sales In U.S. Surpass 1 Million". InsideEVs. Retrieved 2018-10-21.
- ^ a b Argonne National Laboratory (2018-11-26). "FOTW #1057, November 26, 2018: One Million Plug-in Vehicles Have Been Sold in the United States". Vehicle Technologies Office, US DoE. Retrieved 2018-12-01.
- ^ "Mayor Office Press Room". Sfgov.org. Archived from the original on 2009-10-03. Retrieved 2009-09-19.
- ^ Woodyard, Chris (2008-11-28). "Local authorities get in on push for electric cars". Usatoday.Com. Retrieved 2009-09-19.
- ^ "Office of Governor Edmund G. Brown Jr. - Newsroom". www.gov.ca.gov. Retrieved 2016-02-10.
- ^ a b Staff (2012-03-23). "Governor Brown Announces $120 Million Settlement To Fund Electric Car Charging Stations Across California". Office of Governor Edmund G. Brown Jr. Retrieved 2014-09-22.
- ^ a b Marisa Lagos (2014-09-22). "Brown signs several clean-air vehicle bills". San Francisco Chronicle. Retrieved 2014-09-22.
- ^ Woodyard, Chris (2010-07-14). "Obama pushes electric cars, battery power this week". USA Today.
- ^ "EERE News: Recovery Act Announcement: President Obama Announces $2.4 Billion for Electric Vehicles". Apps1.eere.energy.gov. 2009-03-19. Retrieved 2009-09-19.
- ^ "Obama's Pitches for Plug-In Hybrids: Videos, Transcripts, Clips". Calcars.org. Retrieved 2009-09-19.
- ^ "EERE News: President Obama Announces $2.4 Billion for Electric Vehicles". Apps1.eere.energy.gov. 2009-03-19. Retrieved 2009-09-19.
- ^ "Consumer Energy Tax Incentives: Plug-In Hybrid Conversion Kits". U.S. Department of Energy. Retrieved 2010-04-01.
- ^ a b Kontou, Eleftheria; Yin, Yafeng; Lin, Zhenhong; He, Fang (5 April 2017). "Socially optimal replacement of conventional with electric vehicles for the US household fleet". International Journal of Sustainable Transportation. 11 (10): 749–763. doi:10.1080/15568318.2017.1313341. OSTI 1371525. S2CID 157619500.
- ^ a b "Nissan will sell electric car for just over $25K". CBS News. Associated Press. 2010-03-30. Retrieved 2017-01-17.
- ^ John Voelcker (2009-12-14). "Toyota Prius Plug-In Hybrid On Sale in 2011, Less Than $10K More". GreenCarReports.com. Archived from the original on 2013-01-24. Retrieved 2010-04-18.
- ^ Tal, Gil; Michael A. Nicholas (2016). "Exploring the Impact of the Federal Tax Credit on the Plug-In Vehicle Market". Transportation Research Record: Journal of the Transportation Research Board. 2572: 95–102. doi:10.3141/2572-11. S2CID 112951938. Published on line 2008-02-11.
- ^ Malone, Wade (2018-07-12). "UPDATE: Tesla Has Officially Confirmed Passing 200k, Credit Safe until December". InsideEVs.com. Retrieved 2018-12-02.
- ^ Malone, Wade (2018-12-04). "Chevy Volt and Bolt Estimates: Sales Skyrocket In November". InsideEVs.com. Retrieved 2018-12-09.
- ^ Cohen, Ariel (2018-11-30). "GM Must Adapt Or Die: A Lesson For U.S. Automakers". Forbes. Retrieved 2018-12-01.
- ^ a b Kane, Mark (2018-12-06). "NOVEMBER UPDATE – 4 Automakers Closest To Losing Federal Tax Credit". InsideEVs.com. Retrieved 2018-12-09.
- ^ "CVRP Eligible Vehicles". Center for Sustainable Energy California. Archived from the original on 2013-07-29. Retrieved 2013-01-21.
- ^ "Clean Vehicle Rebate Project". Center for Sustainable Energy. Archived from the original on 2010-04-02. Retrieved 2010-04-01.
- ^ "CVRP Eligible Vehicles". Center for Sustainable Energy California. Archived from the original on 2013-07-29. Retrieved 2010-06-08.
- ^ a b "Clean Vehicle Rebate Project FAQ: Changes in CVRP FY 2011-2012". Center for Sustainable Energy California. Archived from the original on 2011-10-15. Retrieved 2011-05-22.
- ^ "Electric Vehicles: Tax Credits and Other Incentives". Retrieved 21 March 2019.
- ^ "Federal and State Laws and Incentives". US: Alternative Fuels Data Center. 2014-06-04. Retrieved 2016-09-22.
- ^ "State Efforts Promote Hybrid and Electric Vehicles". US: National Conference of State Legislatures. 2015-12-03. Retrieved 2016-09-22.
- ^ "State and Federal Incentives- United States Incentives Map". Plug In America. Retrieved 2020-08-12.
- ^ John Voelcker (2010-07-08). "California Yanks Prius Perks: No More Hybrid HOV-Lane Access". GreenCarReports.com. Archived from the original on 2012-06-29. Retrieved 2010-07-09.
- ^ Melanie Mason & Patrick McGreevy (2014-09-21). "Gov. Jerry Brown signs bills to boost purchases of electric cars". Los Angeles Times. Retrieved 2014-09-21.
- ^ "Eligible Vehicle List - Single occupant carpool lane stickers". California Air Resources Board. 2016-09-19. Retrieved 2016-09-22.
- ^ "RechargeColorado". 2011-09-30. Archived from the original on 2011-09-30. Retrieved 2011-09-30.
- ^ a b c "LEV/ZEV and Electric Vehicle Charger Tax Credit Fact Sheet" (PDF). Georgia Department of Natural Resources. 2004-04-14. Archived from the original (PDF) on 2014-10-21. Retrieved 2014-09-27.
- ^ "Elimination of federal tax credits likely to kill U.S. EV market" (PDF). Edmunds. 2017. Retrieved 2017-04-08.
- ^ "Georgia Laws and Incentives". Georgia (US): Alternative Fuels Data Center. 2016-07-08. Retrieved 2016-09-22.
- ^ a b "Plug-In Electric Vehicle (PEV) High Occupancy Vehicle (HOV) Lane Exemption". Alternative Fuels Data Center, U.S. DoE. 2014-06-04. Retrieved 2016-04-19. This incentive is in effect until September 30, 2017.
- ^ "Plug-In Electric Vehicle (PEV) Tax Credit". Alternative Fuels Data Center, U.S. DoE. 2014-06-04. Retrieved 2016-04-19. Plug-in electric vehicles purchased new and titled for the first time between July 1, 2014, and July 1, 2017, are eligible for a credit up to US$3,000, calculated as US$125 per kWh of battery capacity. Buyers of PEVs may apply for a tax credit against the imposed excise tax. The credit is returned to the taxpayer in the form of a check from the state. The tax credit is limited to one vehicle per individual and 10 vehicles per business.
- ^ "Electric Vehicle Supply Equipment (EVSE) Rebate Program". Alternative Fuels Data Center, U.S. DoE. 2014-06-04. Retrieved 2016-04-19. Between July 1, 2014, and June 30, 2016, rebate amounts are equal to the previous amounts, up to 50% of the costs of acquiring and installing qualified chargers.
- ^ Danny King (2014-03-31). "Massachusetts introduces $2,500 state incentive for EVs". Autoblog Green. Retrieved 2014-03-31.
- ^ "Tax and Other Incentives - Montana Incentives for Renewable Energy". Montana Department of Environmental Quality. Retrieved 2010-05-30.
- ^ New York State Department of Transportation (NYSDOT) (2014-07-28). "New York's Clean Pass Program". NYSDOT. Archived from the original on 2017-01-25. Retrieved 2014-10-25.
- ^ a b Alternative Fuels Data Center (AFDC) (2014-06-04). "New York: High Occupancy Vehicle (HOV) Lane Exemption and Discount". AFDC. Retrieved 2014-10-25.
- ^ "Alternative Fuel Vehicle Rebate Program". Retrieved 2015-07-07.
- ^ a b c Cole, Jay (2016-04-19). "Washington Expands Electric Vehicle Incentive Program, Discounts Up To $3,100". InsideEVs.com. Retrieved 2016-04-19. See notes in EV map by county.
- ^ a b Banse, Tom (2016-04-19). "Electric Car Incentives In Washington State Expanded To More Models". NW News Network. Retrieved 2021-06-17.
- ^ a b Banse, Tom (2019-04-29). "Tax break for electric vehicles makes a comeback in Washington state". NW News Network. Retrieved 2021-06-17.
- ^ a b "Alternative Fuel Vehicle (AFV) Retail Sales and Use Tax Exemption". Alternative Fuels Data Center, U.S. DoE. Retrieved 2021-06-17.
- ^ John Voelcker (2011-02-08). "Senator Stabenow: $7,500 Electric-Car Credit Should Be Rebate". GreenCarReports.com. Archived from the original on 2011-02-13. Retrieved 2011-02-16.
- ^ "Obama FY 2012 budget proposes big boost for EVs and EV technology, cuts for hydrogen". Green Car Congress. 2011-02-14. Retrieved 2011-02-16.
- ^ Nick Chambers (2011-02-09). "White House Pushes For a $7,500 Instant Cash Rebate Towards Electric Car Purchases". PluginCars.com. Retrieved 2011-02-16.
- ^ David Sheparson (2014-03-04). "White House: Boost EV, alternative vehicle tax credits to $10,000". The Detroit News. Archived from the original on 2014-03-10. Retrieved 2014-03-10.
- ^ "House Republicans propose to scrap $7,500 electric vehicle credit". Reuters. 2017-11-02. Retrieved 2017-11-02.
- ^ "US Tax Incentives for Plug-in Hybrids and Electric Cars". HybridCars.com. 2010-03-08. Archived from the original on 2010-03-11. Retrieved 2010-01-04.
- ^ "Electric Car Charging Station Tax Credit Extended, But at Lower 30% Pre-Stimulus Levels". PluginCars.com. 2010-12-17. Retrieved 2010-12-23.
- ^ "Federal and Local Incentives for Plug-in Hybrids and Electric Cars". plugincars.com. 2013-05-08. Retrieved 2013-08-11.
- ^ "FACT SHEET: Obama Administration Announces Federal and Private Sector Actions to Accelerate Electric Vehicle Adoption in the United States". whitehouse.gov. 21 July 2016. Retrieved 29 July 2016 – via National Archives.
- ^ U.S. Department of Energy (DoE) (2012-03-07). "President Obama Launches EV-Everywhere Challenge as Part of Energy Department's Clean Energy Grand Challenges". DoE. Retrieved 2013-03-01.
- ^ Danny King (2012-03-11). "Obama's EV Everywhere plan sets 2022 goals for U.S.-made electric vehicles". Autoblog Green. Retrieved 2013-03-01.
- ^ a b c d e U.S. Department of Energy (January 2013). "EV Everywhere Grand Challenge Blueprint" (PDF). Office of Energy Efficiency and Renewable Energy (EERE), US DoE. Retrieved 2013-02-24. See pp. 5.
- ^ a b Jeff Cobb (2012-12-07). "Energy Department Backs Plan To Develop Five-Times More Energy Dense EV Battery". HybridCars.com. Retrieved 2013-03-01.
- ^ Benson Kong (2012-12-02). "New JCESR Consortium Aims to Make U.S. a Battery Powerhouse". Motor Trend. Retrieved 2013-03-01.
- ^ U.S. Department of Energy (January 2014). "EV Everywhere Grand Challenge: Road to Success" (PDF). U.S. DoE. Retrieved 2014-09-25.
- ^ Mohana Ravindranath (2013-02-04). "Five take-aways from the Washington Auto Show's energy efficiency policy summit". The Washington Post. Archived from the original on 2013-04-12. Retrieved 2013-03-01.
- ^ Sebastian Blanco (2013-01-31). "EV Everywhere expands with Workplace Charging Challenge". Autoblog Green. Retrieved 2013-03-01.
- ^ "Army announces historic electric vehicle lease". Army.mil. 2009-01-20. Archived from the original on 2009-09-04. Retrieved 2009-09-19.
- ^ "Los Angeles AFB to go electric". af.mil. 2011-08-31. Retrieved 2011-10-04.
- ^ Loveday, Eric (May 2013). "US Military to Soon Own Largest Federal Fleet of V2G Plug-In Vehicles". Inside EVs. Retrieved 17 September 2014.
- ^ "Quiet Car Rule: New EVs Must Emit Warning Sounds In US By 2019". Inside EVs.
- ^ Motavalli, Jim (2010-06-01). "Electric Car Warning Sounds: Don't Expect Ring Tones". The New York Times. Wheels. Retrieved 2010-06-02.
- ^ a b c Clean Energy Ministerial and Electric Vehicles Initiative (2016-11-16). "Government Fleet Declaration" (PDF). International Energy Agency. Retrieved 2016-11-26.
- ^ Office of the Press Secretary, the White House (2016-11-03). "Obama Administration Announces New Actions To Accelerate The Deployment of Electrical Vehicles and Charging Infrastructure". whitehouse.gov. Retrieved 2016-11-26 – via National Archives.
- ^ Natural Resources Defense Council (NRDC) (November 2016). "The Road From Paris: The United States Progress Towards its Climate Pledge" (PDF). NRDC. Retrieved 2016-11-26.
- ^ Chakraborty, Barnini (2017-06-01). "Paris Agreement on climate change: US withdraws as Trump calls it 'unfair'". Fox News. Retrieved 2019-01-29.
- ^ "Biden reaffirms commitment to rejoining Paris climate accord". 9 November 2020.
- ^ Lisa Friedman and Katie Glueck (July 6, 2020). "Biden's Big Climate Decision: Will He Embrace His Task Force's Goals?". New York Times.
- ^ "What's Next for Fracking Under Biden?".
- ^ a b United States Environmental Protection Agency and U.S. Department of Energy (2016-11-16). "Model Year 2017 Fuel Economy Guide - Electric vehicles & Plug-in Hybrid Electric Vehicles" (PDF). fueleconomy.gov. Retrieved 2016-11-19. pp. 32–36.
- ^ a b c d United States Environmental Protection Agency and U.S. Department of Energy (2015-12-18). "Model Year 2016 Fuel Economy Guide - Electric vehicles & Plug-in Hybrid Electric Vehicles" (PDF). fueleconomy.gov. Retrieved 2015-12-18. See pp. 27-28 for all-electric vehicles and pp. 30-31 for plug-in hybrid electric vehicles. The average 2016 vehicle gets 25 mpg
- ^ a b c d e f g h i j United States Environmental Protection Agency and U.S. Department of Energy (2014-09-10). "Model Year 2014 Fuel Economy Guide - Electric vehicles & Plug-in Hybrid Electric Vehicles (updated September 2014)" (PDF). fueleconomy.gov. Retrieved 2014-09-12. pp. 33-36
- ^ United States Environmental Protection Agency and U.S. Department of Energy (2016-11-18). "Compare Side-by-Side: 2017 Hyundai Ioniq Electric". fueleconomy.gov. Retrieved 2016-11-19.
- ^ U. S. Environmental Protection Agency and U.S. Department of Energy (2016-11-16). "Most Efficient EPA Certified Vehicles". fueleconomy.gov. Retrieved 2016-11-19. In November 2016, the Hyundai Ioniq Electric surpassed the 2014–16 BMW i3 BEV as the most efficient EPA-certified vehicles considering all fuels and of all years.
- ^ LeSage, Jon (2016-10-05). "2017 Prius Prime Offers Industry's Best 'MPGe' and 25 Miles Electric Range". HybridCars.com. Retrieved 2016-10-15.
- ^ Halvorson, Bengt (2016-03-24). "2016 Toyota Prius Prime: details on 120 MPGe plug-in hybrid, all-electric mode". Green Car Reports. Retrieved 2016-03-24.
- ^ a b United States Environmental Protection Agency and U.S. Department of Energy (2014-07-04). "Compare Side-by-Side: 2014 BMW i3 BEV & 2014 BMW i3 REx". fueleconomy.gov. Retrieved 2014-07-26.
- ^ U. S. Environmental Protection Agency and U.S. Department of Energy (2015-12-22). "Most Efficient EPA Certified Vehicles". fueleconomy.gov. Retrieved 2015-12-22. The 2014–16 BMW i3 BEV is the most efficient EPA-certified vehicles considering all fuels and of all years. The 2016 Toyota Prius Eco hybrid car is most efficient EPA-certified vehicle with a gasoline engine without plug-in capability.
- ^ U. S. Environmental Protection Agency and U.S. Department of Energy (2014-03-12). "2013 Scion iQ EV". Fueleconomy.gov. Retrieved 2014-03-14.
- ^ "Toyota beefs up green vehicles, plans electric car for this year, fuel cell vehicle by 2015". Toledo Blade. Associated Press. 2012-09-24. Retrieved 2013-03-27.
- ^ UC Irvine Press Release (2013-03-21). "UC Irvine's car-sharing program charges ahead". University of California, Irvine. Retrieved 2013-03-28.
- ^ Sebastian Blanco (2013-09-12). "City CarShare fires up Dash carsharing network with 30 Scion iQ EVs". Autoblog Green. Retrieved 2013-09-16.
- ^ Energy Efficiency & Renewable Energy, U.S. Department of Energy and U. S. Environmental Protection Agency and (2016-09-20). "Compare Side-by-Syde - 2017 Chevrolet Bolt". fueleconomy.gov. Retrieved 2016-09-20.
- ^ U. S. Environmental Protection Agency and U.S. Department of Energy (2014-03-12). "2014 Chevrolet Spark EV". Retrieved 2014-03-24.
- ^ a b United States Environmental Protection Agency and U.S. Department of Energy (2016-09-29). "Compare Side-by-Side: 2015 BMW i3 REX, 2016 BMW i3 REX, 2017 BMW i3 REX (94 Amp-hour battery), and 2017 BMW i3 BEV (94 Amp-hour battery)". fueleconomy.gov. Retrieved 2016-09-30.
- ^ U. S. Environmental Protection Agency and U.S. Department of Energy (2014-03-12). "2013/2014 Honda Fit EV". Fueleconomy.gov. Retrieved 2014-03-14.
- ^ United States Environmental Protection Agency and U.S. Department of Energy (2016-09-16). "Compare Side-by-Side - 2014/2015/2016 BMW i3 REx". fueleconomy.gov. Retrieved 2016-09-19.
- ^ John Voelcker (2013-10-23). "2014 BMW i3 Electric Car: Why California Set Range Requirements, Engine Limits". Green Car Reports. Retrieved 2014-01-19.
- ^ John Voelcker (2014-05-02). "2014 BMW i3 Range-Extended Model Gets Full $2,500 CA Rebate For Electric Cars". Green Car Reports. Retrieved 2014-05-02.
- ^ a b c d e f U. S. Environmental Protection Agency and U.S. Department of Energy (2015-12-22). "Fueleconomy.gov's Top Fuel Sippers (EPA Ratings, All Years)". fueleconomy.gov. Retrieved 2015-12-22. Excludes all-electric vehicles. Click on the tab "Top Fuel Sippers (EPA Ratings, All Years)" - The 2013-2014 Chevrolet Volt has a combined fuel economy of 62 mpg-e, while 2016 Volt has a combined fuel economy of 77 mpg-e. The BMW i3 REx has a combined fuel economy of 88 mpg-e
- ^ U. S. Environmental Protection Agency and U.S. Department of Energy (2014-11-14). "2015 Volkswagen e-Golf". Fueleconomy.gov. Retrieved 2014-11-15.
- ^ U. S. Environmental Protection Agency and U.S. Department of Energy (2014-03-12). "2013/2014 Fiat 500e". Fueleconomy.gov. Retrieved 2014-03-14.
- ^ a b U.S. Environmental Protection Agency and U.S. Department of Energy (2014-03-12). "Compare side by side: 2013 Nissan Leaf/2014 Nissan Leaf/2015 Nissan Leaf/2016 Nissan Leaf (24 kW-hr battery pack)/2016 Nissan Leaf (30 kW-hr battery pack)". Fueleconomy.gov. Retrieved 2014-03-12.
- ^ U. S. Environmental Protection Agency and U.S. Department of Energy (2014-03-12). "2014 Honda Accord Plug-in Hybrid". Fueleconomy.gov. Retrieved 2014-03-13.
- ^ a b c d e f g h i U. S. Environmental Protection Agency (October 2014). "Light-Duty Automotive Technology, Carbon Dioxide Emissions, and Fuel Economy Trends: 1975 Through 2014" (PDF). EPA. Archived from the original (PDF) on 2014-10-18. Retrieved 2014-10-11. See Table 7.2 - MY 2014 Alternative Fuel Vehicle Powertrain and Range; pp. 98; Table 7.3 for overall fuel economy (mpg-e), pp. 100; Table 7.4 for tailpipe CO2 emissions, pp. 102; and Table 7.5 for upstream CO2 Emission, pp. 105.
- ^ U.S. Environmental Protection Agency and U.S. Department of Energy (2014-11-14). "2012/2013/2014 Mitsubishi i-MiEV". Fueleconomy.gov. Retrieved 2014-11-15.
- ^ U. S. Environmental Protection Agency and U.S. Department of Energy (2015-12-04). "2016 Fiat 500e". Fueleconomy.gov. Retrieved 2015-12-06.
- ^ a b U. S. Environmental Protection Agency and U.S. Department of Energy (2014-03-12). "2011 and 2013/2014 smart fortwo electric drive cabriolet & coupe". Fueleconomy.gov. Retrieved 2014-03-12.
- ^ U.S. Environmental Protection Agency and U.S. Department of Energy (2016-03-18). "Compare Side-by-Side - 2017/2016 Chevrolet Volt". Fueleconomy.gov. Retrieved 2016-03-20.
- ^ Eric Loveday (2015-09-01). "Detailed Look At 2016 Chevrolet Volt EPA Ratings". InsideEVs.com. Retrieved 2015-09-02.
- ^ U. S. Environmental Protection Agency and U.S. Department of Energy (2014-09-12). "2015 Kia Soul Electric". Fueleconomy.gov. Retrieved 2014-09-12.
- ^ Eric Loveday (2014-09-12). "2015 Kia Soul EV Gets Official EPA Range Rating Of 93 Miles – City Range Will Blow Your Mind". InsideEVs.com. Retrieved 2014-09-12.
- ^ U. S. Environmental Protection Agency and U.S. Department of Energy (2014-03-12). "2012/2013/2014 Ford Focus Electric". Fueleconomy.gov. Retrieved 2014-03-14.
- ^ U.S. Environmental Protection Agency and U.S. Department of Energy (2014-03-12). "2011 BMW Acive E". Fueleconomy.gov. Retrieved 2014-03-14.
- ^ U.S. Environmental Protection Agency and U.S. Department of Energy (2012-11-30). "2012 Nissan Leaf". Fueleconomy.gov. Retrieved 2012-12-02.
- ^ a b U. S. Environmental Protection Agency and U.S. Department of Energy (2015-10-05). "Compare Side-by-Side - 2016 Hyundai Sonata Plug-in Hybrid". Fueleconomy.gov. Retrieved 2015-10-05.
- ^ U.S. Environmental Protection Agency and U.S. Department of Energy (2014-03-12). "2014 Chevrolet Volt/2013 Chevrolet Volt". Fueleconomy.gov. Retrieved 2014-03-12.
- ^ a b U.S. Environmental Protection Agency and U.S. Department of Energy (2016-05-27). "Compare Side-by-Side - 2016/2017 Ford Fusion Energi Plug-in Hybrid". Fueleconomy.gov. Retrieved 2016-05-27.
- ^ a b U. S. Environmental Protection Agency and U.S. Department of Energy (2014-03-12). "2013/2014 Tesla Model S (60 kW-hr battery pack) 2012/2014 Tesla Model S (85 kW-hr battery pack)". Fueleconomy.gov. Retrieved 2014-03-14.
- ^ U. S. Environmental Protection Agency and U.S. Department of Energy (2014-07-25). "Compare Side-by-Side - 2012/2013/2014 Toyota Prius Plug-in Hybrid". Fueleconomy.gov. Retrieved 2014-07-26.
- ^ U. S. Environmental Protection Agency and U.S. Department of Energy (2014-03-12). "2012 Chevrolet Volt/2011 Chevrolet Volt". Fueleconomy.gov. Retrieved 2014-03-12.
- ^ U. S. Environmental Protection Agency and U.S. Department of Energy (2014-03-12). "2013 Tesla Model S (40 kW-hr battery pack)". Fueleconomy.gov. Retrieved 2014-03-15.
- ^ "Tesla Model S Sales Exceed Target" (Press release). Tesla Motors. 2013-03-31. Retrieved 2014-03-15.
- ^ a b U. S. Environmental Protection Agency and U.S. Department of Energy (2015-09-26). "2016 Tesla Model X AWD - 90D and P90D". Retrieved 2015-10-03.
- ^ a b U. S. Environmental Protection Agency and U.S. Department of Energy (2014-06-12). "Compare Side-by-Side - 2013/14 Ford C-Max Plug-in Hybrid and 2013/14 Ford Fusion Plug-in Hybrid". Fueleconomy.gov. Retrieved 2014-06-12.
- ^ a b Jeff Cobb (2014-06-12). "Ford Downgrades Hybrid Model MPG Ratings". HybridCars.com. Retrieved 2014-06-12.
- ^ a b c d U.S. Environmental Protection Agency and U.S. Department of Energy (2015-11-20). "Compare side by side: 2016 Audi A3 e-tron ultra and 2016 Audi A3 e-tron". Fueleconomy.gov. Retrieved 2015-11-23.
- ^ a b U.S. Environmental Protection Agency and U.S. Department of Energy (2015-11-20). "Compare side by side: 2016 Cadillac ELR and 2016 Cadillac ELR Sport". Fueleconomy.gov. Retrieved 2015-11-22.
- ^ U.S. Environmental Protection Agency and U.S. Department of Energy (2014-07-25). "2014 Mercedes-Benz B-Class Electric Drive". Fueleconomy.gov. Retrieved 2014-07-26.
- ^ a b U.S. Environmental Protection Agency and U.S. Department of Energy (2016-12-06). "Compare Side-by-Side - 2017 Chrysler Pacifica Plug-in Hybrid". Fueleconomy.gov. Retrieved 2016-12-07.
- ^ U.S. Environmental Protection Agency and U.S. Department of Energy (2014-03-07). "2014 Cadillac ELR". Fueleconomy.gov. Retrieved 2014-03-10.
- ^ U.S. Environmental Protection Agency and U.S. Department of Energy (2014-03-12). "2012/2013/2014 Toyota RAV4 EV". Fueleconomy.gov. Retrieved 2014-03-14.
- ^ U.S. Environmental Protection Agency and U.S. Department of Energy (2014-08-21). "2014 BMW i8". Fueleconomy.gov. Retrieved 2014-08-21.
- ^ U.S. Environmental Protection Agency and U.S. Department of Energy (2014-03-12). "2012/13 CODA Automotive CODA". Fueleconomy.gov. Retrieved 2014-03-14.
- ^ a b U.S. Environmental Protection Agency and U.S. Department of Energy (2016-03-18). "2016 BMW 330e". Fueleconomy.gov. Retrieved 2016-03-20.
- ^ U.S. Environmental Protection Agency and U.S. Department of Energy (2014-05-30). "2015 Porsche 918 Spyder". Fueleconomy.gov. Retrieved 2014-06-01.
- ^ U.S. Environmental Protection Agency and U.S. Department of Energy (2014-03-12). "2012 BYD e6". Fueleconomy.gov. Retrieved 2014-03-12.
- ^ a b Energy Efficiency & Renewable Energy, U.S. Department of Energy and U. S. Environmental Protection Agency and (2016-09-19). "Compare Side-by-Syde - 2017 BMW 740e xDrive". fueleconomy.gov. Retrieved 2016-09-19.
- ^ a b U.S. Environmental Protection Agency and U.S. Department of Energy (2015-10-21). "2016 BMW X5 xDrive40e". Fueleconomy.gov. Retrieved 2015-10-21.
- ^ a b U.S. Environmental Protection Agency and U.S. Department of Energy (2015-01-02). "2015 Mercedes-Benz S550e". Fueleconomy.gov. Retrieved 2015-10-04.
- ^ U. S. Environmental Protection Agency and U.S. Department of Energy (2014-03-12). "Compare Side-by-Side - 2012 Fisker Karma". Fueleconomy.gov. Retrieved 2014-03-14.
- ^ a b U.S. Environmental Protection Agency and U.S. Department of Energy (2016-03-18). "2016 Volvo XC90 AWD PHEV". Fueleconomy.gov. Retrieved 2016-03-18.
- ^ a b U. S. Environmental Protection Agency and U.S. Department of Energy (2014-04-02). "Compare Side-by-Side - Porsche Panamera S E-Hybrid". Fueleconomy.gov. Retrieved 2014-04-05. Gasoline price was adjusted to $3.81 per gallon for comparison purposes to reflect the same price used for the other cars shown in this table.
- ^ U. S. Environmental Protection Agency and U.S. Department of Energy (2014-12-05). "Compare Side-by-Side - Porsche Cayenne S E-Hybrid". Fueleconomy.gov. Retrieved 2014-12-11. Gasoline price was adjusted to $3.81 per gallon for comparison purposes to reflect the same price used for the other cars shown in this table.
- ^ a b U. S. Environmental Protection Agency and U.S. Department of Energy (2014-09-12). "Compare Side-by-Side - 2014 McLaren Automotive P1". Fueleconomy.gov. Retrieved 2014-09-12. Gasoline price was adjusted to $3.81 per gallon for comparison purposes to reflect the same price used for the other plug-in hybrid cars shown in this table.
- ^ Nick Bunkley (2010-11-22). "Nissan Says Its Electric Leaf Gets Equivalent of 99 M.P.G." The New York Times. Retrieved 2014-03-15.
- ^ Fred Meier (2010-11-24). "Volt is rated 93 mpg on electricity alone, 37 mpg on gas generator". USA Today. Retrieved 2014-03-15.
- ^ a b Brad Berman (2009-07-29). "Confusion Over MPG Ratings for Electric Cars". HybridCars.com. Retrieved 2014-03-15.
- ^ "Why are the VOLT and LEAF EVs measured in Miles Per Gallon". Electric Vehicle News. 2009-08-15. Retrieved 2014-03-15.
- ^ Don Sherman (2008-11-13). "Cranking the Volt to 100 M.P.G." The New York Times. Retrieved 2014-03-15.
- ^ a b Sperling, Daniel & Deborah Gordon (2009). Two billion cars: driving toward sustainability. Oxford University Press, New York. pp. 22–26 and 114–139. ISBN 978-0-19-537664-7.
- ^ David B. Sandalow, ed. (2009). Plug-In Electric Vehicles: What Role for Washington? (1st. ed.). The Brookings Institution. pp. 2–5. ISBN 978-0-8157-0305-1.See definition on pp. 2.
- ^ a b c d Don Anair & Amine Mahmassani (April 2012). "State of Charge: Electric Vehicles' Global Warming Emissions and Fuel-Cost Savings across the United States" (PDF). Union of Concerned Scientists. Retrieved 2012-04-16. pp. 16-20.
- ^ a b Paul Stenquist (2012-04-13). "How Green Are Electric Cars? Depends on Where You Plug In". The New York Times. Retrieved 2012-04-14.
- ^ a b Paul Stenquist (2012-04-13). "Carbon In, Carbon Out: Sorting Out the Power Grid". The New York Times. Retrieved 2012-04-14. See map for regional results
- ^ a b Paul Stenquist (2012-04-13). "When it Comes to Carbon Dioxide, Lower is Better and Zero is Perfect". The New York Times. Retrieved 2012-04-14.
- ^ "Compare side-by-side". U.S. Department of Energy and U.S. Environmental Protection Agency. 2012-04-13. Retrieved 2012-04-15. Energy and Environment tab: cars selected Toyota Prius, Prius c, Honda Civic Hybrid, and Chevrolet Cruze automatical, all model year 2012.
- ^ Paul Stenquist (2014-09-19). "Coal Fades, So Electrics Get Cleaner". The New York Times. Retrieved 2014-10-12.
- ^ Don Anair (2014-09-16). "How do EVs Compare with Gas-Powered Vehicles? Better Every Year…". Union of Concerned Scientists (UCS). Retrieved 2014-10-12.
- ^ a b Nealer, Rachael; Reichmuth, David; Anair, Don (November 2015). "Cleaner Cars from Cradle to Grave: How Electric Cars Beat Gasoline Cars on Lifetime Global Warming Emissions" (PDF). Union of Concerned Scientists (UCS). Retrieved 2014-11-22.
- ^ "The ZEV's invisible tailpipe - Are zero-emission vehicles cleaner than petrol cars? It all depends..." The Economist. 2014-11-24. Retrieved 2014-12-08.
- ^ a b c Graff Zivina, Joshua S.; Kotchenb, Matthew J.; Mansur, Erin T. (November 2014). "Spatial and temporal heterogeneity of marginal emissions: Implications for electric cars and other electricity-shifting policies". Journal of Economic Behavior and Organization. 107 (Part A): 248–268. doi:10.1016/j.jebo.2014.03.010. Published on line 2014-03-24. See pp. 251
- ^ Automotive Science Group (ASG) (2014-02-04). "Life-cycle Assessment of 1,300 Models Reveals Best of 2014". ASG Press Room. Archived from the original on 2014-03-02. Retrieved 2014-02-22.
- ^ Eric Loveday (2014-02-11). "Nissan LEAF Has Smallest Lifecycle Footprint of Any 2014 Model Year Automobile Sold in North America". Inside EVs. Retrieved 2014-02-22.
- ^ a b c d U.S. Department of Energy (2020-02-02). "Alternative Fueling Station Counts by State". Alternative Fuels Data Center (AFDC). Retrieved 2020-02-02. The AFDC counts electric charging units or points, or EVSE, as one for each outlet available, and does not include residential electric charging infrastructure.
- ^ Danny King (2013-04-10). "US public charging stations increase by 9% in first quarter". Autoblog Green. Retrieved 2013-09-02.
- ^ Mark Kane (2013-04-22). "Sweden and UK Drive Growth Of CHAdeMO Chargers In Europe To 1,117". InsideEVs.com. Retrieved 2014-04-28.
- ^ "Six US utilities form Electric Highway Coalition in Southeast, Midwest". www.msn.com. Retrieved 2021-03-04.
- ^ "ELECTRIC VEHICLES: No more 'charging deserts'? Utilities launch EV coalition". www.eenews.net. Retrieved 2021-03-04.
- ^ Garrick, David (2016-03-16). "Car2Go switching electric cars to gas". The San Diego Union-Tribune. Retrieved 2016-03-25.
- ^ "Find EV Charging in United States | PlugShare". www.plugshare.com. Retrieved 2021-03-19.
- ^ a b c d "Indiana University researchers rank U.S. cities' readiness for plug-in electric vehicles" (Press release). Bloomington, Indiana: Indiana University Bloomington Newsroom. 2016-03-14. Retrieved 2016-03-25.
- ^ Clark-Sutton, Kyle; et al. (February 2016). "Plug-in electric vehicle readiness: Rating cities in the United States". The Electricity Journal. 29 (1): 30–40. doi:10.1016/j.tej.2015.12.006.
- ^ a b c d Electric Drive Transportation Association (EDTA) (January 2020). "Electric Drive Sales Dashboard". EDTA. Retrieved 2020-05-30.
: U.S. auto industry sales reporting methodology changed significantly beginning in October 2019, when many automakers ended monthly reporting or moved to an overall quarterly sales report without model breakdowns.
Sales figures sourced from HybridCars.com up to 2017 and direct reports submitted by EDTA member companies - ^ a b Argonne National Laboratory (2020-09-28). "Fact #1153 Dataset: Cumulative Plug-In Vehicle Sales in the United States Reach 1.6 Million Units". Vehicle Technologies Office, EERE, US Department of Energy. Retrieved 2020-10-06. Click the link to open the Excel file "fotw_1153_web (version 1)" with detailed sales by month from December 2010 through August 2020.
- ^ Cobb, Jeff (2017-01-17). "Top 10 Plug-in Vehicle Adopting Countries of 2016". HybridCars.com. Retrieved 2017-01-20.
- ^ a b c California New Car Dealers Association (CNCDA) (February 2020). "California Auto Outlook Covering Fourth Quarter 2019: State New Vehicle Market Predicted to Remain Strong in 2020" (PDF). CNCDA. Retrieved 2020-05-10. See section: "Hybrid Vehicle Market Share Increased to 5.5 Percent in 2019 " - registrations between 2015 and 2019. Figures for 2018 were revised.
- ^ a b Cobb, Jeff (2016-12-27). "China Takes Lead As Number One In Plug-in Vehicle Sales". HybridCars.com. Retrieved 2017-01-06. As of November 2016, cumulative sales of plug-in electric vehicles in China totaled 846,447 units, including passenger and commercial vehicles, making the country the world's leader in overall plug-in electric vehicle sales. With cumulative sales of about 600,000 plug-in electric passenger cars through November 2016, China is also the global leader in the plug-in passenger vehicle segment, ahead of Europe and the U.S.
- ^ Jeff Cobb (2015-02-18). "Top 6 Plug-In Vehicle Adopting Countries – 2014". HybridCars.com. Retrieved 2017-01-08.
- ^ Cobb, Jeff (2016-06-15). "Europe Buys Its 500,000th Plug-in Vehicle". HybridCars.com. Retrieved 2016-06-15. As of May 2016, cumulative sales by country are led by the United States with a stock of more than 460,000 highway legal light-duty plug-in electric vehicles delivered since 2008. China ranks second with almost 390,000 units sold since 2011, followed by Japan with over 150,000 plug-ins sold between 2009 and April 2016. Europe is the largest regional market with more than 500,000 plug-in electric passenger cars and vans registered through May 2016.
- ^ Cobb, Jeff (2016-10-17). "China Now Ties US For Leadership In Cumulative Global Plug-In Sales". HybridCars.com. Retrieved 2016-10-17. As of September 2016, the U.S. and China are technically tied for first place as the world's largest plug-in passenger car market. The U.S. has cumulative plug-in car sales of 522,519 units while China has 521,649 domestically produced plug-in cars. Europe is still the world's largest regional market with almost 50,000 more units sold that both countries, totaling about 570,000 light-duty plug-in vehicles.
- ^ King, Danny (2016-12-29). "China far ahead of US, Europe in total electric vehicle sales". Autoblog.com. Retrieved 2017-01-08.
Last year, China overtook both the US and Europe in annual sales of electric vehicles and plug-in hybrids. This year, it will move ahead of both the US and Europe in cumulative plug-in vehicle sales.
- ^ International Energy Agency (IEA), Clean Energy Ministerial, and Electric Vehicles Initiative (EVI) (May 2018). "Global EV Outlook 2017: 3 million and counting" (PDF). IEA Publications. Retrieved 2018-10-22.CS1 maint: multiple names: authors list (link) See pp. 9–10, 19–23, 29–28, and Statistical annex, pp. 107–113.
- ^ European Automobile Manufacturers Association (ACEA) (2021-02-04). "New Passenger Car Registrations By Fuel Type In The European Union: Quarter 4 2020" (PDF). ACEA. Retrieved 2020-02-05. See table: Total Electric Rechargeable Vehicles (ECV) - New Passenger Car Registrations By Market In The EU + EFTA. Shows Total registrations for EU + EFTA + UK in Q1-Q4 20199 and 2020. A total of 1,364,813 plug-in cars were registered in 2020, up from 559,871 in 2019 (+143.8%).
- ^ China Association of Automobile Manufacturers (CAAM) (2021-01-14). "Sales of New Energy Vehicles in December 2020". CAAM. Retrieved 2021-02-08. NEV sales in China totaled 1.637 million in 2020, consisting of 1.246 million passenger cars and 121,000 commercial vehicles.
- ^ a b Argonne National Laboratory (February 2021). "Light Duty Electric Drive Vehicles Monthly Sales Updates: Plug-In Vehicle Sales". Argonne National Laboratory. Retrieved 2021-02-12.
Cumulatively, 297,939 PHEVs and BEVs have been sold in 2020. In total, 1,741,566 PHEVs and BEVs have been sold since 2010.
- ^ Stacy C. Davis; Susan W. Diegel & Robert G. Boundy (July 2014). "Transportation Energy Data Book Edition 33" (PDF). Office of Energy Efficiency and Renewable Energy, U.S. Department of Energy. Archived from the original (PDF) on 2015-06-30. Retrieved 2014-09-02. See Table 6.5: Hybrid and Plug-in Vehicle Sales, 1999-2013, pp. 6-9.
- ^ a b c d e Cobb, Jeff (2017-01-05). "December 2016 Dashboard". HybridCars.com and Baum & Associates. Retrieved 2017-01-06. Plug-in electric car sales in the U.S. totaled 157,181 units, consisting of 84,246 all-electric cars and 72,935 plug-in hybrids. The plug-in car segment achieved a market share of 0.90% of new car sales. December sales totaled 23,288 units with a market share of 1.39%. The top selling model in 2016 was the Tesla Model S with 29,156 units sold, followed by the Chevrolet Volt (24,739) and the Tesla Model X (18,028).
- ^ Jeff Cobb (2014-01-06). "December 2013 Dashboard". HybridCars.com and Baum & Associates. Retrieved 2014-01-07.
- ^ Jeff Cobb (2015-01-06). "December 2014 Dashboard". HybridCars.com and Baum & Associates. Retrieved 2015-01-06.
- ^ a b c Kane, Mark (2019-02-04). "US Plug-In Electric Car Sales Charted: January 2019". InsideEVs.com. Retrieved 2019-02-05. See Graph: "Top 10 U.S. Plug-in cars (cumulative sales)" In January 209 the Tesla Model 3 (148,046) overtook the Model S (144,767). The Chevrolet Volt (152,819) continues as the all-time best selling plug-in car in the U.S.
- ^ a b Kane, Mark (2019-03-12). "US Plug-In Electric Car Sales Charted: February 2019". InsideEVs.com. Retrieved 2019-03-12.
- ^ Cobb, Jeff (2016-07-26). "Top-Selling Chevy Volt Crosses 100,000 US Sales Milestone". HybridCars.com. Retrieved 2016-07-26. As of June 2016, around 117,000 units of the Volt/Ampera family have been sold globally, including close to 10,000 Opel/Vauxhall Ampera variants sold in Europe. Volt sales in the American market passed the 100,000 milestone in July 2016.
- ^ Cobb, Jeff (2016-11-01). "Nissan Leaf Second Plug-in Ever To Sell 100,000 In US". HybridCars.com. Retrieved 2016-11-01. Since December 2010, about 239,000 Leafs have been sold worldwide through September 2016. The U.S. is the world's largest market with 100,241 units sold through October 2016. Ranking second is Japan with 69,833 units followed by Europe with about 63,000 units, both, through September 2016.
- ^ Loveday, Eric (2017-06-19). "Tesla Model S Sales Surpass 100,000 in U.S." InsideEVs.com. Archived from the original on 2017-08-05. Retrieved 2017-08-04.
- ^ Loveday, Eric (2017-06-23). "Tesla Model S Sales Hit 100,000 In U.S. Quicker Than Chevy Volt, Nissan LEAF". InsideEVs.com. Retrieved 2017-08-04.
- ^ a b c Loveday, Eric (2018-12-04). "Tesla Model 3 Sales Charge Way Past Milestone Of 100,000 In U.S." InsideEVs.com. Retrieved 2018-12-09.
- ^ Kane, Mark (2019-01-25). "Top 3 Plug-In Hybrid Cars In U.S. In 2018: Prius Prime, Clarity, Volt". InsideEVs.com. Retrieved 2019-01-25. The Chevrolet Volt is the best selling plug-in electric car in the U.S. with 152,144 units sold through the end of 2018.
- ^ a b HybridCars.com and Baum & Associates. "HybridCars Dashboard". HybridCars.com. Retrieved 2019-01-25. Sales reporting ended in June 2018.
- ^ Jerry Hirsch (2012-07-13). "Plug-in hybrid sales soar; all-electric cars stay in low gear". Los Angeles Times. Retrieved 2013-02-12.
- ^ a b c d Cobb, Jeff (2016-09-01). "Americans Buy Their Half-Millionth Plug-in Car". HybridCars.com. Retrieved 2016-09-02. See other figures in graphs.
- ^ Stacy C. Davis & Robert G. Boundy (April 2020). "Transportation Energy Data Book: Edition 38.1" (PDF). Oak Ridge National Laboratory, Office of Energy Efficiency and Renewable Energy, U.S. Department of Energy. Retrieved 2020-05-14. See Tables 6.1 and 6.2
- ^ Norihiko Shirouzu, Yoko Kubota & Paul Lienert (2013-02-04). "Insight: Electric cars head toward another dead end". Reuters. Retrieved 2013-02-24.
- ^ Jeff Cobb (2014-09-09). "Americans Buy Their 250,000th Plug-In Car". HybridCars.com. Retrieved 2014-09-09. As of August 2014, sales are led by the Chevrolet Volt plug-in hybrid with 67,698 units, followed by the Nissan Leaf electric car with 61,063 units. The total of 250,609 units sold includes 1,800 Roadsters, 1,600 Fisker Karmas, and 500 Mini Es usually not captured by most statistics.
- ^ Argonne National Laboratory (2013-01-14). "Fact #762: Sales from Introduction: Hybrid Vehicles vs. Plug-in Vehicles". Office of Energy Efficiency and Renewable Energy. Retrieved 2013-02-24.
- ^ Voelcker, John (2016-11-02). "Electric car sales remain ahead of hybrids after five years". Green Car Reports. Retrieved 2016-11-05.
- ^ Melissa C. Lott (2013-02-20). "Electric Vehicle Deployment – Where Should We Be Today?". Scientific American. Retrieved 2013-02-24.
- ^ a b O’Dell, John (2016-09-12). "Used plug-in cars could be a bargain". Christian Science Monitor. Retrieved 2016-09-13.
- ^ Hardman, Scott; Tal, Gil (2016). "Exploring the Decision to Adopt a High-End Battery Electric Vehicle: Role of Financial and Nonfinancial Motivations". Transportation Research Record: Journal of the Transportation Research Board. US. 2572: 20–27. doi:10.3141/2572-03. S2CID 114228923. Retrieved 2016-09-17.
- ^ a b c d Matt Ritchel (2015-11-24). "A Car Dealers Won't Sell: It's Electric". The New York Times. Retrieved 2015-11-28.
- ^ a b c d Eric Cahill & Dan Sperling (2014-11-03). "The Future Of Electric Vehicles Part 1: Car Dealers Hold The Key". Institute of Transportation Studies (ITS), at the University of California, Davis. Retrieved 2015-11-28.
- ^ "High Costs, Lack of Awareness Threaten to Short Out Electric Vehicle Adoption - Business Wire". 2016-12-08. Retrieved 2017-01-02.
- ^ Cahill, Eric; Davies-Shawhyde, Jamie; Turrentine, Thomas S. (October 2014). "New Car Dealers and Retail Innovation in California's Plug-In Electric Vehicle Market". Institute of Transportation Studies (ITS), at the University of California, Davis. Retrieved 2015-11-29. Working Paper – UCD-ITS-WP-14-04. Click on the bar "Download PDF"
- ^ Eric Evarts (2014-04-22). "Dealers not always plugged in about electric cars, Consumer Reports' study reveals". Consumer Reports. Retrieved 2015-11-29.
- ^ Cobb, Jeff (2016-08-09). "California Continues To Pull More Than Its Weight In Plug-in Car Sales". HybridCars.com. Retrieved 2016-08-29. As of July 2016, California's plug-in car concentration was 5.83 registrations per 1,000 people, the U.S. was 1.51 per 1,000. Norway exceeds California by 3.69 times, California narrowly outpaces the Netherlands by 1.04 times.
- ^ a b Cobb, Jeff (2016-09-01). "Americans Buy Their Half-Millionth Plug-in Car: Concentration of plug-in electrified car registrations per 1,000 people". HybridCars.com. Retrieved 2016-09-04. As of July 2016, Norway had a concentration of registered plug-in cars per 1,000 people of 21.52, the Netherlands of 5.63, California of 5.83, and the United States national average was 1.52.
- ^ a b c d U.S. Department of Energy, Office of Energy Efficiency and Renewable Energy (EERE), Vehicle Technologies Office (2018-12-10). "Fact #1059: December 10, 2018 California had the most plug-in vehicle registrations per 1,000 people in 2017". Vehicle Technologies Office. Retrieved 2019-01-26.CS1 maint: multiple names: authors list (link)
- ^ U.S. Department of Energy, Office of Energy Efficiency and Renewable Energy (EERE), Vehicle Technologies Office (2018-12-24). "Fact #1061: Vermont Had a Growth Rate of 56.4% for Plug-in Vehicle Registrations per Capita from 2016 to 2017". Vehicle Technologies Office. Retrieved 2019-01-26.CS1 maint: multiple names: authors list (link)
- ^ a b c d e f g Jay Cole (2014-09-13). "Exclusive: Georgia Leads US In EV Adoption For 2014". InsideEVs.com. Retrieved 2014-09-15. Source: IHS Automotive with R.L. Polk & Company new vehicle registration data.
- ^ a b c d e f Mike Ramsey (2014-06-02). "States With the Most and Least Electric-Vehicle Sales". The Wall Street Journal. Retrieved 2014-09-20. Sales of new all-electric vehicles in the 12 months that ended March 31, 2014. Source: IHS Automotive.
- ^ a b c d e f Mike Ramsey (2014-06-04). "Atlanta's Incentives Lift Electric Car Sales". The Wall Street Journal. Retrieved 2014-09-28. Sales of new all-electric vehicles in the 12 months that ended March 31, 2014. Source: IHS Automotive.
- ^ David C. Smith (2013-08-07). "Scrappage Rate Hits Historic High, Bodes Well for Future". Wards Auto. Archived from the original on 2013-08-13. Retrieved 2013-08-14.
- ^ Gene Balk (2013-08-20). "Seattle among cities that dominate U.S. electric vehicle sales". The Seattle Times. Archived from the original on 2013-10-18. Retrieved 2013-10-01.
- ^ Greg Asciutto (2013-09-25). "Santa Monica a top city for electric vehicles". Santa Monica Daily Press. Retrieved 2013-09-29.
- ^ Jaclyn Trop (2013-09-20). "Santa Monica Bets on Electric Cars, but Consumers Are Slow to Switch". The New York Times. Retrieved 2013-09-29.
- ^ a b California New Car Dealers Association (CNCDA) (February 2019). "New Vehicle Registrations Remained Above 2 million Units in 2018" (PDF). CNCDA. Retrieved 2019-02-21. See section: "Electric Vehicle Registrations Increased Sharply in 2018" - Figures for 2017 were revised. Registrations from 2014 to 2018.
- ^ California New Car Dealers Association (CNCDA) (February 2016). "California New Vehicle Registrations Expected to Remain Above 2 Million Units in 2016" (PDF). CNCDA. Archived from the original (PDF) on 2016-02-17. Retrieved 2016-02-17. Registrations through December 2015 since 2011. Revised figures for 2014.
- ^ a b Scauzillo, Steve (2018-02-04). "California on path to meet goal of 1.5 million electric cars, but charging stations lag behind". Press-Telegram. Retrieved 2018-02-05.
- ^ Szczesny, Joseph (2018-12-11). "Sales of Electric Vehicles Growing Steadily in California". The Detroit Bureau. Retrieved 2018-12-13.
- ^ "California EV Sales Top 500,000". VELOZ. Environmental Protection Online. 2018-12-11. Retrieved 2018-12-13.
- ^ Jeff Cobb (2015-03-18). "Californians Bought More Plug-in Cars Than China Last Year". HybridCars.com. Retrieved 2015-03-18.
- ^ Dana Hull (2014-09-08). "California charges ahead with electric vehicles". San Jose Mercury News. Retrieved 2015-03-15.
- ^ Cobb, Jeff (2016-02-17). "California Plug-in Sales Led The US Last Year With Nearly Five-Times Greater Market Share". HybridCars.com. Retrieved 2016-02-18. California's plug-in electric car market share was 3.1%, ranking behind only two countries, the Netherlands (9.7%) and Norway (22.7%). The administrative territory of Hong Kong also had a higher market share of 4.8%.
- ^ Cobb, Jeff (2016-11-14). "California Celebrates One-Quarter Million Plug-in Cars Sold". HybridCars.com. Retrieved 2016-11-15.
- ^ California New Car Dealers Association (CNCDA) (February 2017). "State New Vehicle Market Up Slightly in 2016; Similar Outlook for 2017" (PDF). CNCDA. Archived from the original (PDF) on 2018-02-17. Retrieved 2017-02-24. Registrations through December 2016 since 2012. Revised figures for 2015.
- ^ California New Car Dealers Association (CNCDA) (February 2018). "New Vehicle Registrations in State Predicted to Exceed 2 Million Units Again in 2018" (PDF). CNCDA. Archived from the original (PDF) on 2018-02-17. Retrieved 2018-02-17. Registrations through December 2017 since 2013.
- ^ Kane, Mark (2019-02-21). "Electric Cars Outsell Hybrids In California: Tesla Model 3 Tops In Class". Inside EVs. Retrieved 2019-02-22.
- ^ California Department of Motor Vehicles (March 2014). "Clean Air Vehicle (CAV) Decals - High Occupancy Vehicle HOV Lane Usage". DMV California. Retrieved 2014-03-23.
- ^ California Air Resources Board (CARB) (2016-09-19). "Eligible vehicle list: Single ocuupant carpool lane stickers". CARB. Retrieved 2016-09-19.
- ^ Cobb, Jeff (2016-09-19). "California Removes 'Green Sticker' Cap For Unlimited PHEV Solo-HOV Lane Access". HybridCars.com. Retrieved 2016-09-19.
- ^ Edelstein, Stephen (2015-07-15). "California Ends Electric-Car Rebates For Wealthiest Buyers, Boosts Them For Poorest". Green Car Reports. Retrieved 2015-07-28.
- ^ Millikin, Mike (2016-11-08). "Berkeley study finds clean vehicle rebates have predominantly benefited wealthy, white Californians". Green Car Congress. Retrieved 2016-11-09.
- ^ Nikolewski, Rob (2016-10-31). "California's electric-car rebates jump for lower-income buyers and vanish for more high earners". Los Angeles Times. Retrieved 2016-11-09.
- ^ Alexi Friedman (2014-06-29). "Report urges NJ must do more to promote 'promise of electric vehicles'". The Star-Ledger. Retrieved 2014-09-27.
- ^ a b c Urvaksh Karkaria & Dave Williams (2014-08-08). "Atlanta eying incentives to install vehicle chargers". Atlanta Business Chronicle. Retrieved 2014-09-27.
- ^ Eric Loveday (2013-09-04). "Atlanta Becomes #1 Market for Nissan LEAF". InsideEVs.com. Retrieved 2014-09-28.
- ^ Georgia Department of Natural Resources. "Low Emission "Alternative Fuel" Vehicle Tax Credits in Georgia". Environmental Protection Division, Air Protection Branch. Archived from the original on 2014-09-18. Retrieved 2014-09-27.
- ^ Office of Energy Efficiency and Renewable Energy (2014-06-04). "Georgia Laws and Incentives". Alternative Fuels Data Center. Retrieved 2014-09-28.
- ^ Plug-in Georgia. "Georgia's Alternative Fuel Vehicle Incentives". PluginGeorgia.com. Retrieved 2014-09-27. Download the Word file "GA_AFV_Incentive_Guide.docx"
- ^ a b PlugIncentives.org (2014-09-04). "List of U.S. Electric Vehicle and EVSE Incentives by State". PlugIncentives.org. Archived from the original on 2015-04-02. Retrieved 2014-09-27.
- ^ a b Mary Landers (2014-09-26). "Getting a charge from electric vehicles in Savannah". Savannah Morning News. Retrieved 2014-09-28.
- ^ John Gartner (2013-09-26). "Hawaii Becoming an EV Paradise". PluginCars.com. Retrieved 2013-09-30.
- ^ Berkeley Law, University of California, Berkeley and Maui College, University of Hawaiʻi (September 2013). "Electric Vehicle Paradise: How Hawai'i Can Lead the World in Deployment" (PDF). Maui Vehicle Alliance (Maui EVA). Archived from the original (PDF) on 2014-04-27. Retrieved 2013-09-30.CS1 maint: multiple names: authors list (link)
- ^ Staff (2013-07-19). "Friday Factoid: Hybrid and Electric Cars in Hawaii". The Civil Beat. Retrieved 2014-09-24. Click on graph for annual sales of PEVS.
- ^ Eric Loveday (2013-07-31). "Electric Vehicles Registrations Up 83% Percent in Hawaii". InsideEVs.com. Retrieved 2014-09-23.
- ^ Research & Economic Analysis Division, DBEDT (September 2014). "Monthly Energy Trend Highlights August 2014" (PDF). Hawaii State Department of Business, Economic Development & Tourism (DBEDT). Retrieved 2014-09-24. See Registered Taxable Vehicles, pp. 2.
- ^ "Hawaii's Electric Vehicle (EV) Rebate Program". Retrieved 2010-08-16.
- ^ Yonan, Alan Jr. (2012-05-18). "State runs short of funds for EV rebate". Honolulu Star-Advertiser. Retrieved 2014-09-20. (subscription required)
- ^ Campbell, Colin (2016-04-18). "Electric car excitement remains limited in Maryland". The Baltimore Sun. Retrieved 2016-04-19.
- ^ "Plug-In Electric Vehicle (PEV) Tax Credit". Alternative Fuels Data Center, U.S. DoE. 2014-06-04. Retrieved 2016-04-19.
- ^ "Electric Vehicle Supply Equipment (EVSE) Rebate Program". Alternative Fuels Data Center, U.S. DoE. 2014-06-04. Retrieved 2016-04-19.
- ^ "New Electric Vehicle Charging Stations Installed at Niagara Falls International Airport to Mark National Drive Electric Week" (Press release). Niagara Falls: New York Power Authority. 2014-09-14. Archived from the original on 2014-10-06. Retrieved 2014-10-25.
- ^ New York State Department of Transportation (NYSDOT) (2014-07-28). "New York's Clean Pass Program". NYSDOT. Retrieved 2014-10-25.
- ^ a b Jim Motavalli (2013-11-18). "Why some states are selling more electric cars than others". Mother Nature Network. Retrieved 2014-09-28.
- ^ Brad Berman (2014-08-25). "Federal and Local Incentives for Plug-in Hybrids and Electric Cars". PluinCars.com. Retrieved 2014-09-28.
- ^ Electric Avenue Initiative (June 2012). "Charging Forward: lessons learned from the first six months at Electric Avenue" (PDF). Portland State University. Retrieved 2014-09-28.
- ^ National Automobile Dealers Association (NADA) (2014). "NADA Data 2014: Annual Financial Profile of America's Franchised New-Car Dealerships" (PDF). NADA. Archived from the original (PDF) on 2014-10-25. Retrieved 2014-09-27. See table "Total light vehicles in operation in 2013, by state" pp. 16.
- ^ a b c d Stephen Edelstein (2014-05-08). "Texas Electric-Car Purchase Rebates Up To $2,500 To Start Soon". Green Car Reports. Retrieved 2014-09-27.
- ^ a b "TCEQ Accepting Applications for Light-Duty Purchase or Lease Incentive Program". Lone Star Clean Fuels Alliance. May 2014. Archived from the original on 2014-09-28. Retrieved 2014-09-27.
- ^ Texas Commission on Environmental Quality (TCEQ) (2014-09-23). "Light-Duty Motor Vehicle Purchase or Lease Incentive Program". TCEQ. Archived from the original on 2014-09-17. Retrieved 2014-09-27.
- ^ David Noland (2013-10-22). "Tesla Underground: Texas Franchise Rules Make Model S Owners Skirt The Law". Green Car Reports. Retrieved 2014-09-27.
- ^ Texas Commission on Environmental Quality (TCEQ) (2014-08-29). "Texas Commission on Environmental Quality (TCEQ) Light-Duty Motor Vehicle Purchase or Lease Incentive Program (LDPLI) - Eligible Vehicle List" (PDF). TCEQ. Archived from the original (PDF) on 2014-09-17. Retrieved 2014-09-27.
- ^ Texas River Cities Plug-In Electric Vehicle Initiative (2014-09-16). "Texas River Cities Plug-In Electric Vehicle Initiative". Central Texas Fuel Independence Project. Retrieved 2014-09-27.
- ^ Texas River Cities Plug-In Electric Vehicle Initiative (TRC). "Executive Summary of the Texas River Cities Plug-in Electric Vehicle Infrastructure Plan" (PDF). Central Texas Fuel Independence Project. Retrieved 2014-09-27.
- ^ Pecan Street Inc. "The Pecan Street Project". PecanStreet.org. Archived from the original on 2014-09-27. Retrieved 2014-09-27.
- ^ Bryan Walsh (2014-06-24). "Is This America's Smartest City?". Time. Retrieved 2014-09-27.
- ^ Texas River Cities Plug-In Electric Vehicle Initiative (TRC). "Texas River Cities Plug-in Electric Vehicle Initiative Regional Plan and Final Report" (PDF). Central Texas Fuel Independence Project. Retrieved 2014-09-27. See pp. 3
- ^ David Biello (2013-06-18). "Will You or the Grid Control Your Electric Car?". Scientific American. Retrieved 2014-09-27.
- ^ a b "PEV Registration by County by Make" (PDF). West Coast Green Highway. Washington State Department of Transportation. Retrieved 22 April 2017.
- ^ a b Office of Energy Efficiency and Renewable Energy (2014-06-04). "Alternative Fuel Vehicle (AFV) Tax Exemption (Washington state)". Alternative Fuels Data Center. Retrieved 2014-09-28.
- ^ Banse, Tom (2015-07-01). "Tesla, BMW Culled From Washington State Electric Car Sales Tax Break". Oregon Public Broadcasting (OPB). Retrieved 2016-04-20.
- ^ "Alternative Fuel Vehicle (AFV) Tax Exemption". Alternative Fuels Data Center, U.S. DoE. Retrieved 2021-06-17.
- ^ Puget Sound Energy (PSE). "Electric vehicle charger rebate". PSE. Retrieved 2014-09-28.
- ^ Office of Energy Efficiency and Renewable Energy (2014-06-04). "Electric Vehicle Supply Equipment (EVSE) Rebate - PSE (Washington state)". Alternative Fuels Data Center. Retrieved 2014-09-28.
- ^ a b c "Monthly Plug-In Sales Scorecard". InsideEVs.com. December 2018. Retrieved 2019-01-27.
- ^ Malone, Wade (2018-12-08). "These 10 Vehicles Make Up 84 Percent Of The U.S. Plug-In Market". InsideEVs.com. Retrieved 2018-12-09.
- ^ Cobb, Jeff (2017-02-09). "There Are Now More Plug-in Cars For Sale In the US Than Hybrids". HybridCars.com. Retrieved 2017-02-10.
- ^ Jeff Cobb (2014-08-13). "Has The Electrification Revolution Fizzled?". HybridCars.com. Retrieved 2014-08-13.
- ^ Jeff Cobb (2014-11-14). "Eight Perks of Owning an Electric Car". HybridCars.com. Retrieved 2014-11-15.
- ^ Eric Loveday (2013-12-20). "Porsche Panamera S E-Hybrid Available at All Porsche Dealerships Nationwide". InsideEVs.com. Retrieved 2014-11-15.
- ^ Alysha Webb (2014-02-26). "Cadillac ELR Is Selling Nationwide, But At Only About Half of Dealerships". PluginCars.com. Retrieved 2014-11-15.
- ^ a b c Mark Rogowsky (2014-01-16). "Tesla Sales Blow Past Competitors, But With Success Comes Scrutiny". Forbes. Retrieved 2014-01-18. Almost 18,000 units were sold in the U.S. in 2013.
- ^ Cobb, Jeff (2018-01-16). "Top 5 Best Selling Plug-in Cars – 2017". HybridCars.com. Retrieved 2018-01-21. The top 5 selling models in the U.S. in 2017 were the Tesla Model S with about 26,500 units, followed by the Chevrolet Bolt (23,297), Tesla Model X (~21,700), Toyota Prius Prime (20,936), and the Chevrolet Volt (20,349). The five best sellers accounted for 112,782 sales out of the 194,479 (58%).
- ^ Mark Kane (2019-01-03). "U.S. Tesla Sales In December 2018 Up By 249%". Inside EVs. Retrieved 2019-01-24. Cumulative sales in the U.S. of the three Tesla models available in 2018 totaled 351,298 vehicles, consisting of 143,892 Model S cars, 141,546 Model 3 cars, and 65,852 Model X SUVs, all, since inception.
- ^ Bridie Schmidt (2019-04-15). "Tesla Model 3 becomes all-time best-selling electric car in US". EV Adoption. The Driven. Retrieved 2019-04-15.
- ^ Jeffrey N. Ross (2015-05-21). "Last First-Gen Chevy Volt Rolls Off The Assembly Line". TopSpeed.com. Retrieved 2015-06-14.
- ^ Jeff Cobb (2015-11-03). "2016 Volts Account For 1,324 Sales Out Of 2,035 October Deliveries". HybridCars.com. Retrieved 2015-11-03.
- ^ "Final Chevrolet Volt Heads To GM Heritage Center". GM Authority. 2019-02-28. Retrieved 2019-03-02.
- ^ Kane, Mark (2021-01-08). "US: Nissan LEAF Sales Were Decent In Q4, But 2020 Was Its Worst Year Ever". InsideEVs.com. Retrieved 2021-01-08.
- ^ Cobb, Jeff (2016-11-02). "October 2016 Dashboard". HybridCars.com and Baum & Associates. Retrieved 2016-11-04. Tesla sales for 3Q 2016 have been restated based upon information provided from the company corresponding to U.S. sales during 3Q 2016. Tesla reported 9,156 Model S and 5,428 Model X sold during the third quarter of 2016. The combined effect of both models totaled 1,116 less units than originally estimated, so the revised current-year-to-date figure for sales through September is 108,397 units. The revised CYTD figure for Model S is 20,856 and 12,328 for the Model X. October sales figures already reflect this adjustment.
- ^ Cobb, Jeff (2016-12-02). "November 2016 Dashboard". HybridCars.com and Baum & Associates. Retrieved 2016-12-03.
- ^ Brad Berman (2015-05-01). "Toyota Halts Production of Prius Plug-in Hybrid Until Late 2016". Plugincars.com. Retrieved 2015-06-20.
- ^ Staff (2016-12-01). "Monthly Plug-In Sales Scorecard". InsideEVs.com. Retrieved 2016-12-01. During the first nine months of 2016 Prius PHV sales totaled 52 units. None was sold in October 2016 as dealerships run out of stock of the first generation model
- ^ Cole, Jay (2016-12-02). "Several Plug-Ins Hit New 2016 Highs, As November EV Sales In US Rise Sharply". InsideEVs.com. Retrieved 2016-12-02.
- ^ Krisher, Tom (2018-04-26). "Ford to discontinue all cars except for Mustang and Focus hatch". Chicago Tribune. Retrieved 2019-01-27.
- ^ BMW of North America (2021-01-05). "BMW of North America Reports Q4 2020 and Full Year 2020 U.S. Sales Results". Woodcliff Lake, N.J.: BusinessWire. Retrieved 2021-02-15. A total of 1,508 BMW i3s and 191 BMW i8s were sold in the U.S. in 2020.
- ^ Cole, Jay (2017-02-18). "19,130 BMW i3 REx Recalled In US Due To Fire Risk…Thanks To Its Gas Extender". InsideEVs.com. Retrieved 2017-02-19.
- ^ Hendrickson, Gail; Kelly, Ross (May 2005). "The Drive to Efficient Transportation" (PDF). Alliance to Save Energy: 36. Archived from the original (PDF) on 2007-07-15. Retrieved 2007-08-30. Cite journal requires
|journal=(help) - ^
"Low-Speed Vehicles". Hawaii Senate. 1999: 3. Retrieved 2007-08-30. Cite journal requires
|journal=(help) - ^ "Advanced Vehicle Testing Activity: Neighborhood Electric Vehicles". United States Department of Energy, Office of Energy Efficiency and Renewable Energy. Retrieved 2007-08-30. Cite journal requires
|journal=(help) - ^ Alternative Transport Vehicles
- ^ Stephen Edelstein (2015-11-03). "Polaris Updates GEM Low-Speed Electric Vehicles". Green Car Reports. Retrieved 2015-11-22.
- ^ "EV startup Canoo is gearing up for production in Oklahoma factory".
External links[]
| Wikimedia Commons has media related to Electrically-powered vehicles in the United States. |
- 18 Hurdles Electrified Vehicles Are Having To Overcome, HybridCARS, May 2016.
- 2013 VehicleTechnologies Market Report, Oak Ridge National Laboratory
- 2013 ZEV Action Plan: A roadmap toward 1.5 million zero-emission vehicles on California roadways by 2025, Office of the Governor of California, February 2013.
- AAA Electric Vehicle webpage (American Automobile Association)
- A Guide to the Lessons Learned from the Clean Cities Community Electric Vehicle Readiness Projects, Clean Cities, U.S. Department of Energy, January 2013.
- California: Beyond cars? Bulletin of the Atomic Scientists, Tom Turrentine, August 2014.
- Clean Car Calculator (Institute for Energy Efficiency)
- Clean Cities - 2014 Vehicle Buyer's Guide, National Renewable Energy Laboratory (NREL), U.S. Department of Energy, December 2013.
- Cleaner Cars from Cradle to Grave, Union of Concerned Scientists, November 2015.
- Cradle-to-Grave Lifecycle Analysis of U.S. Light-Duty Vehicle-Fuel Pathways: A Greenhouse Gas Emissions and Economic Assessment of Current (2015) and Future (2025-2030) Technologies (includes estimated cost of avoided GHG emissions from BEVs and PHEVs in the U.S.), Argonne National Laboratory, June 2016.
- Driving Cleaner - More Electric Vehicles Mean Less Pollution, Environment North Carolina Research & Policy Center, June 2014.
- Early Plug-in Electric Vehicle Sales: Trends, Forecasts, and Determinants, Luskin Center for Innovation, UCLA, July 2012
- Effects of Federal Tax Credits for the Purchase of Electric Vehicles Congressional Budget Office, September 2012
- Effects of Regional Temperature on Electric Vehicle Efficiency, Range, and Emissions in the United States, Tugce Yuksel and Jeremy Michalek, Carnegie Mellon University. 2015
- eGallon Calculator: Compare the costs of driving with electricity, U.S. Department of Energy
- Electric drive vehicle sales figures (U.S. Market) - EV sales, Electric Drive Transportation Association
- Electric Vehicles and Public Charging Infrastructure: Impediments and Opportunities for Success in the United States, Texas A&M Transportation Institute, July 2013
- Electric Vehicle Guide, Sierra Club
- Electric Vehicle Paradise: How Hawai'i Can Lead the World in Deployment, Center for Law, Energy and the Environment at the University of California, Berkeley, September 2013
- Electric Vehicle Sales Analysis, Luskin Center for Innovation, UCLA, August 2013
- Electric Vehicle Timeline: Electric Cars, Plug-In Hybrids, and Fuel Cell Vehicles (1900-2014), Union of Concerned Scientists
- Emissions Associated with Electric Vehicle Charging: Impact of Electricity Generation Mix, Charging Infrastructure Availability, and Vehicle Type, National Renewable Energy Laboratory, U.S. Department of Energy, April 2016.
- EPA Green Vehicle Guide
- EV Driver Survey Dashboard, California's Clean Vehicle Rebate Project (CVRP)
- EV Everywhere Grand Challenge Blueprint, U.S. Department of Energy, January 2013.
- Evaluating the Impact of High Occupancy Vehicle (HOV) Lane Access on Plug-In Vehicles (PEVs) Purchasing and Usage in California, University of California, Davis, Working Paper UCD-ITS-WP-14-01, 2014
- Exploring the Impact of the Federal Tax Credit on the Plug-In Vehicle Market, Journal of the Transportation Research Board, 2016.
- Fact Sheet: Plug-in Electric Vehicles (2014), Environmental and Energy Study Institute, June 2014.
- Federal Tax Credits For Plug-In Hybrids, Electric Cars: What You Need To Know, The Washington Post, August 2014.
- Global EV Outlook - Understanding the Electric Vehicle Landscape to 2020, International Energy Agency (IEA), April 2013
- How Clean is Your Electric Vehicle?, Union of Concerned Scientists on-line tool to calculate carbon emissions for a given plug-in car model according to the corresponding U.S. ZIP code.
- Influence of driving patterns on life cycle cost and emissions of hybrid and plug-in electric vehicle powertrains, Carnegie Mellon Vehicle Electrification Group
- Leading Edge of Electric Vehicle Market Development in the United States: An Analysis of California Cities, International Council on Clean Transportation, White Paper, September 2016.
- Light-Duty Automotive Technology, Carbon Dioxide Emissions, and Fuel Economy Trends: 1975 Through 2014 (See Chapter 7), U.S. Environmental Protection Agency, October 2014.
- Light Duty Electric Drive Vehicles Monthly Sales Updates, Argonne National Laboratory
- List of vehicles eligible for California's single occupant carpool lane stickers
- List of U.S. Electric Vehicle and EVSE Incentives by State, September 2014
- Model Year 2014 Fuel Economy Guide, U.S. Environmental Protection Agency and U.S. Department of Energy, August 2014 (see pp. 33–36 for plug-in electric models available).
- New Car Dealers and Retail Innovation in California’s Plug-In Electric Vehicle Market. Institute of Transportation Studies, University of California, Davis, Working Paper UCD-ITS-WP-14-04, 2014.
- Overcoming Barriers to Electric-Vehicle Deployment: Interim Report (2013), Transportation Research Board, U.S. National Research Council
- Plug-In Electric Vehicles: A Case Study of Seven Markets (Norway, Netherlands, California, United States, France, Japan, and Germany), UC Davis, October 2014.
- Plug-In Electric Vehicle Handbook for Workplace Charging Hosts, Clean Cities, U.S. Department of Energy, August 2013
- Plug-in Electric Vehicles: the First Three Years (of the post-modern electric-vehicle era) Dec 2010 — Nov 2013, Luskin Center for Innovation, UCLA, December 2013
- Qualified Plug-In Electric Drive Motor Vehicles (IRC 30D), Internal Revenue Service (IRS), June 2014
- Roadmap to Climate-Friendly Cars: 2013, Climate Central, August 2013.
- State of the Plug-in Electric Vehicle Market, Electrification Coalition, July 2013.
- Supporting the Plug-In Electric Vehicle Market - Best Practices from State Programs, Georgetown Climate Center, December 2014.
- The Great Debate -- All-Electric Cars vs. Plug-In Hybrids, April 2014.
- Top Ten EPA-Rated Fuel Sippers (2014) - including BEVs and PHEVs
- U.S. PEV Sales by Model, Alternative Fuels and Advanced Vehicle Data Center, U.S. Department of Energy
- Plug-in hybrid vehicles
- Electric vehicles
- Road transportation in the United States