Hyperbolic coordinates
In mathematics, hyperbolic coordinates are a method of locating points in quadrant I of the Cartesian plane
- .

Hyperbolic coordinates take values in the hyperbolic plane defined as:
- .

These coordinates in HP are useful for studying logarithmic comparisons of direct proportion in Q and measuring deviations from direct proportion.
For in take


and
- .

The parameter u is the hyperbolic angle to (x, y) and v is the geometric mean of x and y.
The inverse mapping is
- .

The function is a continuous mapping, but not an analytic function.

Alternative quadrant metric[]
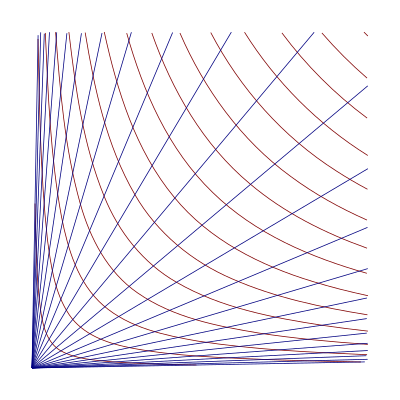
Since HP carries the metric space structure of the Poincaré half-plane model of hyperbolic geometry, the bijective correspondence brings this structure to Q. It can be grasped using the notion of hyperbolic motions. Since geodesics in HP are semicircles with centers on the boundary, the geodesics in Q are obtained from the correspondence and turn out to be rays from the origin or petal-shaped curves leaving and re-entering the origin. And the hyperbolic motion of HP given by a left-right shift corresponds to a squeeze mapping applied to Q.

Since hyperbolas in Q correspond to lines parallel to the boundary of HP, they are horocycles in the metric geometry of Q.
If one only considers the Euclidean topology of the plane and the topology inherited by Q, then the lines bounding Q seem close to Q. Insight from the metric space HP shows that the open set Q has only the origin as boundary when viewed through the correspondence. Indeed, consider rays from the origin in Q, and their images, vertical rays from the boundary R of HP. Any point in HP is an infinite distance from the point p at the foot of the perpendicular to R, but a sequence of points on this perpendicular may tend in the direction of p. The corresponding sequence in Q tends along a ray toward the origin. The old Euclidean boundary of Q is no longer relevant.
Applications in physical science[]
Fundamental physical variables are sometimes related by equations of the form k = x y. For instance, V = I R (Ohm's law), P = V I (electrical power), P V = k T (ideal gas law), and f λ = v (relation of wavelength, frequency, and velocity in the wave medium). When the k is constant, the other variables lie on a hyperbola, which is a horocycle in the appropriate Q quadrant.
For example, in thermodynamics the isothermal process explicitly follows the hyperbolic path and work can be interpreted as a hyperbolic angle change. Similarly, a given mass M of gas with changing volume will have variable density δ = M / V, and the ideal gas law may be written P = k T δ so that an isobaric process traces a hyperbola in the quadrant of absolute temperature and gas density.
For hyperbolic coordinates in the theory of relativity see the History section.
Statistical applications[]
- Comparative study of population density in the quadrant begins with selecting a reference nation, region, or urban area whose population and area are taken as the point (1,1).
- Analysis of the elected representation of regions in a representative democracy begins with selection of a standard for comparison: a particular represented group, whose magnitude and slate magnitude (of representatives) stands at (1,1) in the quadrant.
Economic applications[]
There are many natural applications of hyperbolic coordinates in economics:
- Analysis of currency exchange rate fluctuation:The unit currency sets . The price currency corresponds to . For we find , a positive hyperbolic angle. For a fluctuation take a new priceThen the change in u is:Quantifying exchange rate fluctuation through hyperbolic angle provides an objective, symmetric, and consistent measure. The quantity is the length of the left-right shift in the hyperbolic motion view of the currency fluctuation.
- Analysis of inflation or deflation of prices of a basket of consumer goods.
- Quantification of change in marketshare in duopoly.
- Corporate stock splits versus stock buy-back.


History[]
The geometric mean is an ancient concept, but hyperbolic angle was developed in this configuration by Gregoire de Saint-Vincent. He was attempting to perform quadrature with respect to the rectangular hyperbola y = 1/x. That challenge was a standing open problem since Archimedes performed the quadrature of the parabola. The curve passes through (1,1) where it is opposite the origin (mathematics) in a unit square. The other points on the curve can be viewed as rectangles having the same area as this square. Such a rectangle may be obtained by applying a squeeze mapping to the square. Another way to view these mappings is via hyperbolic sectors. Starting from (1,1) the hyperbolic sector of unit area ends at (e, 1/e), where e is 2.71828…, according to the development of Leonhard Euler in Introduction to the Analysis of the Infinite (1748).
Taking (e, 1/e) as the vertex of rectangle of unit area, and applying again the squeeze that made it from the unit square, yields Generally n squeezes yields A. A. de Sarasa noted a similar observation of G. de Saint Vincent, that as the abscissas increased in a geometric series, the sum of the areas against the hyperbola increased in arithmetic series, and this property corresponded to the logarithm already in use to reduce multiplications to additions. Euler’s work made the natural logarithm a standard mathematical tool, and elevated mathematics to the realm of transcendental functions. The hyperbolic coordinates are formed on the original picture of G. de Saint-Vincent, which provided the quadrature of the hyperbola, and transcended the limits of algebraic functions.


In special relativity the focus is on the 3-dimensional hypersurface in the future of spacetime where various velocities arrive after a given proper time. Scott Walter[1] explains that in November 1907 Hermann Minkowski alluded to a well-known three-dimensional hyperbolic geometry while speaking to the Göttingen Mathematical Society, but not to a four-dimensional one.[2] In tribute to Wolfgang Rindler, the author of a standard introductory university-level textbook on relativity, hyperbolic coordinates of spacetime are called Rindler coordinates.
References[]
- David Betounes (2001) Differential Equations: Theory and Applications, page 254, Springer-TELOS, ISBN 0-387-95140-7 .
- Scott Walter (1999). "The non-Euclidean style of Minkowskian relativity". Chapter 4 in: Jeremy J. Gray (ed.), The Symbolic Universe: Geometry and Physics 1890-1930, pp. 91–127. Oxford University Press. ISBN 0-19-850088-2.
- Coordinate systems
- Hyperbolic geometry