Isolation forest
A major contributor to this article appears to have a close connection with its subject. (December 2021) |
Isolation forest is an anomaly detection algorithm. It detects anomalies using isolation (how far a data point is to the rest of the data), rather than modelling the normal points. In 2007, it was initially developed by Fei Tony Liu as one of the original ideas in his PhD study. The significance of this research lies in its deviation from the mainstream philosophy underpinning most existing anomaly detectors at the time, where all the normal instances are profiled before anomalies are identified as instances that do not conform to the distribution of the normal instances. Isolation forest introduces a different method that explicitly isolates anomalies using binary trees, demonstrating a new possibility of a faster anomaly detector that directly targets anomalies without profiling all the normal instances. The algorithm has a linear time complexity with a low constant and a low memory requirement, which works well with high volume data.[1] [2]

In statistics, an anomaly (a.k.a. outlier) is an observation or event that deviates so much from other events to arouse suspicion it was generated by a different means. For example, the graph in Fig.1 represents ingress traffic to a web server, expressed as the number of requests in 3-hour intervals, for a period of one month. It is quite evident by simply looking at the picture that some points (marked with a red circle) are unusually high, to the point of inducing suspect that the web server might have been under attack at that time. On the other hand, the flat segment indicated by the red arrow also seems unusual and might possibly be a sign that the server was down during that time period.
Anomalies in a big dataset may follow very complicated patterns, which are difficult to detect visually in the great majority of cases. This is the reason why the field of anomaly detection is well suited for the application of Machine Learning techniques.
The most common techniques employed for anomaly detection are based on the construction of a profile of what is “normal”: anomalies are reported as those instances in the dataset that do not conform to the normal profile.[2] Isolation Forest uses a different approach: instead of trying to build a model of normal instances, it explicitly isolates anomalous points in the dataset. The main advantage of this approach is the possibility of exploiting sampling techniques to an extent that is not allowed to the profile-based methods, creating a very fast algorithm with a low memory demand.[1][3][4]
History[]
The Isolation Forest (iForest) algorithm was initially proposed by Fei Tony Liu, Kai Ming Ting and Zhi-Hua Zhou in 2008.[1] The authors took advantage of two quantitative properties of anomalous data points in a sample:
- Few - they are the minority consisting of fewer instances and
- Different - they have attribute-values that are very different from those of normal instances
Since anomalies are "few and different", they are easier to “isolate” compared to normal points. Isolation Forest builds an ensemble of “Isolation Trees” (iTrees) for the data set, and anomalies are the points that have shorter average path lengths on the iTrees.
In 2010, an extension of the algorithm - SCiforest [5] was publish to address the issues of clustered anomalies and utilize random hyperplanes to enhance the algorithm ability to detect axis-paralleled anomalies. These abilities are lacking in the original implementation.
In a later paper, published in 2012[2] the same authors described a set of experiments to prove that iForest:
- has a low linear time complexity and a small memory requirement
- is able to deal with high dimensional data with irrelevant attributes
- can be trained with or without anomalies in the training set
- can provide detection results with different levels of granularity without re-training
In 2013 Zhiguo Ding and Minrui Fei proposed a framework based on iForest to resolve the problem of detecting anomalies in streaming data.[6] More application of iForest to streaming data are described in papers by Tan et al.,[4] Susto et al.[7] and Weng et al.[8]
One of the main problems of the application of iForest to anomaly detection was not with the model itself, but rather in the way the “anomaly score” was computed. This problem was highlighted in a 2018 paper,[9] wherein an improved iForest model named Extended Isolation Forest (EIF) was proposed. The paper describes the improvements made to the original model iForest and how they are able to enhance the consistency and reliability of the anomaly score produced for a given data point. It is not sure if the random slope enhancement proposed in EIF is novel, as a similar construct "random hyperplane" was proposed in SCiForest in 2010, which mitigates the same axis-parallel bias in iForest.
Algorithm[]
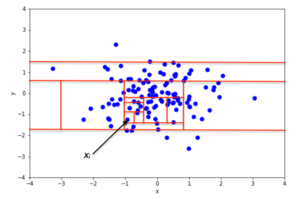
At the basis of the Isolation Forest algorithm, there is the tendency of anomalous instances in a dataset to be easier to separate from the rest of the sample (isolate), compared to normal points. In order to isolate a data point, the algorithm recursively generates partitions on the sample by randomly selecting an attribute and then randomly selecting a split value for the attribute, between the minimum and maximum values allowed for that attribute.
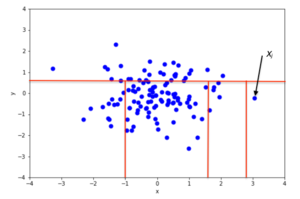
An example of random partitioning in a 2D dataset of normally distributed points is given in Fig. 2 for a non-anomalous point and Fig. 3 for a point that's more likely to be an anomaly. It is apparent from the pictures how anomalies require fewer random partitions to be isolated, compared to normal points.
From a mathematical point of view, recursive partitioning can be represented by a tree structure named Isolation Tree, while the number of partitions required to isolate a point can be interpreted as the length of the path, within the tree, to reach a terminating node starting from the root. For example, the path length of point in Fig. 2 is greater than the path length of in Fig. 3.


More formally, let be a set of d-dimensional points and . An Isolation Tree (iTree) is defined as a data structure with the following properties:


- for each node in the Tree, is either an external-node with no child, or an internal-node with one “test” and exactly two daughter nodes ( and )
- a test at node consists of an attribute and a split value such that the test determines the traversal of a data point to either or .


In order to build an iTree, the algorithm recursively divides by randomly selecting an attribute and a split value , until either

- the node has only one instance, or
- all data at the node have the same values.
When the iTree is fully grown, each point in is isolated at one of the external nodes. Intuitively, the anomalous points are those (easier to isolate, hence) with the smaller path length in the tree, where the path length of point is defined as the number of edges traverses from the root node to get to an external node.


A probabilistic explanation of iTree is provided in the iForest original paper.[1]
Properties of isolation forest[]
- Sub-sampling: since iForest does not need to isolate all of normal instances, it can frequently ignore the big majority of the training sample. As a consequence, iForest works very well when the sampling size is kept small, a property that is in contrast with the great majority of existing methods, where large sampling size is usually desirable.[1][2]
- Swamping: when normal instances are too close to anomalies, the number of partitions required to separate anomalies increases, a phenomenon known as swamping, which makes it more difficult for iForest to discriminate between anomalies and normal points. One of the main reasons for swamping is the presence of too much data for the purpose of anomaly detection, which implies one possible solution to the problem is sub-sampling. Since iForest respond very well to sub-sampling in terms of performance, the reduction of the number of points in the sample is also a good way to reduce the effect of swamping.[1]
- Masking: when the number of anomalies is high it is possible that some of those aggregate in a dense and large cluster, making it more difficult to separate the single anomalies and, in turn, to detect such points as anomalous. Similarly to swamping, this phenomenon (known as “masking”) is also more likely when the number of points in the sample is big, and can be alleviated through sub-sampling.[1]
- High Dimensional Data: one of the main limitation to standard, distance-based methods is their inefficiency in dealing with high dimensional datasets:.[10] The main reason for that is, in a high dimensional space every point is equally sparse, so using a distance-based measure of separation is pretty ineffective. Unfortunately, high-dimensional data also affects the detection performance of iForest, but the performance can be vastly improved by adding a features selection test like Kurtosis to reduce the dimensionality of the sample space.[1][5]
- Normal Instances Only: iForest performs well even if the training set does not contain any anomalous point,[5] the reason being that iForest describes data distributions in such a way that high values of the path length correspond to the presence of data points. As a consequence, the presence of anomalies is pretty irrelevant to iForest's detection performance.
Anomaly detection with isolation forest[]
Anomaly detection with Isolation Forest is a process composed of two main stages:[5]
- in the first stage, a training dataset is used to build iTrees as described in previous sections.
- in the second stage, each instance in the test set is passed through the iTrees build in the previous stage, and a proper “anomaly score” is assigned to the instance using the algorithm described below
Once all the instances in the test set have been assigned an anomaly score, it is possible to mark as “anomaly” any point whose score is greater than a predefined threshold, which depends on the domain the analysis is being applied to.
Anomaly score[]
The algorithm for computing the anomaly score of a data point is based on the observation that the structure of iTrees is equivalent to that of Binary Search Trees (BST): a termination to an external node of the iTree corresponds to an unsuccessful search in the BST.[5] As a consequence, the estimation of average for external node terminations is the same as that of the unsuccessful searches in BST, that is[11]


where is the testing data size, is the size of the sample set and is the harmonic number, which can be estimated by , where is the Euler-Mascheroni constant.


The value of c(m) above represents the average of given , so we can use it to normalise and get an estimation of the anomaly score for a given instance x:

where is the average value of from a collection of iTrees. It is interesting to note that for any given instance :


- if is close to then is very likely to be an anomaly
- if is smaller than then is likely to be a normal value
- if for a given sample all instances are assigned an anomaly score of around , then it is safe to assume that the sample doesn't have any anomaly


Open source implementations[]
Original implementation:
- Isolation Forest, an algorithm that detects data-anomalies using binary trees written in R. Released by the paper's first author Liu, Fei Tony in 2009.
Other implementations (in alphabetical order):
- Isolation Forest - A Spark/Scala implementation, created by James Verbus from the LinkedIn Anti-Abuse AI team.
- Isolation Forest by H2O-3 - An implementation of Isolation Forest for Anomaly Detection by H2O-3.
- Package solitude implementation in R by Srikanth Komala Sheshachala.
- Python implementation with examples in scikit-learn.
- Spark iForest - A distributed implementation in Scala and Python, which runs on Apache Spark. Written by Yang, Fangzhou.
See also[]
References[]
- ^ a b c d e f g h Liu, Fei Tony; Ting, Kai Ming; Zhou, Zhi-Hua (December 2008). "Isolation Forest". 2008 Eighth IEEE International Conference on Data Mining: 413–422. doi:10.1109/ICDM.2008.17. ISBN 978-0-7695-3502-9. S2CID 6505449.
- ^ a b c d Chandola, Varun; Banerjee, Arindam; Kumar, Kumar (July 2009). "Anomaly Detection: A Survey". ACM Computing Surveys. 41. doi:10.1145/1541880.1541882. S2CID 207172599.
- ^ Liu, Fei Tony; Ting, Kai Ming; Zhou, Zhi-Hua (December 2008). "Isolation-based Anomaly Detection" (PDF). ACM Transactions on Knowledge Discovery from Data. 6: 1–39. doi:10.1145/2133360.2133363. S2CID 207193045.
- ^ a b Tan, Swee Chuan; Ting, Kai Ming; Liu, Fei Tony (2011). "Fast anomaly detection for streaming data". Proceedings of the Twenty-Second international joint conference on Artificial Intelligence. 2. AAAI Press. pp. 1511–1516. doi:10.5591/978-1-57735-516-8/IJCAI11-254. ISBN 9781577355144.
- ^ a b c d e Liu, Fei Tony; Ting, Kai Ming; Zhou, Zhi-Hua (September 2010). "On Detecting Clustered Anomalies Using SCiForest". Joint European Conference on Machine Learning and Knowledge Discovery in Databases - ECML PKDD 2010 : Machine Learning and Knowledge Discovery in Databases: 274–290. doi:10.1007/978-3-642-15883-4_18.
- ^ Ding, Zhiguo; Fei, Minrui (September 2013). "An Anomaly Detection Approach Based on Isolation Forest Algorithm for Streaming Data using Sliding Window". 3rd IFAC International Conference on Intelligent Control and Automation Science.
- ^ Susto, Gian Antonio; Beghi, Alessandro; McLoone, Sean (2017). "Anomaly detection through on-line isolation Forest: An application to plasma etching". 2017 28th Annual SEMI Advanced Semiconductor Manufacturing Conference (ASMC) (PDF). pp. 89–94. doi:10.1109/ASMC.2017.7969205. ISBN 978-1-5090-5448-0.
- ^ Weng, Yu; Liu, Lei (15 April 2019). "A Collective Anomaly Detection Approach for Multidimensional Streams in Mobile Service Security". IEEE Access. 7: 49157–49168. doi:10.1109/ACCESS.2019.2909750.
- ^ Hariri, Sahand; Carrasco Kind, Matias; Brunner, Robert J. (2019). "Extended Isolation Forest". IEEE Transactions on Knowledge and Data Engineering: 1. arXiv:1811.02141. doi:10.1109/TKDE.2019.2947676. S2CID 53236735.
- ^ Dilini Talagala, Priyanga; Hyndman, Rob J.; Smith-Miles, Kate (12 Aug 2019). "Anomaly Detection in High Dimensional Data". arXiv:1908.04000 [stat.ML].
- ^ Shaffer, Clifford A. (2011). Data structures & algorithm analysis in Java (3rd Dover ed.). Mineola, NY: Dover Publications. ISBN 9780486485812. OCLC 721884651.
- Unsupervised learning
- Statistical outliers