Jabonga
Jabonga | |
|---|---|
| Municipality of Jabonga | |
 Municipal Hall | |
 Seal | |
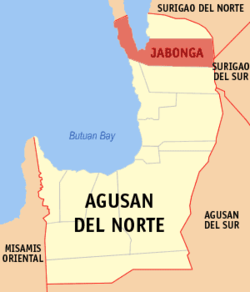 Map of Agusan del Norte with Jabonga highlighted | |
OpenStreetMap  | |
 Jabonga Location within the Philippines | |
| Coordinates: 9°20′35″N 125°30′56″E / 9.34306°N 125.51556°ECoordinates: 9°20′35″N 125°30′56″E / 9.34306°N 125.51556°E | |
| Country | Philippines |
| Region | Caraga |
| Province | Agusan del Norte |
| District | 2nd district |
| Barangays | 15 (see Barangays) |
| Government | |
| • Type | Sangguniang Bayan |
| • Mayor | Napoleon M. Montero |
| • Vice Mayor | Glicerio M. Monton Jr. |
| • Representative | Ma. Angelica Amante-Matba |
| • Municipal Council | Members |
| • Electorate | 17,138 voters (2019) |
| Area | |
| • Total | 293 km2 (113 sq mi) |
| Elevation | 114 m (374 ft) |
| Highest elevation | 627 m (2,057 ft) |
| Lowest elevation | 0 m (0 ft) |
| Population (2020 census) [3] | |
| • Total | 24,855 |
| • Density | 85/km2 (220/sq mi) |
| • Households | 5,114 |
| Economy | |
| • Income class | 3rd municipal income class |
| • Poverty incidence | 42.33% (2015)[4] |
| • Revenue | ₱138,569,303.30 (2020) |
| • Assets | ₱287,154,282.46 (2020) |
| • Expenditure | ₱116,416,094.89 (2020) |
| • Liabilities | ₱160,287,381.15 (2020) |
| Service provider | |
| • Electricity | Agusan del Norte Electric Cooperative (ANECO) |
| Time zone | UTC+8 (PST) |
| ZIP code | 8607 |
| PSGC | |
| IDD : area code | +63 (0)85 |
| Native languages | Agusan Butuanon Cebuano Higaonon Mamanwa Tagalog |
| Website | www |
Jabonga, officially the Municipality of Jabonga (Cebuano: Lungsod sa Jabonga; Tagalog: Bayan ng Jabonga), is a 3rd class municipality in the province of Agusan del Norte, Philippines. According to the 2020 census, it has a population of 24,855 people. [3]
History[]
This section does not cite any sources. (October 2016) |
Jabonga traces its origin to a village formerly occupied by Negritoes and a few Christian immigrants led by a Manobo Negrito meztizo Angelecio Montante together with Zaldy Louie, also called Agaras. The village became known as Celopan, a name derived from the bamboos growing along the bank of the river that were made into smoking pipes.
Sometime during the mid-nineteenth century, the increasing number of inhabitants who were joined by Christian immigrants from other places transferred to a new settlement in the present site of Colorado[clarification needed]. By this time, The Spanish government was already sending missionaries to all parts of the island and the group that went up the reached the settlement of Colorado, a name derived from the word Colorado meaning colored, because of the white spotted arms of Domingo Mondoy, the brave settler who dared to face the newcomers. Proceeding upstream, the missionaries reached Celopan and seeing a native inside a hut, the floor of which was just one meter above the water, they asked him what the place was called. Thinking that the Spaniards were referring to the hut, he answered Habongan. Thus, Celopan was renamed Habongan which later became Jabonga.
Geography[]
According to the Philippine Statistics Authority, the municipality has a land area of 293 square kilometres (113 sq mi) [5] constituting 10.73% of the 2,730.24-square-kilometre- (1,054.15 sq mi) total area of Agusan del Norte.
Jabonga is bounded by Kitcharao and Surigao del Norte to the north; Butuan Bay to the west; Tubay and Santiago to the south; Surigao del Sur to the east. It is 60 kilometres (37 mi) from Butuan City.
The topography of the land features plain to rolling and hills. Among the municipalities, Jabonga ranks first in total area and number of farms (464) mostly owned by individuals. It has one of the 36 crop storage facilities of the province. Its major crops are coconut, rice, corn, timber and both fresh and sea-water fish.
Climate[]
| Climate data for Jabonga, Agusan del Norte | |||||||||||||
|---|---|---|---|---|---|---|---|---|---|---|---|---|---|
| Month | Jan | Feb | Mar | Apr | May | Jun | Jul | Aug | Sep | Oct | Nov | Dec | Year |
| Average high °C (°F) | 27 (81) |
27 (81) |
28 (82) |
29 (84) |
30 (86) |
29 (84) |
29 (84) |
29 (84) |
29 (84) |
29 (84) |
28 (82) |
28 (82) |
29 (83) |
| Average low °C (°F) | 23 (73) |
23 (73) |
23 (73) |
23 (73) |
24 (75) |
25 (77) |
24 (75) |
24 (75) |
24 (75) |
24 (75) |
24 (75) |
23 (73) |
24 (74) |
| Average precipitation mm (inches) | 210 (8.3) |
161 (6.3) |
123 (4.8) |
85 (3.3) |
148 (5.8) |
186 (7.3) |
164 (6.5) |
157 (6.2) |
141 (5.6) |
190 (7.5) |
223 (8.8) |
200 (7.9) |
1,988 (78.3) |
| Average rainy days | 21.0 | 16.8 | 18.5 | 18.2 | 24.9 | 27.7 | 28.4 | 27.0 | 26.1 | 27.6 | 24.6 | 22.0 | 282.8 |
| Source: Meteoblue [6] | |||||||||||||
Barangays[]
Jabonga is politically subdivided into 15 barangays.[7]
| PSGC | Barangay | Population | ±% p.a. | |||
|---|---|---|---|---|---|---|
| 2020 [3] | 2010 [8] | |||||
| 160205003 | A. Beltran (Camalig) | 4.3% | 1,077 | 1,149 | −0.66% | |
| 160205001 | Baleguian | 9.3% | 2,301 | 2,136 | 0.77% | |
| 160205002 | Bangonay | 13.5% | 3,361 | 3,073 | 0.93% | |
| 160205004 | Bunga | 3.4% | 842 | 951 | −1.24% | |
| 160205005 | Colorado | 7.5% | 1,858 | 1,570 | 1.75% | |
| 160205006 | Cuyago | 7.8% | 1,949 | 2,015 | −0.34% | |
| 160205007 | Libas | 5.8% | 1,437 | 1,455 | −0.13% | |
| 160205008 | Magdagooc | 6.4% | 1,585 | 1,464 | 0.82% | |
| 160205009 | Magsaysay | 4.5% | 1,117 | 1,155 | −0.34% | |
| 160205010 | Maraiging | 2.1% | 526 | 507 | 0.38% | |
| 160205011 | Poblacion (Jabonga) | 16.1% | 4,004 | 3,713 | 0.78% | |
| 160205012 | San Jose | 3.7% | 921 | 977 | −0.61% | |
| 160205013 | San Pablo | 5.2% | 1,299 | 957 | 3.19% | |
| 160205014 | San Vicente | 6.5% | 1,611 | 1,747 | −0.83% | |
| 160205015 | Santo Niño | 3.9% | 967 | 964 | 0.03% | |
| Total | 24,855 | 23,833 | 0.43% | |||
Demographics[]
| Year | Pop. | ±% p.a. |
|---|---|---|
| 1903 | 1,450 | — |
| 1918 | 2,545 | +3.82% |
| 1939 | 5,004 | +3.27% |
| 1948 | 7,700 | +4.91% |
| 1960 | 14,721 | +5.55% |
| 1970 | 12,129 | −1.92% |
| 1975 | 14,742 | +3.99% |
| 1980 | 15,912 | +1.54% |
| 1990 | 18,610 | +1.58% |
| 1995 | 20,196 | +1.54% |
| 2000 | 20,501 | +0.32% |
| 2007 | 23,052 | +1.63% |
| 2010 | 23,833 | +1.22% |
| 2015 | 23,184 | −0.52% |
| 2020 | 24,855 | +1.38% |
| Source: Philippine Statistics Authority [9] [8] [10][11] | ||
In the 2020 census, Jabonga had a population of 24,855. [3] The population density was 85 inhabitants per square kilometre (220/sq mi).
Economy[]
| Poverty Incidence of Jabonga | |
| Source: Philippine Statistics Authority[12][13][14][15][16][17] | |
References[]
- ^ Municipality of Jabonga | (DILG)
- ^ "2015 Census of Population, Report No. 3 – Population, Land Area, and Population Density" (PDF). Philippine Statistics Authority. Quezon City, Philippines. August 2016. ISSN 0117-1453. Archived (PDF) from the original on May 25, 2021. Retrieved July 16, 2021.
- ^ a b c d Census of Population (2020). "Caraga". Total Population by Province, City, Municipality and Barangay. PSA. Retrieved 8 July 2021.
- ^ https://psa.gov.ph/sites/default/files/City%20and%20Municipal-level%20Small%20Area%20Poverty%20Estimates_%202009%2C%202012%20and%202015_0.xlsx; publication date: 10 July 2019; publisher: Philippine Statistics Authority.
- ^ "Province: Agusan del Norte". PSGC Interactive. Quezon City, Philippines: Philippine Statistics Authority. Retrieved 12 November 2016.
- ^ "Jabonga: Average Temperatures and Rainfall". Meteoblue. Retrieved 2 February 2020.
- ^ "Municipal: Jabonga". PSGC Interactive. Quezon City, Philippines: Philippine Statistics Authority. Retrieved 8 January 2016.
- ^ a b Census of Population and Housing (2010). "Caraga". Total Population by Province, City, Municipality and Barangay. NSO. Retrieved 29 June 2016.
- ^ Census of Population (2015). "Caraga". Total Population by Province, City, Municipality and Barangay. PSA. Retrieved 20 June 2016.
- ^ Censuses of Population (1903–2007). "Caraga". Table 1. Population Enumerated in Various Censuses by Province/Highly Urbanized City: 1903 to 2007. NSO.
- ^ "Province of Agusan del Norte". Municipality Population Data. Local Water Utilities Administration Research Division. Retrieved 17 December 2016.
- ^ "Poverty incidence (PI):". Philippine Statistics Authority. Retrieved 28 December 2020.
- ^ https://psa.gov.ph/sites/default/files/NSCB_LocalPovertyPhilippines_0.pdf; publication date: 29 November 2005; publisher: Philippine Statistics Authority.
- ^ https://psa.gov.ph/sites/default/files/2003%20SAE%20of%20poverty%20%28Full%20Report%29_1.pdf; publication date: 23 March 2009; publisher: Philippine Statistics Authority.
- ^ https://psa.gov.ph/sites/default/files/2006%20and%202009%20City%20and%20Municipal%20Level%20Poverty%20Estimates_0_1.pdf; publication date: 3 August 2012; publisher: Philippine Statistics Authority.
- ^ https://psa.gov.ph/sites/default/files/2012%20Municipal%20and%20City%20Level%20Poverty%20Estima7tes%20Publication%20%281%29.pdf; publication date: 31 May 2016; publisher: Philippine Statistics Authority.
- ^ https://psa.gov.ph/sites/default/files/City%20and%20Municipal-level%20Small%20Area%20Poverty%20Estimates_%202009%2C%202012%20and%202015_0.xlsx; publication date: 10 July 2019; publisher: Philippine Statistics Authority.
External links[]
- Jabonga Profile at PhilAtlas.com
- Philippine Standard Geographic Code
- Municipal Website Blog of Jabonga
Places adjacent to Jabonga | ||||||||||||||||
|---|---|---|---|---|---|---|---|---|---|---|---|---|---|---|---|---|
| ||||||||||||||||
Cabadbaran (capital) | |
| Municipalities | |
| Component city | |
| Highly urbanized city |
|
- Municipalities of Agusan del Norte
- Populated places on Lake Mainit