Jeanne-Mance–Viger
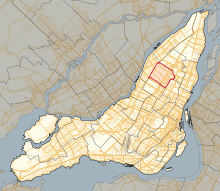 Location in Montreal | |||
| Provincial electoral district | |||
| Legislature | National Assembly of Quebec | ||
| MNA |
Liberal | ||
| District created | 2001 | ||
| First contested | 2003 | ||
| Last contested | 2018 | ||
| Demographics | |||
| Electors (2014)[1] | 48,925 | ||
| Area (km²)[2] | 13.5 | ||
| Census division(s) | Montreal (part) | ||
| Census subdivision(s) | Montreal (part) | ||
Jeanne-Mance–Viger is a provincial electoral district in the Montreal region of Quebec, Canada that elects members to the National Assembly of Quebec. It corresponds exactly to the territory of the Saint-Léonard borough of the city of Montreal.
It was created for the 2003 election from Jeanne-Mance and part of Viger.
In the change from the 2001 to the 2011 electoral map, its territory was unchanged.
It was named for Jeanne Mance and jointly for Denis-Benjamin Viger and Jacques Viger (1787–1858).[3]
Members of the National Assembly[]
| Legislature | Years | Member | Party | |
|---|---|---|---|---|
| Riding created from Jeanne-Mance and Viger | ||||
| 37th | 2003–2007 | Michel Bissonnet | Liberal | |
| 38th | 2007–2008 | |||
| 39th | 2008–2012 | Filomena Rotiroti | ||
| 40th | 2012–2014 | |||
| 41st | 2014–2018 | |||
| 42nd | 2018–Present | |||
Election results[]
| hide2018 Quebec general election | ||||||||
|---|---|---|---|---|---|---|---|---|
| Party | Candidate | Votes | % | ±% | ||||
| Liberal | Filomena Rotiroti | 18,215 | 66.32 | -12.21 | ||||
| Coalition Avenir Québec | Sarah Petrari | 4,445 | 16.18 | +7.98 | ||||
| Québec solidaire | Ismaël Seck | 2,237 | 8.15 | +4.79 | ||||
| Parti Québécois | Marie-Josée Bruneau | 1,523 | 5.55 | -3.05 | ||||
| Green | Sylvie Hétu | 570 | 2.08 | +0.98 | ||||
| Conservative | Sylvain Dallaire | 391 | 1.42 | |||||
| Marxist–Leninist | Garnet Colly | 83 | 0.3 | +0.09 | ||||
| Total valid votes | 27,464 | 98.08 | ||||||
| Total rejected ballots | 538 | 1.92 | ||||||
| Turnout | 28,002 | 55.27 | ||||||
| Eligible voters | 50,660 | |||||||
| Liberal hold | Swing | -10.095 | ||||||
show
Source(s) | ||||||||
| hide2014 Quebec general election | ||||||||
|---|---|---|---|---|---|---|---|---|
| Party | Candidate | Votes | % | ±% | ||||
| Liberal | Filomena Rotiroti | 27,007 | 78.53 | +13.14 | ||||
| Parti Québécois | Joanie Harnois | 2,956 | 8.60 | -4.83 | ||||
| Coalition Avenir Québec | Mario Parent | 2,820 | 8.20 | -6.32 | ||||
| Québec solidaire | Stéphanie Charpentier | 1,154 | 3.36 | -1.70 | ||||
| Green | Melissa Miscione | 379 | 1.10 | – | ||||
| Marxist–Leninist | Garnet Colly | 73 | 0.21 | -0.12 | ||||
| Total valid votes | 34,389 | 98.97 | – | |||||
| Total rejected ballots | 394 | 1.13 | – | |||||
| Turnout | 34,783 | 71 | +3.59 | |||||
| Electors on the lists | 48,925 | – | – | |||||
| Liberal hold | Swing | – | ||||||
| hide2012 Quebec general election | ||||||||
|---|---|---|---|---|---|---|---|---|
| Party | Candidate | Votes | % | ±% | ||||
| Liberal | Filomena Rotiroti | 20,912 | 65.39 | -7.66 | ||||
| Coalition Avenir Québec | Jean-François Gagné | 4,643 | 14.52 | +6.85 | ||||
| Parti Québécois | Nicolas Bonami | 4,295 | 13.43 | -1.59 | ||||
| Québec solidaire | Marie-Chantal Locas | 1,618 | 5.06 | +2.60 | ||||
| Option nationale | Julie Surprenant | 410 | 1.28 | – | ||||
| Marxist–Leninist | Garnet Colly | 104 | 0.33 | -0.23 | ||||
| Total valid votes | 31,982 | 98.71 | – | |||||
| Total rejected ballots | 419 | 1.29 | – | |||||
| Turnout | 32,401 | 67.41 | ||||||
| Electors on the lists | 48,069 | – | – | |||||
| Liberal hold | Swing | -7.25 | ||||||
^ Change is from redistributed results. CAQ change is from ADQ.
| Party | Candidate | Votes | % | ±% | |
|---|---|---|---|---|---|
| Liberal | Filomena Rotiroti | 16433 | 73.05 | ||
| Parti Québécois | Christine Normandin | 3379 | 15.02 | ||
| Action démocratique | Luigi Verrelli | 1726 | 7.67 | ||
| Québec solidaire | Celine Gingras | 554 | 2.46 | ||
| } | Independent | Katia Proulx | 281 | 1.25 | |
| People's Front | Garnet Colly | 124 | 0.55 | ||
| Total valid votes | 22,497 | 98.57 | |||
| Total rejected ballots | 326 | 1.43 | |||
| Turnout | 22,823 | 46.95 | |||
| Electors on the lists | 48,609 | ||||
| Party | Candidate | Votes | % | ±% | |
|---|---|---|---|---|---|
| Liberal | Michel Bissonnet | 20716 | 68.00 | -11.89 | |
| Action démocratique | Carole Giroux | 4565 | 14.98 | +8.78 | |
| Parti Québécois | Kamal El Batal | 3659 | 12.01 | -0.82 | |
| Green | Hamadou Abdel Kader Nikiema | 790 | 2.59 | – | |
| Québec solidaire | Ramon Villaruel | 635 | 2.08 | ||
| People's Front | Stéphane Chénier | 101 | 0.33 | ||
| Total valid votes | 30,466 | 98.87 | |||
| Total rejected ballots | 349 | 1.13 | |||
| Turnout | 30,815 | 63.26 | |||
| Electors on the lists | 48,710 | ||||
| Party | Candidate | Votes | % | ±% | |
|---|---|---|---|---|---|
| Liberal | Michel Bissonnet | 26801 | 79.89 | ||
| Parti Québécois | Robert La Rose | 4303 | 12.83 | ||
| Action démocratique | Carole Giroux | 2080 | 6.20 | ||
| Bloc Pot | Eddy Guarino | 365 | 1.09 | ||
References[]
- ^ http://www.electionsquebec.qc.ca/english/provincial/electoral-map/general-information-on-the-provincial-electoral-divisions-2011.php?bsq=429§ion=population
- ^ http://www.electionsquebec.qc.ca/english/provincial/electoral-map/general-information-on-the-provincial-electoral-divisions-2011.php?bsq=429§ion=superficie
- ^ "Circonscription électorale de Jeanne-Mance–Viger". Commission de toponymie du Québec (in French). September 2015. Retrieved 2016-01-06.
External links[]
- Information
- Election results
- Election results (National Assembly)
- Maps
- 2011 map (PDF)
- 2001 map (Flash)
- 2001–2011 changes (Flash)
- 1992–2001 changes to Jeanne-Mance (Flash)
- 1992–2001 changes to Viger (Flash)
- Electoral map of Montréal region
- Quebec electoral map, 2011
| show Neighbouring electoral districts |
|---|
| Authority control |
|
|---|

Categories:
- Provincial electoral districts of Montreal
- Quebec provincial electoral districts
- Saint-Leonard, Quebec