Acadie (electoral district)
Coordinates: 45°31′N 73°41′W / 45.52°N 73.68°W

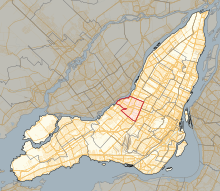 Location in Montreal | |||
| Provincial electoral district | |||
| Legislature | National Assembly of Quebec | ||
| MNA |
Liberal | ||
| District created | 1972 | ||
| First contested | 1973 | ||
| Last contested | 2018 | ||
| Demographics | |||
| Population (2011) | 76,200 | ||
| Electors (2014)[1] | 49,413 | ||
| Area (km²)[2] | 14.9 | ||
| Pop. density (per km²) | 5,114.1 | ||
| Census division(s) | Montreal (part) | ||
| Census subdivision(s) | Montreal (part) | ||
Acadie is a provincial electoral district in Quebec, Canada, that elects members to the National Assembly of Quebec. It is located in northern Montreal and consists of parts of the Saint-Laurent and Ahuntsic-Cartierville boroughs.
It was created as L'Acadie for the 1973 election from parts of Ahuntsic and Saint-Laurent electoral districts. It changed to its present name in 1989.
In the change from the 2001 to the 2011 electoral map, its territory was unchanged.
Members of the National Assembly[]
| Legislature | Years | Member | Party | |
|---|---|---|---|---|
| L'Acadie Riding created from Ahuntsic and Saint-Laurent |
||||
| 30th | 1973–1976 | François Cloutier | Liberal | |
| 31st | 1976–1981 | Thérèse Lavoie-Roux | ||
| 32nd | 1981–1985 | |||
| 33rd | 1985–1989 | |||
| Acadie | ||||
| 34th | 1989–1994 | Yvan Bordeleau | Liberal | |
| 35th | 1994–1998 | |||
| 36th | 1998–2003 | |||
| 37th | 2003–2007 | |||
| 38th | 2007–2008 | Christine St-Pierre | ||
| 39th | 2008–2012 | |||
| 40th | 2012–2014 | |||
| 41st | 2014–2018 | |||
| 42nd | 2018–Present | |||
Election results[]
| hide2018 Quebec general election | ||||||||
|---|---|---|---|---|---|---|---|---|
| Party | Candidate | Votes | % | ±% | ||||
| Liberal | Christine St-Pierre | 14,305 | 53.80 | -17.16 | ||||
| Coalition Avenir Québec | Sophie Chiasson | 4,391 | 16.51 | +7.57 | ||||
| Québec solidaire | Viviane Martinova-Croteau | 3,656 | 13.75 | +7.18 | ||||
| Parti Québécois | Farida Sam | 2,394 | 9.00 | -2.68 | ||||
| Green | Laurence Sicotte | 737 | 2.77 | +1.58 | ||||
| Conservative | Jocelyn Chouinard | 579 | 2.18 | |||||
| New Democratic | Michel Welt | 442 | 1.66 | |||||
| Marxist–Leninist | Yvon Breton | 87 | 0.33 | +0.13 | ||||
| Total valid votes | 26,591 | 98.50 | ||||||
| Total rejected ballots | 406 | 1.50 | ||||||
| Turnout | 26,997 | 54.17 | ||||||
| Eligible voters | 49,838 | |||||||
| Liberal hold | Swing | -12.37 | ||||||
show
Source(s) | ||||||||
| hide2014 Quebec general election | ||||||||
|---|---|---|---|---|---|---|---|---|
| Party | Candidate | Votes | % | ±% | ||||
| Liberal | Christine St-Pierre | 24,211 | 70.96 | +15.31 | ||||
| Parti Québécois | Évelyne Abitbol | 3,985 | 11.68 | -5.54 | ||||
| Coalition Avenir Québec | Serge Pourreaux | 3,050 | 8.94 | -8.52 | ||||
| Québec solidaire | Geneviève Dick | 2,241 | 6.57 | -1.44 | ||||
| Green | Alix Nyaburerwa | 405 | 1.19 | – | ||||
| Option nationale | Julie Boivin | 162 | 0.47 | -1.19 | ||||
| Marxist–Leninist | Yvon Breton | 67 | 0.20 | – | ||||
| Total valid votes | 34,121 | 99.08 | – | |||||
| Total rejected ballots | 318 | 0.92 | – | |||||
| Turnout | 34,459 | 69.70 | +4.94 | |||||
| Electors | 49,413 | – | – | |||||
| Liberal hold | Swing | +10.43 | ||||||
| hide2012 Quebec general election | ||||||||
|---|---|---|---|---|---|---|---|---|
| Party | Candidate | Votes | % | ±% | ||||
| Liberal | Christine St-Pierre | 17,191 | 55.65 | -11.51 | ||||
| Coalition Avenir Québec | Abel-Claude Aslanian | 5,393 | 17.46 | +13.11* | ||||
| Parti Québécois | Rachid Bandou | 5,319 | 17.22 | -3.70 | ||||
| Québec solidaire | Marianne Breton Fontaine | 2,474 | 8.01 | +3.76 | ||||
| Option nationale | Sebastien Croteau | 512 | 1.66 | – | ||||
| Total valid votes | 30,889 | 98.67 | – | |||||
| Total rejected ballots | 416 | 1.33 | – | |||||
| Turnout | 31,305 | 64.76 | +17.85 | |||||
| Electors | 48,339 | – | – | |||||
* Result compared to Action démocratique
| hide2008 Quebec general election | ||||||||
|---|---|---|---|---|---|---|---|---|
| Party | Candidate | Votes | % | ±% | ||||
| Liberal | Christine St-Pierre | 15,145 | 67.16 | +7.07 | ||||
| Parti Québécois | Marc-André Nolet | 4,718 | 20.92 | +4.29 | ||||
| Action démocratique | Ahamed Badawy | 982 | 4.35 | -10.12 | ||||
| Québec solidaire | André Parizeau | 958 | 4.25 | +0.45 | ||||
| Green | Nicolas Rémillard-Tessier | 747 | 3.31 | -1.71 | ||||
| Total valid votes | 22,550 | 98.67 | – | |||||
| Total rejected ballots | 304 | 1.33 | – | |||||
| Turnout | 22,854 | 46.91 | -15.12 | |||||
| Electors | 48,719 | – | – | |||||
| hide2007 Quebec general election: Acadie | ||||||||
|---|---|---|---|---|---|---|---|---|
| Party | Candidate | Votes | % | ±% | ||||
| Liberal | Christine St-Pierre | 17,962 | 60.09 | −10.30 | ||||
| Parti Québécois | Frédéric Lapointe | 4,970 | 16.63 | −3.70 | ||||
| Action démocratique | Charles Ghorayeb | 4,327 | 14.47 | +7.64 | ||||
| Green | Nicolas Rémillard-Tessier | 1,500 | 5.02 | – | ||||
| Québec solidaire | André Parizeau | 1,135 | 3.80 | +3.31 | ||||
| Total valid votes | 29,894 | 98.93 | – | |||||
| Total rejected ballots | 322 | 1.07 | – | |||||
| Turnout | 30,216 | 62.03 | −3.63 | |||||
| Electors | 48,712 | – | – | |||||
| Liberal hold | Swing | -3.30 | ||||||
| Source: Official Results, Le Directeur général des élections du Québec. | ||||||||
| hide2003 Quebec general election | ||||||||
|---|---|---|---|---|---|---|---|---|
| Party | Candidate | Votes | % | ±% | ||||
| Liberal | Yvan Bordeleau | 23,211 | 70.39 | −4.80 | ||||
| Parti Québécois | Maria Mourani | 6,702 | 20.33 | +1.22 | ||||
| Action démocratique | Jean-Pierre Chamoun | 2,253 | 6.83 | +2.18 | ||||
| Bloc Pot | Jonathan Bérubé | 440 | 1.33 | – | ||||
| Independent | André Parizeau | 161 | 0.49 | – | ||||
| Marxist–Leninist | Linda Sullivan | 111 | 0.34 | – | ||||
| Equality | Marina Paümann | 95 | 0.29 | – | ||||
| Total valid votes | 32,973 | 99.05 | – | |||||
| Total rejected ballots | 316 | 0.95 | – | |||||
| Turnout | 33,289 | 65.66 | −12.39 | |||||
| Electors on the lists | 50,699 | – | – | |||||
| hide1985 Quebec general election | ||||||||
|---|---|---|---|---|---|---|---|---|
| Party | Candidate | Votes | % | ±% | ||||
| Liberal | Thérèse Lavoie-Roux | 22,572 | 74.04 | +5.87 | ||||
| Parti Québécois | Jean Cermakian | 6,617 | 21.70 | -8.68 | ||||
| New Democratic | Charles Suissa | 946 | 3.10 | – | ||||
| Christian Socialist | André Lambert | 190 | 0.62 | – | ||||
| Commonwealth of Canada | Louis Beauchemin | 165 | 0.54 | – | ||||
| Total valid votes | 30,489 | 98.16 | – | |||||
| Total rejected ballots | 572 | 1.84 | – | |||||
| Turnout | 31,061 | 75.38 | -8.54 | |||||
| Eligible voters | 41,206 | – | – | |||||
| Liberal hold | Swing | +7.28 | ||||||
| Source: Official Results, Élections Québec. | ||||||||
| hide1981 Quebec general election | ||||||||
|---|---|---|---|---|---|---|---|---|
| Party | Candidate | Votes | % | ±% | ||||
| Liberal | Thérèse Lavoie-Roux | 22,784 | 68.17 | +22.67 | ||||
| Parti Québécois | Jean-Paul Martel | 10,154 | 30.38 | -0.89 | ||||
| Union Nationale | Robert Turcotte | 369 | 1.10 | -19.69 | ||||
| Independent | Jean-Michel Durocher | 118 | 0.35 | – | ||||
| Total valid votes | 33,425 | 99.05 | – | |||||
| Total rejected ballots | 322 | 0.95 | – | |||||
| Turnout | 33,747 | 83.92 | -2.16 | |||||
| Eligible voters | 40,214 | – | – | |||||
| Liberal hold | Swing | +11.78 | ||||||
| Source: Official Results, Élections Québec. | ||||||||
References[]
- ^ http://www.electionsquebec.qc.ca/english/provincial/electoral-map/general-information-on-the-provincial-electoral-divisions-2011.php?bsq=437§ion=population
- ^ http://www.electionsquebec.qc.ca/english/provincial/electoral-map/general-information-on-the-provincial-electoral-divisions-2011.php?bsq=437§ion=superficie
External links[]
- Information
- Election results
- Election results as "Acadie" (National Assembly)
- Election results as "L'Acadie" (National Assembly)
- Election results (QuébecPolitique)
- Maps
- 2011 map (PDF)
- 2001 map (Flash)
- 2001–2011 changes[permanent dead link] (Flash)
- 1992–2001 changes (Flash)
- Electoral map of Montréal region
- Quebec electoral map, 2011
| show Neighbouring electoral districts |
|---|
| Authority control |
|
|---|
This Montreal-related article is a stub. You can help Wikipedia by . |
Categories:
- Provincial electoral districts of Montreal
- Quebec provincial electoral districts
- Saint-Laurent, Quebec
- Ahuntsic-Cartierville
- Montreal stubs