Hochelaga-Maisonneuve (electoral district)
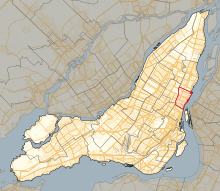 Location in Montreal | |||
| Provincial electoral district | |||
| Legislature | National Assembly of Quebec | ||
| MNA |
Québec solidaire | ||
| District created | 1988 | ||
| First contested | 1989 | ||
| Last contested | 2018 | ||
| Demographics | |||
| Population (2006) | 55,168 | ||
| Electors (2014)[1] | 41,405 | ||
| Area (km²)[2] | 9.9 | ||
| Pop. density (per km²) | 5,572.5 | ||
| Census division(s) | Montreal | ||
| Census subdivision(s) | Montreal | ||
Hochelaga-Maisonneuve is a provincial electoral district in Quebec, Canada, that elects members to the National Assembly of Quebec. The district is located within Montreal, and its territory mostly covers the borough of Mercier–Hochelaga-Maisonneuve, and also parts of Rosemont–La Petite-Patrie, Ville-Marie and Le Plateau-Mont-Royal boroughs. It is bordered to the east by the Canadian National Railway yard, to the south by the Saint Lawrence River, to the north by Rachel and Sherbrooke Streets and to the west by Frontenac Street.
It was created for the 1989 election from parts of Maisonneuve and Sainte-Marie electoral districts.
In the change from the 2001 to the 2011 electoral map, its territory was unchanged.
Members of the National Assembly[]
| Legislature | Years | Member | Party | |
|---|---|---|---|---|
| Riding created from Maisonneuve and Sainte-Marie | ||||
| 34th | 1989–1994 | Louise Harel | Parti Québécois | |
| 35th | 1994–1998 | |||
| 36th | 1998–2003 | |||
| 37th | 2003–2007 | |||
| 38th | 2007–2008 | |||
| 39th | 2008–2012 | Carole Poirier | ||
| 40th | 2012–2014 | |||
| 41st | 2014–2018 | |||
| 42nd | 2018–Present | Alexandre Leduc | Québec solidaire | |
Election results[]
| hide2018 Quebec general election | ||||||||
|---|---|---|---|---|---|---|---|---|
| Party | Candidate | Votes | % | ±% | ||||
| Québec solidaire | Alexandre Leduc | 13,389 | 50.05 | +18.26 | ||||
| Parti Québécois | Carole Poirier | 6,310 | 23.59 | -11.27 | ||||
| Coalition Avenir Québec | Sarah Beaumier | 3,447 | 12.89 | +0.94 | ||||
| Liberal | Julien Provencher-Proulx | 2,766 | 10.34 | -7.69 | ||||
| New Democratic | Eric-Abel Baland | 337 | 1.26 | |||||
| Bloc Pot | Etienne Mallette | 170 | 0.64 | -0.06 | ||||
| Conservative | Mathieu Beaudoin | 164 | 0.61 | |||||
| Citoyens au pouvoir | Gabriel Boily | 117 | 0.44 | |||||
| Marxist–Leninist | Christine Dandenault | 52 | 0.19 | -0.05 | ||||
| Total valid votes | 26,752 | 98.28 | ||||||
| Total rejected ballots | 467 | 1.72 | ||||||
| Turnout | 27,219 | 63.40 | ||||||
| Eligible voters | 42,934 | |||||||
| Québec solidaire gain from Parti Québécois | Swing | +14.77 | ||||||
show
Source(s) | ||||||||
| hide2014 Quebec general election | ||||||||
|---|---|---|---|---|---|---|---|---|
| Party | Candidate | Votes | % | ±% | ||||
| Parti Québécois | Carole Poirier | 9,038 | 34.86 | -10.24 | ||||
| Québec solidaire | Alexandre Leduc | 7,926 | 30.57 | +6.88 | ||||
| Liberal | David Provencher | 4,675 | 18.03 | +6.50 | ||||
| Coalition Avenir Québec | Brendan Walsh | 3,097 | 11.95 | -0.65 | ||||
| Green | Malcolm Lewis-Richmond | 352 | 1.36 | -0.24 | ||||
| Option nationale | Simon Marchand | 316 | 1.22 | -2.73 | ||||
| Parti nul | Justin Canning | 278 | 1.07 | +0.50 | ||||
| Bloc Pot | Étienne Mallette | 182 | 0.7 | – | ||||
| Marxist–Leninist | Christine Dandenault | 61 | 0.24 | -0.06 | ||||
| Total valid votes | 25,925 | 98.31 | – | |||||
| Total rejected ballots | 447 | 1.69 | – | |||||
| Turnout | 26,372 | 63.69 | -6.39 | |||||
| Electors on the lists | 41,405 | – | – | |||||
| Parti Québécois hold | Swing | -8.56 | ||||||
| hide2012 Quebec general election | ||||||||
|---|---|---|---|---|---|---|---|---|
| Party | Candidate | Votes | % | ±% | ||||
| Parti Québécois | Carole Poirier | 12,754 | 45.10 | -9.21 | ||||
| Québec solidaire | Alexandre Leduc | 6,701 | 23.69 | +10.76 | ||||
| Coalition Avenir Québec | David Monette | 3,564 | 12.60 | +5.88* | ||||
| Liberal | Alexandre Farley | 3,262 | 11.53 | -9.69 | ||||
| Option nationale | André Lamy | 1,116 | 3.95 | – | ||||
| Green | Nicholas Kulak | 453 | 1.60 | -2.61 | ||||
| Parti nul | Denis Poulin | 162 | 0.57 | – | ||||
| Coalition pour la constituante | Jean-François Jetté | 145 | 0.51 | – | ||||
| Marxist–Leninist | Christine Dandenault | 84 | 0.30 | -0.30 | ||||
| Parti indépendantiste | Serge Provost | 40 | 0.14 | – | ||||
| Total valid votes | 28,281 | 98.66 | – | |||||
| Total rejected ballots | 385 | 1.34 | – | |||||
| Turnout | 28,666 | 70.08 | +22.26 | |||||
| Electors on the lists | 40,907 | – | – | |||||
* Result compared to Action démocratique
| hide2008 Quebec general election | ||||||||
|---|---|---|---|---|---|---|---|---|
| Party | Candidate | Votes | % | ±% | ||||
| Parti Québécois | Carole Poirier | 10,530 | 54.31 | +1.60 | ||||
| Liberal | Julie Tremblay | 4,115 | 21.22 | +7.66 | ||||
| Québec solidaire | Serge Mongeau | 2,508 | 12.93 | +3.26 | ||||
| Action démocratique | Jean-Levy Champagne | 1,303 | 6.72 | −8.82 | ||||
| Green | Sylvie Woods | 817 | 4.21 | −2.88 | ||||
| Marxist–Leninist | Christine Dandenault | 117 | 0.60 | +0.34 | ||||
| Total valid votes | 19,390 | 98.39 | ||||||
| Total rejected ballots | 317 | 1.61 | ||||||
| Turnout | 19,707 | 47.82 | −14.36 | |||||
| Electors on the lists | 41,210 | |||||||
| Source: Official Results, Le Directeur général des élections du Québec. | ||||||||
| hide2007 Quebec general election | ||||||||
|---|---|---|---|---|---|---|---|---|
| Party | Candidate | Votes | % | ±% | ||||
| Parti Québécois | Louise Harel | 13,012 | 52.71 | −3.06 | ||||
| Action démocratique | Marie-Chantal Pelletier | 3,836 | 15.54 | +5.14 | ||||
| Liberal | Vahid Vidah-Fortin | 3,347 | 13.56 | −12.80 | ||||
| Québec solidaire | Gabriel Chevrefils | 2,388 | 9.67 | +6.33 | ||||
| Green | Geneviève Guérin | 1,749 | 7.09 | +5.53 | ||||
| Bloc Pot | Starbuck Leroidurock | 193 | 0.78 | −1.24 | ||||
| Independent | Daniel Laforest | 97 | 0.39 | |||||
| Marxist–Leninist | Christine Dandenault | 63 | 0.26 | −0.08 | ||||
| Total valid votes | 24,685 | 98.58 | ||||||
| Total rejected ballots | 355 | 1.42 | ||||||
| Turnout | 25,040 | 62.18 | +2.09 | |||||
| Electors on the lists | 40,272 | |||||||
| Source: Official Results, Le Directeur général des élections du Québec. | ||||||||
| hide2003 Quebec general election | ||||||||
|---|---|---|---|---|---|---|---|---|
| Party | Candidate | Votes | % | ±% | ||||
| Parti Québécois | Louise Harel | 13,138 | 55.77 | −4.84 | ||||
| Liberal | Richer Dompierre | 6,210 | 26.36 | +0.83 | ||||
| Action démocratique | Louise Blackburn | 2,449 | 10.40 | −1.11 | ||||
| UFP | Lise Alarie | 788 | 3.34 | – | ||||
| Bloc Pot | Alex Néron | 476 | 2.02 | – | ||||
| Green | Daniel Breton | 367 | 1.56 | – | ||||
| Marxist–Leninist | Christine Dandenault | 79 | 0.34 | −0.28 | ||||
| Christian Democracy | Mario Richard | 52 | 0.22 | – | ||||
| Total valid votes | 23,559 | 98.40 | – | |||||
| Total rejected ballots | 383 | 1.60 | – | |||||
| Turnout | 23,942 | 60.09 | −7.92 | |||||
| Electors on the lists | 39,843 | – | – | |||||
| Source: Official Results, Le Directeur général des élections du Québec. | ||||||||
| hide1998 Quebec general election | ||||||||
|---|---|---|---|---|---|---|---|---|
| Party | Candidate | Votes | % | ±% | ||||
| Parti Québécois | Louise Harel | 12,922 | 60.61 | −4.17 | ||||
| Liberal | Andrée Trudel | 5,444 | 25.53 | −0.80 | ||||
| Action démocratique | Jean-Louis Lalonde | 2,454 | 11.51 | +6.06 | ||||
| Socialist Democracy | Félix Lapan | 292 | 1.37 | −0.34 | ||||
| Marxist–Leninist | Christine Dandenault | 133 | 0.62 | +0.26 | ||||
| Communist | Robert Aubin | 75 | 0.35 | – | ||||
| Total valid votes | 21,320 | 98.41 | – | |||||
| Total rejected ballots | 345 | 1.59 | – | |||||
| Turnout | 21,665 | 68.01 | −7.53 | |||||
| Electors on the lists | 31,855 | – | – | |||||
| Source: Official Results, Le Directeur général des élections du Québec. | ||||||||
| 1995 Quebec referendum | |||
|---|---|---|---|
| Side | Votes | % | |
| Oui | 18,522 | 65.49 | |
| Non | 9,759 | 34.51 | |
| hide1994 Quebec general election | ||||||||
|---|---|---|---|---|---|---|---|---|
| Party | Candidate | Votes | % | ±% | ||||
| Parti Québécois | Louise Harel | 14,858 | 64.78 | +1.28 | ||||
| Liberal | Eric Taillefer | 6,039 | 26.33 | −2.98 | ||||
| Action démocratique | Michèle Piché | 1,249 | 5.45 | – | ||||
| New Democratic | Hugues Tremblay | 392 | 1.71 | +0.30 | ||||
| Natural Law | Richard Lauzon | 190 | 0.83 | – | ||||
| Marc Boyer | 127 | 0.55 | – | |||||
| Marxist–Leninist | Christine Dandenault | 82 | 0.36 | +0.10 | ||||
| Total valid votes | 22,937 | 97.68 | – | |||||
| Total rejected ballots | 545 | 2.32 | – | |||||
| Turnout | 23,482 | 75.54 | +6.83 | |||||
| Electors on the lists | 31,087 | – | – | |||||
| Source: Official Results, Le Directeur général des élections du Québec. | ||||||||
| 1992 Charlottetown Accord referendum | |||
|---|---|---|---|
| Side | Votes | % | |
| Non | 17,484 | 71.10 | |
| Oui | 7,107 | 28.90 | |
| hide1989 Quebec general election: Hochelaga-Maisonneuve | ||||||||
|---|---|---|---|---|---|---|---|---|
| Party | Candidate | Votes | % | |||||
| Parti Québécois | Louise Harel | 14,639 | 63.50 | |||||
| Liberal | 6,749 | 29.28 | ||||||
| Green | Jean-Pierre Bonenfant | 685 | 2.97 | |||||
| New Democratic | 326 | 1.41 | ||||||
| Workers | 144 | 0.62 | ||||||
| Progressive Conservative | 141 | 0.61 | ||||||
| Parti indépendantiste | 138 | 0.60 | ||||||
| Independent | 114 | 0.49 | ||||||
| Marxist–Leninist | Christiane Robidoux | 60 | 0.26 | |||||
| Commonwealth of Canada | 56 | 0.24 | ||||||
| Total valid votes | 23,052 | |||||||
| Rejected and declined votes | 548 | |||||||
| Turnout | 23,600 | 68.71 | ||||||
| Electors on the lists | 34,349 | |||||||
References[]
- ^ http://www.electionsquebec.qc.ca/english/provincial/electoral-map/general-information-on-the-provincial-electoral-divisions-2011.php?bsq=387§ion=population
- ^ http://www.electionsquebec.qc.ca/english/provincial/electoral-map/general-information-on-the-provincial-electoral-divisions-2011.php?bsq=387§ion=superficie
External links[]
- Information
- Election results
- Election results (National Assembly)
- Election results (QuébecPolitique)
- Maps
- 2011 map (PDF)
- 2001 map (Flash)
- 2001–2011 changes (Flash)
- 1992–2001 changes (Flash)
- Electoral map of Montréal region
- Quebec electoral map, 2011
| show Neighbouring electoral districts |
|---|
| Authority control |
|
|---|

- Provincial electoral districts of Montreal
- Quebec provincial electoral districts
- Mercier–Hochelaga-Maisonneuve
- Rosemont–La Petite-Patrie
- Centre-Sud
- Le Plateau-Mont-Royal