Lazi, Siquijor
Lazi | |
|---|---|
| Municipality of Lazi | |
 Lazi municipal hall | |
 Seal | |
 Map of Siquijor with Lazi highlighted | |
OpenStreetMap  | |
 Lazi Location within the Philippines | |
| Coordinates: 9°07′41″N 123°38′02″E / 9.128°N 123.634°ECoordinates: 9°07′41″N 123°38′02″E / 9.128°N 123.634°E | |
| Country | Philippines |
| Region | Central Visayas |
| Province | Siquijor |
| District | Lone district |
| Founded | 1857 |
| Barangays | 18 (see Barangays) |
| Government | |
| • Type | Sangguniang Bayan |
| • Mayor | James D. Monte |
| • Vice Mayor | Earl A. Aljas |
| • Representative | Jake Vincent S. Villa |
| • Municipal Council | Members |
| • Electorate | 15,827 voters (2019) |
| Area | |
| • Total | 70.64 km2 (27.27 sq mi) |
| Elevation | 28 m (92 ft) |
| Highest elevation | 599 m (1,965 ft) |
| Lowest elevation | 0 m (0 ft) |
| Population (2020 census) [3] | |
| • Total | 22,488 |
| • Density | 320/km2 (820/sq mi) |
| • Households | 5,001 |
| Economy | |
| • Income class | 4th municipal income class |
| • Poverty incidence | 35.77% (2015)[4] |
| • Revenue | ₱142,831,011.66 (2020) |
| • Assets | ₱287,836,399.63 (2020) |
| • Expenditure | ₱109,024,604.07 (2020) |
| • Liabilities | ₱51,519,556.89 (2020) |
| Service provider | |
| • Electricity | Province of Siquijor Electric Cooperative (PROSIELCO) |
| Time zone | UTC+8 (PST) |
| ZIP code | 6228 |
| PSGC | |
| IDD : area code | +63 (0)35 |
| Native languages | Cebuano Tagalog |

Lazi, officially the Municipality of Lazi (Cebuano: Lungsod sa Lazi; Tagalog: Bayan ng Lazi), is a 4th class municipality in the province of Siquijor, Philippines. According to the 2020 census, it has a population of 22,488 people. [3]
Lazi Church is currently in the tentative list for UNESCO World Heritage Sites under the Baroque Churches of the Philippines (Extension). A proposal has been suggested by scholars to make a separate UNESCO inclusion for "Old Centre of Lazi which includes the Lazi Church".
Barangays[]
Lazi comprises 18 barangays:
| PSGC | Barangay | Population | ±% p.a. | |||
|---|---|---|---|---|---|---|
| 2020 [3] | 2010 [5] | |||||
| 076103001 | Campalanas | 8.8% | 1,979 | 1,873 | 0.52% | |
| 076103002 | Cangclaran | 2.4% | 539 | 533 | 0.11% | |
| 076103003 | Cangomantong | 4.8% | 1,088 | 924 | 1.55% | |
| 076103004 | Capalasanan | 5.1% | 1,145 | 1,214 | −0.55% | |
| 076103005 | Catamboan (Poblacion) | 7.3% | 1,633 | 1,617 | 0.09% | |
| 076103006 | Gabayan | 8.8% | 1,970 | 1,934 | 0.17% | |
| 076103007 | Kimba | 3.2% | 725 | 657 | 0.93% | |
| 076103008 | Kinamandagan | 4.4% | 992 | 922 | 0.69% | |
| 076103009 | Lower Cabangcalan | 4.2% | 952 | 866 | 0.89% | |
| 076103010 | Nagerong | 6.0% | 1,346 | 1,313 | 0.23% | |
| 076103011 | Po‑o | 3.1% | 704 | 711 | −0.09% | |
| 076103012 | Simacolong | 7.9% | 1,777 | 1,801 | −0.13% | |
| 076103013 | Tagmanocan | 4.1% | 927 | 853 | 0.78% | |
| 076103014 | Talayong | 2.8% | 634 | 608 | 0.39% | |
| 076103015 | Tigbawan (Poblacion) | 7.1% | 1,605 | 1,696 | −0.52% | |
| 076103016 | Tignao | 4.1% | 914 | 887 | 0.28% | |
| 076103017 | Upper Cabangcalan | 2.8% | 631 | 658 | −0.39% | |
| 076103018 | Ytaya | 4.1% | 929 | 957 | −0.28% | |
| Total | 22,488 | 20,024 | 1.10% | |||
Climate[]
| Climate data for Lazi, Siquijor | |||||||||||||
|---|---|---|---|---|---|---|---|---|---|---|---|---|---|
| Month | Jan | Feb | Mar | Apr | May | Jun | Jul | Aug | Sep | Oct | Nov | Dec | Year |
| Average high °C (°F) | 29 (84) |
30 (86) |
31 (88) |
32 (90) |
31 (88) |
30 (86) |
30 (86) |
30 (86) |
30 (86) |
29 (84) |
29 (84) |
29 (84) |
30 (86) |
| Average low °C (°F) | 22 (72) |
22 (72) |
22 (72) |
23 (73) |
24 (75) |
24 (75) |
24 (75) |
24 (75) |
24 (75) |
24 (75) |
23 (73) |
23 (73) |
23 (74) |
| Average precipitation mm (inches) | 26 (1.0) |
22 (0.9) |
28 (1.1) |
41 (1.6) |
95 (3.7) |
136 (5.4) |
147 (5.8) |
126 (5.0) |
132 (5.2) |
150 (5.9) |
98 (3.9) |
46 (1.8) |
1,047 (41.3) |
| Average rainy days | 7.5 | 6.7 | 8.9 | 10.4 | 21.6 | 25.6 | 26.3 | 25.0 | 24.1 | 26.2 | 19.2 | 12.1 | 213.6 |
| Source: Meteoblue [6] | |||||||||||||
Demographics[]
| Year | Pop. | ±% p.a. |
|---|---|---|
| 1903 | 9,658 | — |
| 1918 | 13,161 | +2.08% |
| 1939 | 15,157 | +0.67% |
| 1948 | 13,840 | −1.00% |
| 1960 | 13,288 | −0.34% |
| 1970 | 14,875 | +1.13% |
| 1975 | 16,049 | +1.54% |
| 1980 | 16,149 | +0.12% |
| 1990 | 16,672 | +0.32% |
| 1995 | 16,339 | −0.38% |
| 2000 | 18,314 | +2.48% |
| 2007 | 19,440 | +0.83% |
| 2010 | 20,024 | +1.08% |
| 2015 | 20,490 | +0.44% |
| 2020 | 22,488 | +1.85% |
| Source: Philippine Statistics Authority [7] [5] [8][9] | ||
Economy[]
| Poverty Incidence of Lazi | |
| Source: Philippine Statistics Authority[10][11][12][13][14][15] | |
Gallery[]

San Isidro Labrador Convent
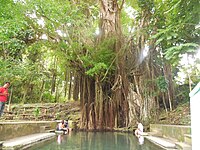
The century-old Enchanted Balete Tree
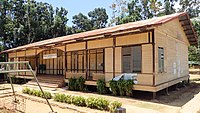
The wooden Gabaldon school

Cambugahay Falls


References[]
- ^ Municipality of Lazi | (DILG)
- ^ "2015 Census of Population, Report No. 3 – Population, Land Area, and Population Density" (PDF). Philippine Statistics Authority. Quezon City, Philippines. August 2016. ISSN 0117-1453. Archived (PDF) from the original on May 25, 2021. Retrieved July 16, 2021.
- ^ a b c Census of Population (2020). "Region VII (Central Visayas)". Total Population by Province, City, Municipality and Barangay. PSA. Retrieved 8 July 2021.
- ^ https://psa.gov.ph/sites/default/files/City%20and%20Municipal-level%20Small%20Area%20Poverty%20Estimates_%202009%2C%202012%20and%202015_0.xlsx; publication date: 10 July 2019; publisher: Philippine Statistics Authority.
- ^ a b Census of Population and Housing (2010). "Region VII (Central Visayas)". Total Population by Province, City, Municipality and Barangay. NSO. Retrieved 29 June 2016.
- ^ "Lazi: Average Temperatures and Rainfall". Meteoblue. Retrieved 28 April 2020.
- ^ Census of Population (2015). "Region VII (Central Visayas)". Total Population by Province, City, Municipality and Barangay. PSA. Retrieved 20 June 2016.
- ^ Censuses of Population (1903–2007). "Region VII (Central Visayas)". Table 1. Population Enumerated in Various Censuses by Province/Highly Urbanized City: 1903 to 2007. NSO.
- ^ "Province of Siquijor". Municipality Population Data. Local Water Utilities Administration Research Division. Retrieved 17 December 2016.
- ^ "Poverty incidence (PI):". Philippine Statistics Authority. Retrieved 28 December 2020.
- ^ https://psa.gov.ph/sites/default/files/NSCB_LocalPovertyPhilippines_0.pdf; publication date: 29 November 2005; publisher: Philippine Statistics Authority.
- ^ https://psa.gov.ph/sites/default/files/2003%20SAE%20of%20poverty%20%28Full%20Report%29_1.pdf; publication date: 23 March 2009; publisher: Philippine Statistics Authority.
- ^ https://psa.gov.ph/sites/default/files/2006%20and%202009%20City%20and%20Municipal%20Level%20Poverty%20Estimates_0_1.pdf; publication date: 3 August 2012; publisher: Philippine Statistics Authority.
- ^ https://psa.gov.ph/sites/default/files/2012%20Municipal%20and%20City%20Level%20Poverty%20Estima7tes%20Publication%20%281%29.pdf; publication date: 31 May 2016; publisher: Philippine Statistics Authority.
- ^ https://psa.gov.ph/sites/default/files/City%20and%20Municipal-level%20Small%20Area%20Poverty%20Estimates_%202009%2C%202012%20and%202015_0.xlsx; publication date: 10 July 2019; publisher: Philippine Statistics Authority.
External links[]
 Media related to Lazi at Wikimedia Commons
- Lazi Profile at PhilAtlas.com
- Philippine Standard Geographic Code
Siquijor (capital) | |
| Municipalities | |
This article about a location in Central Visayas region of the Philippines is a stub. You can help Wikipedia by . |
- Municipalities of Siquijor
- Central Visayas geography stubs