Maria, Siquijor
Maria | |
|---|---|
| Municipality of Maria | |
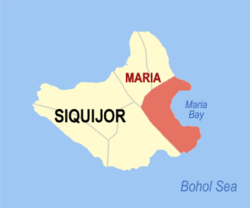 Map of Siquijor with Maria highlighted | |
OpenStreetMap  | |
 Maria Location within the Philippines | |
| Coordinates: 9°11′46″N 123°39′18″E / 9.196°N 123.655°ECoordinates: 9°11′46″N 123°39′18″E / 9.196°N 123.655°E | |
| Country | Philippines |
| Region | Central Visayas |
| Province | Siquijor |
| District | Lone district |
| Barangays | 22 (see Barangays) |
| Government | |
| • Type | Sangguniang Bayan |
| • Mayor | Meynard R. Asok |
| • Vice Mayor | Ivy Dan M. Samson |
| • Representative | Jake Vincent S. Villa |
| • Municipal Council | Members |
| • Electorate | 11,157 voters (2019) |
| Area | |
| • Total | 53.37 km2 (20.61 sq mi) |
| Elevation | 23.8 m (78.1 ft) |
| Highest elevation | 448 m (1,470 ft) |
| Lowest elevation | 0 m (0 ft) |
| Population (2020 census) [4] | |
| • Total | 14,385 |
| • Density | 270/km2 (700/sq mi) |
| • Households | 3,152 |
| Economy | |
| • Income class | 5th municipal income class |
| • Poverty incidence | 37.66% (2015)[5] |
| • Revenue | ₱80,141,382.31 (2020) |
| • Assets | ₱100,208,065.18 (2020) |
| • Expenditure | ₱70,486,718.90 (2020) |
| • Liabilities | ₱37,561,072.62 (2020) |
| Service provider | |
| • Electricity | Province of Siquijor Electric Cooperative (PROSIELCO) |
| Time zone | UTC+8 (PST) |
| ZIP code | 6229 |
| PSGC | |
| IDD : area code | +63 (0)35 |
| Native languages | Cebuano Tagalog |

Maria, officially the Municipality of Maria (Cebuano: Lungsod sa Maria; Tagalog: Bayan ng Maria), is a 5th class municipality in the province of Siquijor, Philippines. According to the 2020 census, it has a population of 14,385. [4]
Barangays[]
Maria comprises 22 barangays:
| PSGC | Barangay | Population | ±% p.a. | |||
|---|---|---|---|---|---|---|
| 2020 [4] | 2010 [6] | |||||
| 076104001 | Bogo | 5.9% | 842 | 739 | 1.23% | |
| 076104002 | Bonga | 3.5% | 506 | 459 | 0.92% | |
| 076104003 | Cabal‑asan | 2.7% | 387 | 357 | 0.76% | |
| 076104004 | Calunasan | 4.4% | 634 | 641 | −0.10% | |
| 076104005 | Candaping A | 3.9% | 562 | 448 | 2.15% | |
| 076104006 | Candaping B | 4.3% | 622 | 591 | 0.48% | |
| 076104007 | Cantaroc A | 3.1% | 448 | 385 | 1.43% | |
| 076104008 | Cantaroc B | 3.4% | 484 | 411 | 1.55% | |
| 076104009 | Cantugbas | 2.7% | 386 | 400 | −0.33% | |
| 076104010 | Lico‑an | 3.4% | 494 | 529 | −0.64% | |
| 076104011 | Lilo‑an | 9.8% | 1,414 | 1,470 | −0.36% | |
| 076104013 | Logucan | 4.3% | 615 | 557 | 0.93% | |
| 076104012 | Looc | 3.2% | 466 | 528 | −1.17% | |
| 076104014 | Minalulan | 5.5% | 797 | 703 | 1.19% | |
| 076104015 | Nabutay | 6.4% | 922 | 718 | 2.38% | |
| 076104016 | Olang | 4.6% | 659 | 592 | 1.01% | |
| 076104017 | Pisong A | 2.3% | 329 | 292 | 1.13% | |
| 076104018 | Pisong B | 1.9% | 274 | 293 | −0.63% | |
| 076104019 | Poblacion Norte | 7.6% | 1,089 | 1,170 | −0.67% | |
| 076104020 | Poblacion Sur | 5.0% | 716 | 675 | 0.56% | |
| 076104021 | Saguing | 5.5% | 797 | 946 | −1.60% | |
| 076104022 | Sawang | 2.7% | 385 | 479 | −2.03% | |
| Total | 14,385 | 13,383 | 0.68% | |||
Climate[]
| Climate data for Maria, Siquijor | |||||||||||||
|---|---|---|---|---|---|---|---|---|---|---|---|---|---|
| Month | Jan | Feb | Mar | Apr | May | Jun | Jul | Aug | Sep | Oct | Nov | Dec | Year |
| Average high °C (°F) | 29 (84) |
30 (86) |
31 (88) |
32 (90) |
31 (88) |
30 (86) |
30 (86) |
30 (86) |
30 (86) |
29 (84) |
29 (84) |
29 (84) |
30 (86) |
| Average low °C (°F) | 22 (72) |
22 (72) |
22 (72) |
23 (73) |
24 (75) |
24 (75) |
24 (75) |
24 (75) |
24 (75) |
24 (75) |
23 (73) |
23 (73) |
23 (74) |
| Average precipitation mm (inches) | 26 (1.0) |
22 (0.9) |
28 (1.1) |
41 (1.6) |
95 (3.7) |
136 (5.4) |
147 (5.8) |
126 (5.0) |
132 (5.2) |
150 (5.9) |
98 (3.9) |
46 (1.8) |
1,047 (41.3) |
| Average rainy days | 7.5 | 6.7 | 8.9 | 10.4 | 21.6 | 25.6 | 26.3 | 25.0 | 24.1 | 26.2 | 19.2 | 12.1 | 213.6 |
| Source: Meteoblue [7] | |||||||||||||
Demographics[]
| Year | Pop. | ±% p.a. |
|---|---|---|
| 1903 | 6,499 | — |
| 1918 | 8,477 | +1.79% |
| 1939 | 8,722 | +0.14% |
| 1948 | 8,547 | −0.22% |
| 1960 | 9,335 | +0.74% |
| 1970 | 9,942 | +0.63% |
| 1975 | 10,778 | +1.63% |
| 1980 | 10,951 | +0.32% |
| 1990 | 11,140 | +0.17% |
| 1995 | 11,106 | −0.06% |
| 2000 | 12,275 | +2.17% |
| 2007 | 12,974 | +0.77% |
| 2010 | 13,383 | +1.14% |
| 2015 | 13,828 | +0.62% |
| 2020 | 14,385 | +0.78% |
| Source: Philippine Statistics Authority [8] [6] [9][10] | ||
Economy[]
| Poverty Incidence of Maria | |
| Source: Philippine Statistics Authority[11][12][13][14][15][16] | |
References[]
- ^ Municipality of Maria | (DILG)
- ^ "2015 Census of Population, Report No. 3 – Population, Land Area, and Population Density" (PDF). Philippine Statistics Authority. Quezon City, Philippines. August 2016. ISSN 0117-1453. Archived (PDF) from the original on May 25, 2021. Retrieved July 16, 2021.
- ^ https://www.philatlas.com/visayas/r07/siquijor/maria.html.
- ^ a b c Census of Population (2020). "Region VII (Central Visayas)". Total Population by Province, City, Municipality and Barangay. PSA. Retrieved 8 July 2021.
- ^ https://psa.gov.ph/sites/default/files/City%20and%20Municipal-level%20Small%20Area%20Poverty%20Estimates_%202009%2C%202012%20and%202015_0.xlsx; publication date: 10 July 2019; publisher: Philippine Statistics Authority.
- ^ a b Census of Population and Housing (2010). "Region VII (Central Visayas)". Total Population by Province, City, Municipality and Barangay. NSO. Retrieved 29 June 2016.
- ^ "Maria: Average Temperatures and Rainfall". Meteoblue. Retrieved 28 April 2020.
- ^ Census of Population (2015). "Region VII (Central Visayas)". Total Population by Province, City, Municipality and Barangay. PSA. Retrieved 20 June 2016.
- ^ Censuses of Population (1903–2007). "Region VII (Central Visayas)". Table 1. Population Enumerated in Various Censuses by Province/Highly Urbanized City: 1903 to 2007. NSO.
- ^ "Province of Siquijor". Municipality Population Data. Local Water Utilities Administration Research Division. Retrieved 17 December 2016.
- ^ "Poverty incidence (PI):". Philippine Statistics Authority. Retrieved 28 December 2020.
- ^ https://psa.gov.ph/sites/default/files/NSCB_LocalPovertyPhilippines_0.pdf; publication date: 29 November 2005; publisher: Philippine Statistics Authority.
- ^ https://psa.gov.ph/sites/default/files/2003%20SAE%20of%20poverty%20%28Full%20Report%29_1.pdf; publication date: 23 March 2009; publisher: Philippine Statistics Authority.
- ^ https://psa.gov.ph/sites/default/files/2006%20and%202009%20City%20and%20Municipal%20Level%20Poverty%20Estimates_0_1.pdf; publication date: 3 August 2012; publisher: Philippine Statistics Authority.
- ^ https://psa.gov.ph/sites/default/files/2012%20Municipal%20and%20City%20Level%20Poverty%20Estima7tes%20Publication%20%281%29.pdf; publication date: 31 May 2016; publisher: Philippine Statistics Authority.
- ^ https://psa.gov.ph/sites/default/files/City%20and%20Municipal-level%20Small%20Area%20Poverty%20Estimates_%202009%2C%202012%20and%202015_0.xlsx; publication date: 10 July 2019; publisher: Philippine Statistics Authority.
External links[]
| Wikimedia Commons has media related to Maria. |
Places adjacent to Maria, Siquijor | |
|---|---|
Siquijor (capital) | |
| Municipalities | |
This article about a location in Central Visayas region of the Philippines is a stub. You can help Wikipedia by . |
Categories:
- Municipalities of Siquijor
- Central Visayas geography stubs