Limerick West (Dáil constituency)
| Limerick West | |
|---|---|
| Former Dáil Constituency | |
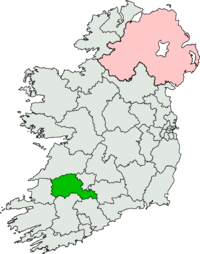 Location of Limerick West within Ireland | |
| Former constituency | |
| Created | 1948 |
| Abolished | 2011 |
| Seats | 3 |
| County/City council | County Limerick |
Limerick West was a parliamentary constituency represented in Dáil Éireann, the lower house of the Irish parliament or Oireachtas from 1948 to 2011. The constituency elected 3 deputies (Teachtaí Dála, commonly known as TDs). The method of election was the single transferable vote form of proportional representation (PR-STV).
History and boundaries[]
The constituency was created under the Electoral (Amendment) Act 1947 for the 1948 general election. It succeeded the constituency of Limerick, which was divided between Limerick West and Limerick East. It was located in the western and southern part of County Limerick. It was a rural constituency, including the towns of Abbeyfeale, Askeaton, Newcastle West and Rathkeale.[1]
In some elections, such as in 1981 and 1982, only Fianna Fáil and Fine Gael candidates appeared on the ballot. A Progressive Democrats candidate was elected in 1987; this was the only time a candidate from a party other than Fianna Fáil or Fine Gael was elected in the constituency. No candidate from a left-wing party was ever elected there.
At the 2011 general election the constituency was replaced by the constituencies of Limerick and Kerry North–West Limerick.[2] The western part of the constituency became part of Kerry North–West Limerick, while the remainder, along with most of the rural parts of Limerick East, was transferred to the Limerick constituency.[3]
TDs[]
| Teachtaí Dála (TDs) for Limerick West 1948–2011[4] | |||||||||||
|---|---|---|---|---|---|---|---|---|---|---|---|
|
Key to parties
| |||||||||||
| Dáil | Election | Deputy (Party) |
Deputy (Party) |
Deputy (Party) | |||||||
| 13th | 1948[5] | James Collins (FF) |
Donnchadh Ó Briain (FF) |
David Madden (FG) | |||||||
| 14th | 1951[6] | ||||||||||
| 15th | 1954[7] | ||||||||||
| 1955 by-election[8] | Michael Colbert (FF) | ||||||||||
| 16th | 1957[9] | Denis Jones (FG) | |||||||||
| 17th | 1961[10] | ||||||||||
| 18th | 1965[11] | ||||||||||
| 1967 by-election[12] | Gerry Collins (FF) | ||||||||||
| 19th | 1969[13] | Michael J. Noonan (FF) | |||||||||
| 20th | 1973[14] | ||||||||||
| 21st | 1977[15] | William O'Brien (FG) | |||||||||
| 22nd | 1981[16] | ||||||||||
| 23rd | 1982 (Feb)[17] | ||||||||||
| 24th | 1982 (Nov)[18] | ||||||||||
| 25th | 1987[19] | John McCoy (Progressive Democrats) | |||||||||
| 26th | 1989[20] | Michael Finucane (FG) | |||||||||
| 27th | 1992[21] | ||||||||||
| 28th | 1997[22] | Michael Collins (FF) |
Dan Neville (FG) | ||||||||
| 29th | 2002[23] | John Cregan (FF) | |||||||||
| 30th | 2007[24] | Niall Collins (FF) | |||||||||
| 31st | 2011 | Constituency abolished. See Limerick and Kerry North–West Limerick | |||||||||
Note: The columns in this table are used only for presentational purposes, and no significance should be attached to the order of columns. For details of the order in which seats were won at each election, see the detailed results of that election.
Elections[]
2007 general election[]
| Party | Candidate | FPv% | Count | |||
|---|---|---|---|---|---|---|
| 1 | 2 | 3 | ||||
| Fianna Fáil | Niall Collins | 25.7 | 10,396 | |||
| Fianna Fáil | John Cregan | 21.5 | 8,701 | 8,823 | 10,355 | |
| Fine Gael | Dan Neville | 20.6 | 8,314 | 8,504 | 10,018 | |
| Fine Gael | Michael Finucane | 19.4 | 7,839 | 7,975 | 9,027 | |
| Labour | James Heffernan | 5.6 | 2,277 | 2,687 | ||
| Progressive Democrats | Michael Brennan | 4.8 | 1,935 | 1,993 | ||
| Green | James Nix | 2.4 | 969 | |||
| Electorate: 58,712 Valid: 40,431 Spoilt: 381 (0.9%) Quota: 10,108 Turnout: 40,812 (69.5%) | ||||||
2002 general election[]
In the final count Dan Neville beat Michael Finucane by only one vote to win the last seat.
| Party | Candidate | FPv% | Count | ||||
|---|---|---|---|---|---|---|---|
| 1 | 2 | 3 | 4 | ||||
| Fianna Fáil | John Cregan | 30.3 | 10,823 | ||||
| Fianna Fáil | Michael J. Collins | 23.1 | 8,236 | 9,526 | |||
| Fine Gael | Dan Neville | 20.9 | 7,446 | 7,678 | 7,862 | 8,564 | |
| Fine Gael | Michael Finucane | 20.8 | 7,410 | 7,684 | 7,867 | 8,563 | |
| Green | Marcus Briody | 2.7 | 948 | 1,002 | 1,138 | ||
| Independent | Mike MacDomhnaill | 1.9 | 662 | 710 | 789 | ||
| Christian Solidarity | Patrick O'Riordan | 0.4 | 144 | 151 | 177 | ||
| Electorate: 53,879 Valid: 35,669 Spoilt: 476 (1.3%) Quota: 8,918 Turnout: 36,145 (67.1%) | |||||||
1997 general election[]
| Party | Candidate | FPv% | Count | |||||||
|---|---|---|---|---|---|---|---|---|---|---|
| 1 | 2 | 3 | 4 | 5 | 6 | 7 | ||||
| Fine Gael | Dan Neville | 20.9 | 7,026 | 7,062 | 7,265 | 7,672 | 8,253 | 8,601 | ||
| Fianna Fáil | Michael Collins | 20.8 | 6,985 | 7,029 | 7,357 | 7,519 | 8,236 | 11,692 | ||
| Fine Gael | Michael Finucane | 16.3 | 5,476 | 5,523 | 5,679 | 6,170 | 6,673 | 6,923 | 7,330 | |
| Fianna Fáil | John Clifford | 11.7 | 3,921 | 3,953 | 4,255 | 4,337 | 4,937 | |||
| Independent | Michael Brennan | 10.9 | 3,661 | 3,695 | 3,890 | 4,067 | 4,946 | 5,474 | 6,583 | |
| Independent | John Gallahue | 10.0 | 3,355 | 3,413 | 3,521 | 3,689 | ||||
| Labour | Mary Kelly | 4.2 | 1,418 | 1,478 | 1,584 | |||||
| Progressive Democrats | Jeanette McDonnell | 4.2 | 1,406 | 1,444 | ||||||
| Independent | Mike MacDomhnaill | 1.1 | 366 | |||||||
| Electorate: 47,859 Valid: 33,614 Spoilt: 365 (1.1%) Quota: 8,404 Turnout: 33,979 (71.0%) | ||||||||||
1992 general election[]
| Party | Candidate | FPv% | Count | |||||||
|---|---|---|---|---|---|---|---|---|---|---|
| 1 | 2 | 3 | 4 | 5 | 6 | 7 | ||||
| Fianna Fáil | Gerard Collins | 34.3 | 10,913 | |||||||
| Fine Gael | Michael Finucane | 16.2 | 5,164 | 5,420 | 5,448 | 5,481 | 5,584 | 6,187 | 7,600 | |
| Fine Gael | Dan Neville | 14.6 | 4,657 | 4,807 | 4,831 | 4,842 | 4,941 | 5,582 | 6,631 | |
| Fianna Fáil | Michael J. Noonan | 13.1 | 4,173 | 6,288 | 6,313 | 6,417 | 6,636 | 7,123 | 7,990 | |
| Labour | Mary Kelly | 10.8 | 3,447 | 3,668 | 3,700 | 3,801 | 3,892 | 4,494 | ||
| Progressive Democrats | Seán Liston | 7.4 | 2,343 | 2,476 | 2,493 | 2,521 | 2,589 | |||
| Independent | Bridget Randles | 2.0 | 645 | 682 | 688 | 709 | ||||
| Sinn Féin | Colreall Mac Curtain | 1.1 | 346 | 365 | 370 | |||||
| Independent | John Basil Fitzgibbon | 0.4 | 129 | 156 | ||||||
| Electorate: 44,848 Valid: 31,817 Spoilt: 524 (1.6%) Quota: 7,955 Turnout: 32,341 (72.1%) | ||||||||||
1989 general election[]
| Party | Candidate | 1st Pref | % | Seat | Count | |
|---|---|---|---|---|---|---|
| Fianna Fáil | Gerry Collins | 12,476 | 39.7 | 1 | 1 | |
| Fine Gael | Michael Finucane | 8,484 | 27.0 | 2 | 1 | |
| Fianna Fáil | Michael J. Noonan | 6,491 | 20.7 | 3 | 2 | |
| Progressive Democrats | Seán Liston | 3,960 | 12.6 | |||
| Electorate: 43,690 Valid: 31,411 Spoilt: 481 (1.5%) Quota: 7,853 Turnout: 31,892 (73.0%) | ||||||
1987 general election[]
| Party | Candidate | 1st Pref | % | Seat | Count | |
|---|---|---|---|---|---|---|
| Fianna Fáil | Gerry Collins | 10,812 | 31.8 | 1 | 1 | |
| Fianna Fáil | Michael J. Noonan | 6,631 | 19.5 | 2 | ||
| Progressive Democrats | John McCoy | 6,580 | 19.4 | 3 | ||
| Fine Gael | Jim Houlihan | 3,352 | 9.9 | |||
| Fine Gael | Michael Finucane | 3,218 | 9.5 | |||
| Fine Gael | Dan Neville | 2,894 | 8.5 | |||
| Labour | Paudge Brennan | 519 | 1.5 | |||
| Electorate: ? Valid: 34,006 Quota: 8,502 Turnout: | ||||||
November 1982 general election[]
| Party | Candidate | 1st Pref | % | Seat | Count | |
|---|---|---|---|---|---|---|
| Fianna Fáil | Gerry Collins | 12,719 | 40.0 | 1 | 1 | |
| Fine Gael | William O'Brien | 8,435 | 26.5 | 2 | 1 | |
| Fianna Fáil | Michael J. Noonan | 7,061 | 22.2 | 3 | ||
| Fine Gael | Brendan Danaher | 3,580 | 11.3 | |||
| Electorate: ? Valid: 31,795 Quota: 7,949 Turnout: | ||||||
February 1982 general election[]
| Party | Candidate | 1st Pref | % | Seat | Count | |
|---|---|---|---|---|---|---|
| Fianna Fáil | Gerry Collins | 12,702 | 40.1 | 1 | ||
| Fine Gael | William O'Brien | 8,390 | 26.5 | 2 | ||
| Fianna Fáil | Michael J. Noonan | 7,535 | 23.8 | 3 | ||
| Fine Gael | Seán Broderick | 3,088 | 9.7 | |||
| Electorate: ? Valid: 31,715 Quota: 7,929 Turnout: | ||||||
1981 general election[]
| Party | Candidate | FPv% | Count | ||
|---|---|---|---|---|---|
| 1 | 2 | ||||
| Fianna Fáil | Gerry Collins | 44.5 | 14,776 | ||
| Fine Gael | William O'Brien | 26.2 | 8,676 | ||
| Fianna Fáil | Michael J. Noonan | 19.8 | 6,579 | 12,731 | |
| Fine Gael | Donal Sheehan | 9.5 | 3,158 | 3,484 | |
| Electorate: 41,097 Valid: 33,189 Spoilt: 387 (1.2%) Quota: 8,298 Turnout: 33,576 (81.7%) | |||||
1977 general election[]
| Party | Candidate | FPv% | Count | |||
|---|---|---|---|---|---|---|
| 1 | 2 | 3 | ||||
| Fianna Fáil | Gerry Collins | 30.2 | 10,081 | |||
| Fianna Fáil | Michael J. Noonan | 29.2 | 9,749 | |||
| Fine Gael | William O'Brien | 22.7 | 7,596 | 8,153 | 8,887 | |
| Fine Gael | Ailish Jones Cassidy | 9.5 | 3,165 | 3,526 | 3,775 | |
| Labour | Edward Dwyer | 4.3 | 1,444 | 1,950 | 2,299 | |
| Fine Gael | Seán Broderick | 4.1 | 1,379 | 1,682 | 1,745 | |
| Electorate: 42,037 Valid: 33,414 Spoilt: 266 (0.8%) Quota: 8,354 Turnout: 33,680 (80.1%)[27] | ||||||
1973 general election[]
| Party | Candidate | 1st Pref | % | Seat | Count | |
|---|---|---|---|---|---|---|
| Fianna Fáil | Gerry Collins | 9,679 | 33.9 | 1 | 1 | |
| Fine Gael | Denis Jones | 6,403 | 22.5 | 3 | ||
| Fianna Fáil | Michael J. Noonan | 5,398 | 18.9 | 2 | ||
| Fine Gael | William O'Brien | 4,253 | 14.9 | |||
| Fine Gael | Brendan Danaher | 2,792 | 9.8 | |||
| Electorate: ? Valid: 28,525 Quota: 7,132 Turnout: | ||||||
1969 general election[]
| Party | Candidate | 1st Pref | % | Seat | Count | |
|---|---|---|---|---|---|---|
| Fianna Fáil | Gerry Collins | 10,557 | 36.7 | 1 | 1 | |
| Fine Gael | Denis Jones | 6,165 | 21.4 | 2 | ||
| Fine Gael | William O'Brien | 3,102 | 10.8 | |||
| Fianna Fáil | Michael J. Noonan | 2,598 | 9.0 | 3 | ||
| Fine Gael | Brendan Danaher | 2,366 | 8.2 | |||
| Fianna Fáil | Rory Kiely | 1,991 | 6.9 | |||
| Labour | Edward Dwyer | 1,254 | 4.4 | |||
| Labour | Michael Murphy | 529 | 1.8 | |||
| Independent | Thomas Lynch | 231 | 0.8 | |||
| Electorate: ? Valid: 28,793 Quota: 7,199 Turnout: | ||||||
1967 by-election[]
Following the death of Fianna Fáil TD James Collins, a by-election was held on 9 November 1967. The seat was won by the Fianna Fáil candidate Gerry Collins, son of the deceased TD.
| Party | Candidate | FPv% | Count | |
|---|---|---|---|---|
| 1 | ||||
| Fianna Fáil | Gerard Collins | 53.8 | 14,384 | |
| Fine Gael | William Madden | 38.6 | 10,237 | |
| Labour | Edward Dwyer | 7.7 | 2,048 | |
| Electorate: 32,958 Valid: 26,669 Quota: 13,335 Turnout: 80.92% | ||||
1965 general election[]
| Party | Candidate | 1st Pref | % | Seat | Count | |
|---|---|---|---|---|---|---|
| Fianna Fáil | James Collins | 8,476 | 33.4 | 1 | 1 | |
| Fine Gael | Denis Jones | 7,213 | 28.5 | 2 | 1 | |
| Fianna Fáil | Donnchadh Ó Briain | 5,343 | 21.1 | 3 | ||
| Labour | Edward Dwyer | 2,304 | 9.1 | |||
| Fine Gael | Brendan Danaher | 2,020 | 8.0 | |||
| Electorate: 33,099 Valid: 25,356 Quota: 6,340 Turnout: 77 | ||||||
1961 general election[]
| Party | Candidate | 1st Pref | % | Seat | Count | |
|---|---|---|---|---|---|---|
| Fianna Fáil | James Collins | 9,018 | 35.6 | 1 | 1 | |
| Fine Gael | Denis Jones | 7,037 | 27.7 | 2 | 1 | |
| Fianna Fáil | Donnchadh Ó Briain | 6,006 | 23.6 | 3 | 2 | |
| Fine Gael | James O'Donnell | 3,346 | 13.2 | |||
| Electorate: 33,411 Valid: 25,407 Quota: 6,352 Turnout: 76% | ||||||
1957 general election[]
| Party | Candidate | 1st Pref | % | Seat | Count | |
|---|---|---|---|---|---|---|
| Fine Gael | Denis Jones | 7,952 | 30.8 | 1 | 1 | |
| Fianna Fáil | James Collins | 7,910 | 30.6 | 2 | 1 | |
| Fianna Fáil | Donnchadh Ó Briain | 4,985 | 19.3 | 3 | 4 | |
| Fianna Fáil | Michael Colbert | 4,467 | 17.3 | |||
| Independent | Martin Ward | 514 | 2.0 | |||
| Electorate: 33,780 Valid: 25,828 Quota: 6,458 Turnout: 76.4% | ||||||
1955 by-election[]
Following the death of Fine Gael TD David Madden, a by-election was held on 13 December 1955. The seat was won by the Fianna Fáil candidate Michael Colbert.
| Party | Candidate | FPv% | Count | |
|---|---|---|---|---|
| 1 | ||||
| Fianna Fáil | Michael Colbert | 56.2 | 15,088 | |
| Fine Gael | Denis F. Jones | 35.0 | 9,406 | |
| Labour | Patrick Aherne | 8.8 | 2,349 | |
| Electorate: 33,267 Valid: 26,843 Quota: 13,422 Turnout: 80.69% | ||||
1954 general election[]
| Party | Candidate | 1st Pref | % | Seat | Count | |
|---|---|---|---|---|---|---|
| Fianna Fáil | James Collins | 7,857 | 28.5 | 1 | 1 | |
| Fianna Fáil | Donnchadh Ó Briain | 7,078 | 25.6 | 2 | 1 | |
| Fine Gael | David Madden | 5,614 | 20.3 | 3 | 4 | |
| Labour | Gerard Hayes | 3,249 | 11.8 | |||
| Fine Gael | William O'Connor | 2,471 | 9.0 | |||
| Fine Gael | Liam Bennett | 1,331 | 4.8 | |||
| Electorate: 33,318 Valid: 27,600 Quota: 6,901 Turnout: 80% | ||||||
1951 general election[]
| Party | Candidate | FPv% | Count | |||
|---|---|---|---|---|---|---|
| 1 | 2 | 3 | ||||
| Fine Gael | David Madden | 29.2 | 7,901 | |||
| Fianna Fáil | James J. Collins | 25.3 | 6,851 | |||
| Fianna Fáil | Donnchadh Ó Briain | 22.0 | 5,966 | 6,069 | 9,189 | |
| Fianna Fáil | Richard Bresnihan | 13.1 | 3,541 | 3,578 | ||
| Fine Gael | William O'Connor | 10.4 | 2,827 | 3,816 | 3,995 | |
| Electorate: 35,877 Valid: 27,086 Quota: 6,772 Turnout: 75.48% | ||||||
1948 general election[]
| Party | Candidate | FPv% | Count | |||||||
|---|---|---|---|---|---|---|---|---|---|---|
| 1 | 2 | 3 | 4 | 5 | 6 | 7 | ||||
| Fianna Fáil | James J. Collins | 24.7 | 6,778 | 6,853 | 6,871 | |||||
| Fianna Fáil | Donnchadh Ó Briain | 22.2 | 6,101 | 6,217 | 6,256 | 6,452 | 6,983 | |||
| Fine Gael | David John Madden | 16.8 | 4,602 | 4,742 | 4,854 | 5,510 | 5,891 | 5,906 | 7,566 | |
| Fianna Fáil | John Lynch | 8.1 | 2,235 | 2,256 | 2,311 | 2,399 | 2,750 | 2,826 | 2,882 | |
| Fine Gael | Timothy O'Connell | 6.5 | 1,783 | 1,844 | 1,908 | 2,069 | 2,194 | 2,207 | ||
| Labour | Patrick Langan | 6.2 | 1,695 | 1,787 | 1,809 | 1,964 | ||||
| Clann na Poblachta | James O'Connor | 5.1 | 1,402 | 1,445 | 1,944 | 2,071 | 2,386 | 2,395 | 2,659 | |
| Independent | Patrick Fitzsimons | 4.6 | 1,257 | 1,439 | 1,482 | |||||
| Clann na Poblachta | Patrick Terence Liston | 3.0 | 836 | 881 | ||||||
| Independent | Michael J. K. Dore | 2.9 | 787 | |||||||
| Electorate: 35,766 Valid: 27,476 Quota: 6,870 Turnout: 76.82% | ||||||||||
See also[]
- Dáil constituencies
- Politics of the Republic of Ireland
- List of political parties in the Republic of Ireland
- List of Dáil by-elections
- Elections in the Republic of Ireland
References[]
- ^ "Electoral (Amendment) Act 2005: Schedule". Irish Statute Book database. Retrieved 24 September 2010.
- ^ "Report on Dáil and European Parliament Constituencies 2007" (PDF). Constituency Commission. 23 October 2007. Archived from the original (PDF) on 19 November 2007. Retrieved 30 June 2010.
- ^ "Electoral (Amendment) Act 2009: Schedule". Irish Statute Book database. Retrieved 29 September 2010.
- ^ Walker, Brian M, ed. (1992). Parliamentary election results in Ireland, 1918–92. Dublin: Royal Irish Academy. ISBN 0-901714-96-8. ISSN 0332-0286.
- ^ "General election 1948: Limerick West". ElectionsIreland.org. Retrieved 30 September 2010.
- ^ "General election 1951: Limerick West". ElectionsIreland.org. Retrieved 30 September 2010.
- ^ a b "General election 1954: Limerick West". ElectionsIreland.org. Retrieved 30 September 2010.
- ^ "By-election 1955: Limerick West". ElectionsIreland.org. Retrieved 30 September 2010.
- ^ a b "General election 1957: Limerick West". ElectionsIreland.org. Retrieved 30 September 2010.
- ^ a b "General election 1961: Limerick West". ElectionsIreland.org. Retrieved 30 September 2010.
- ^ a b "General election 1965: Limerick West". ElectionsIreland.org. Retrieved 30 September 2010.
- ^ "By-election 1967: Limerick West". ElectionsIreland.org. Retrieved 30 September 2010.
- ^ a b "General election 1969: Limerick West". ElectionsIreland.org. Retrieved 30 September 2010.
- ^ a b "General election 1973: Limerick West". ElectionsIreland.org. Retrieved 30 September 2010.
- ^ a b "General election 1977: Limerick West". ElectionsIreland.org. Retrieved 30 September 2010.
- ^ a b "General election 1981: Limerick West". ElectionsIreland.org. Retrieved 30 September 2010.
- ^ a b "General election February 1982: Limerick West". ElectionsIreland.org. Retrieved 30 September 2010.
- ^ a b "General election November 1982: Limerick West". ElectionsIreland.org. Retrieved 30 September 2010.
- ^ a b "General election 1987: Limerick West". ElectionsIreland.org. Retrieved 30 September 2010.
- ^ a b "General election 1989: Limerick West". ElectionsIreland.org. Retrieved 30 September 2010.
- ^ "General election 1992: Limerick West". ElectionsIreland.org. Retrieved 23 February 2009.
- ^ "General election 1997: Limerick West". ElectionsIreland.org. Retrieved 23 February 2009.
- ^ a b "General election 2002: Limerick West". ElectionsIreland.org. Retrieved 23 February 2009.
- ^ a b "General election 2007: Limerick West". ElectionsIreland.org. Retrieved 23 February 2009.
- ^ Government of Ireland (1998). 28th Dáil General Election June, 1997 Election Results and Transfer of Votes. Stationery Office, Government of Ireland.
- ^ Government of Ireland (1993). Dáil General Election November, 1992 Election Results and Transfer of Votes in the General Election for the Twenty-Seventh Dáil. Stationery Office, Government of Ireland.
- ^ The Irish Times, 20 June 1977, p7–10
- ^ a b c d Gallagher, Michael (2009). Irish Elections 1948–77: Results and Analysis Sources for the Study of Irish Politics 2. Routledge. ISBN 9781138973343.
External links[]
- Historic constituencies in County Limerick
- Dáil constituencies in the Republic of Ireland (historic)
- 1948 establishments in Ireland
- 2011 disestablishments in Ireland
- Constituencies established in 1948
- Constituencies disestablished in 2011