List of cities in West Virginia
This article is currently slated for merging. After a discussion, consensus to merge this article into List of municipalities in West Virginia was found. You can help implement the merger by following the instructions at Help:Merging and the resolution on the discussion. |
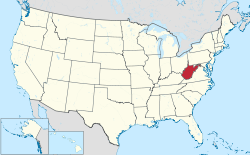
Map of the United States with West Virginia highlighted

Charleston, Capital of West Virginia

Huntington

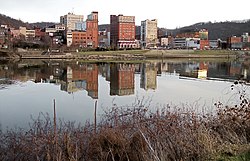
Morgantown
Wheeling

Fairmont
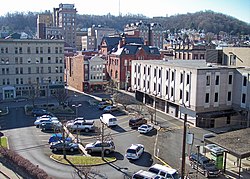
Clarksburg

Weston
West Virginia is a state located in the Southern United States. The following is a list of cities in West Virginia, arranged by population.
List by population[]
| 2020 Rank | City | 2020 Census[1] | 2010 Census[2] | Change | County |
|---|---|---|---|---|---|
| 1 | Charleston †† | 48,864 | 51,400 | −4.93% | Kanawha |
| 2 | Huntington † | 46,842 | 49,138 | −4.67% | Cabell Wayne |
| 3 | Morgantown † | 30,347 | 29,660 | +2.32% | Monongalia |
| 4 | Parkersburg † | 29,738 | 31,492 | −5.57% | Wood |
| 5 | Wheeling † | 27,052 | 28,486 | −5.03% | Ohio Marshall |
| 6 | Weirton | 19,163 | 19,746 | −2.95% | Hancock Brooke |
| 7 | Martinsburg † | 18,777 | 17,227 | +9.00% | Berkeley |
| 8 | Fairmont † | 18,416 | 18,704 | −1.54% | Marion |
| 9 | Beckley † | 17,286 | 17,614 | −1.86% | Raleigh |
| 10 | Clarksburg † | 16,061 | 16,578 | −3.12% | Harrison |
| 11 | South Charleston | 13,647 | 13,450 | +1.46% | Kanawha |
| 12 | St. Albans | 10,861 | 11,044 | −1.66% | Kanawha |
| 13 | Vienna | 10,652 | 10,749 | −0.90% | Wood |
| 14 | Bluefield | 9,658 | 10,447 | −7.55% | Mercer |
| 15 | Bridgeport | 9,336 | 8,149 | +14.57% | Harrison |
| 16 | Oak Hill | 8,179 | 7,730 | +5.81% | Fayette |
| 17 | Moundsville † | 8,093 | 9,318 | −13.15% | Marshall |
| 18 | Dunbar | 7,480 | 7,907 | −5.40% | Kanawha |
| 19 | Hurricane | 6,961 | 6,284 | +10.77% | Putnam |
| 20 | Elkins † | 6,934 | 7,094 | −2.26% | Randolph |
| 21 | Nitro | 6,624 | 7,178 | −7.72% | Kanawha Putnam |
| 22 | Charles Town † | 6,534 | 5,259 | +24.24% | Jefferson |
| 23 | Princeton † | 5,872 | 6,432 | −8.71% | Mercer |
| 24 | Ranson | 5,433 | 4,440 | +22.36% | Jefferson |
| 25 | New Martinsville † | 5,204 | 5,366 | −3.02% | Wetzel |
| 26 | Buckhannon † | 5,186 | 5,639 | −8.03% | Upshur |
| 27 | Keyser † | 4,864 | 5,439 | −10.57% | Mineral |
| 28 | Grafton † | 4,722 | 5,164 | −8.56% | Taylor |
| 29 | Barboursville | 4,456 | 3,964 | +12.41% | Cabell |
| 30 | Point Pleasant † | 4,070 | 4,350 | −6.44% | Mason |
| 31 | Westover | 3,955 | 3,983 | −0.70% | Monongalia |
| 32 | Weston † | 3,952 | 4,110 | −3.84% | Lewis |
| 33 | Lewisburg † | 3,922 | 3,830 | +2.40% | Greenbrier |
| 34 | Ravenswood | 3,865 | 3,876 | −0.28% | Jackson |
| 35 | Welch † | 3,590 | 2,406 | +49.21% | McDowell |
| 36 | Pleasant Valley | 3,498 | 3,149 | +11.08% | Marion |
| 37 | Summersville † | 3,431 | 3,572 | −3.95% | Nicholas |
| 38 | Williamson † | 3,083 | 3,191 | −3.38% | Mingo |
| 39 | Ripley † | 3,079 | 3,252 | −5.32% | Jackson |
| 40 | Kenova | 3,033 | 3,216 | −5.69% | Wayne |
| 41 | Williamstown | 2,997 | 2,908 | +3.06% | Wood |
| 42 | Kingwood † | 2,980 | 2,939 | +1.40% | Preston |
| 43 | Philippi † | 2,929 | 2,966 | −1.25% | Barbour |
| 44 | Madison † | 2,913 | 3,076 | −5.30% | Boone |
| 45 | Fayetteville † | 2,887 | 2,892 | −0.17% | Fayette |
| 46 | Follansbee | 2,848 | 2,986 | −4.62% | Brooke |
| 47 | Milton | 2,811 | 2,423 | +16.01% | Cabell |
| 48 | Bethlehem | 2,605 | 2,499 | +4.24% | Ohio |
| 49 | Paden City | 2,541 | 2,633 | −3.49% | Wetzel Tyler |
| 50 | Moorefield † | 2,524 | 2,544 | −0.79% | Hardy |
| 51 | Wellsburg † | 2,450 | 2,805 | −12.66% | Brooke |
| 52 | Winfield † | 2,393 | 2,301 | +4.00% | Putnam |
| 53 | Shinnston | 2,328 | 2,201 | +5.77% | Harrison |
| 54 | Petersburg † | 2,284 | 2,467 | −7.42% | Grant |
| 55 | Hinton † | 2,245 | 2,676 | −16.11% | Summers |
| 56 | White Sulphur Springs | 2,221 | 2,444 | −9.12% | Greenbrier |
| 57 | Chester | 2,208 | 2,585 | −14.58% | Hancock |
| 58 | Spencer † | 2,063 | 2,322 | −11.15% | Roane |
| 59 | Mannington | 1,952 | 2,063 | −5.38% | Marion |
| 60 | St. Marys † | 1,831 | 1,860 | −1.56% | Pleasants |
| 61 | Belington | 1,805 | 1,921 | −6.04% | Barbour |
| 62 | Stonewood | 1,798 | 1,806 | −0.44% | Harrison |
| 63 | Star City | 1,779 | 1,825 | −2.52% | Monongalia |
| 64 | Romney † | 1,724 | 1,848 | −6.71% | Hampshire |
| 65 | McMechen | 1,697 | 1,926 | −11.89% | Marshall |
| 66 | Richwood | 1,660 | 2,051 | −19.06% | Nicholas |
| 67 | Harrisville † | 1,631 | 1,876 | −13.06% | Ritchie |
| 69 | Ronceverte | 1,572 | 1,765 | −10.93% | Greenbrier |
| 70 | Eleanor | 1,542 | 1,518 | +1.58% | Putnam |
| 71 | Shepherdstown | 1,531 | 1,734 | −11.71% | Jefferson |
| 72 | Salem | 1,529 | 1,586 | −3.59% | Harrison |
| 73 | Marmet | 1,504 | 1,503 | +0.07% | Kanawha |
| 74 | Glen Dale | 1,496 | 1,526 | −1.97% | Marshall |
| 75 | Nutter Fort | 1,493 | 1,593 | −6.28% | Harrison |
| 76 | Mullens | 1,480 | 1,559 | −5.07% | Wyoming |
| 77 | New Haven | 1,476 | 1,560 | −5.38% | Mason |
| 78 | West Liberty | 1,454 | 1,542 | −5.71% | Ohio |
| 79 | Oceana | 1,449 | 1,394 | +3.95% | Wyoming |
| 80 | Wayne † | 1,443 | 1,413 | +2.12% | Wayne |
| 81 | Logan † | 1,439 | 1,779 | −19.11% | Logan |
| 82 | Terra Alta | 1,415 | 1,477 | −4.20% | Preston |
| 83 | Sistersville | 1,412 | 1,396 | +1.15% | Tyler |
| 84 | Ceredo | 1,408 | 1,450 | −2.90% | Wayne |
| 85 | Granville | 1,355 | 781 | +73.50% | Monongalia |
| 86 | Mabscott | 1,341 | 1,408 | −4.76% | Raleigh |
| 87 | Chesapeake | 1,335 | 1,554 | −14.09% | Kanawha |
| 88 | Parsons † | 1,327 | 1,485 | −10.64% | Tucker |
| 89 | Ansted | 1,303 | 1,404 | −7.19% | Fayette |
| 90 | Montgomery | 1,275 | 1,638 | −22.16% | Fayette Kanawha |
| 91 | Benwood | 1,252 | 1,420 | −11.83% | Marshall |
| 92 | Buffalo | 1,211 | 1,236 | −2.02% | Putnam |
| 93 | Barrackville | 1,201 | 1,302 | −7.76% | Marion |
| 94 | Rainelle | 1,190 | 1,505 | −20.93% | Greenbrier |
| 95 | Belle | 1,169 | 1,260 | −7.22% | Kanawha |
| 96 | Sophia | 1,130 | 1,344 | −15.92% | Raleigh |
| 97 | Glenville † | 1,129 | 1,537 | −26.55% | Gilmer |
| 98 | Mount Hope | 1,125 | 1,414 | −20.44% | Fayette |
| 99 | Pennsboro | 1,054 | 1,171 | −9.99% | Ritchie |
| 100 | Hamlin † | 1,039 | 1,142 | −9.02% | Lincoln |
| 101 | Bolivar | 1,036 | 1,045 | −0.86% | Jefferson |
| 102 | Chapmanville | 1,020 | 1,256 | −18.79% | Logan |
| 103 | New Cumberland † | 1,020 | 1,103 | −7.52% | Hancock |
| 104 | Marlinton † | 998 | 1,054 | −5.31% | Pocahontas |
| 105 | Alderson | 975 | 1,184 | −17.65% | Greenbrier Monroe |
| 106 | Monongah | 965 | 1,044 | −7.57% | Marion |
| 107 | Athens | 962 | 1,048 | −8.21% | Mercer |
| 108 | Rupert | 877 | 942 | −6.90% | Greenbrier |
| 109 | Belmont | 875 | 903 | −3.10% | Pleasants |
| 110 | Poca | 874 | 974 | −10.27% | Putnam |
| 111 | Mason | 866 | 968 | −10.54% | Mason |
| 112 | Sutton † | 863 | 994 | −13.18% | Braxton |
| 113 | Cameron | 861 | 946 | −8.99% | Marshall |
| 114 | Carpendale | 860 | 977 | −11.98% | Mineral |
| 115 | Clendenin | 854 | 1,227 | −30.40% | Kanawha |
| 116 | North Hills | 834 | 832 | +0.24% | Wood |
| 117 | Rivesville | 828 | 934 | −11.35% | Marion |
| 118 | East Bank | 822 | 959 | −14.29% | Kanawha |
| 119 | Bethany | 781 | 1,036 | −24.61% | Brooke |
| 120 | Gary | 773 | 968 | −20.14% | McDowell |
| 121 | Man | 772 | 759 | +1.71% | Logan |
| 122 | Gassaway | 759 | 908 | −16.41% | Braxton |
| 123 | Smithers | 754 | 813 | −7.26% | Fayette Kanawha |
| 124 | Berkeley Springs (Bath) † | 753 | 624 | +20.67% | Morgan |
| 125 | Webster Springs (Addison) † | 731 | 776 | −5.80% | Webster |
| 126 | Elizabeth † | 724 | 823 | −12.03% | Wirt |
| 127 | Cedar Grove | 718 | 997 | −27.98% | Kanawha |
| 128 | Piedmont | 718 | 876 | −18.04% | Mineral |
| 129 | Lumberport | 717 | 876 | −18.15% | Harrison |
| 130 | Middlebourne † | 717 | 815 | −12.02% | Tyler |
| 131 | Glasgow | 703 | 905 | −22.32% | Kanawha |
| 132 | White Hall | 700 | 648 | +8.02% | Marion |
| 133 | Grant Town | 685 | 613 | +11.75% | Marion |
| 134 | Fort Gay | 675 | 705 | −4.26% | Wayne |
| 135 | Danville | 672 | 691 | −2.75% | Boone |
| 136 | Triadelphia | 669 | 811 | −17.51% | Ohio |
| 137 | West Union † | 653 | 825 | −20.85% | Doddridge |
| 138 | Pineville † | 645 | 668 | −3.44% | Wyoming |
| 139 | War | 623 | 862 | −27.73% | McDowell |
| 140 | Beverly | 622 | 702 | −11.40% | Randolph |
| 141 | Thomas | 611 | 586 | +4.27% | Tucker |
| 142 | Davis | 600 | 660 | −9.09% | Tucker |
| 143 | Ridgeley | 591 | 675 | −12.44% | Mineral |
| 144 | Mill Creek | 560 | 724 | −22.65% | Randolph |
| 145 | Beech Bottom | 553 | 523 | +5.74% | Brooke |
| 146 | Gauley Bridge | 553 | 614 | −9.93% | Fayette |
| 147 | Reedsville | 530 | 593 | −10.62% | Preston |
| 148 | West Hamlin | 524 | 774 | −32.30% | Lincoln |
| 149 | Anmoore | 513 | 770 | −33.38% | Harrison |
| 150 | Masontown | 510 | 546 | −6.59% | Preston |
| 151 | Hartford City | 503 | 614 | −18.08% | Mason |
| 152 | Franklin † | 495 | 721 | −31.35% | Pendleton |
| 153 | Grantsville † | 494 | 561 | −11.94% | Calhoun |
| 154 | Cowen | 487 | 541 | −9.98% | Webster |
| 155 | Pratt | 483 | 602 | −19.77% | Kanawha |
| 156 | Clearview | 472 | 565 | −16.46% | Ohio |
| 157 | West Milford | 449 | 630 | −28.73% | Harrison |
| 158 | Peterstown | 448 | 653 | −31.39% | Monroe |
| 159 | Rowlesburg | 438 | 584 | −25.00% | Preston |
| 160 | Delbarton | 422 | 579 | −27.12% | Mingo |
| 161 | Capon Bridge | 420 | 355 | +18.31% | Hampshire |
| 162 | Union † | 419 | 565 | −25.84% | Monroe |
| 163 | Matewan | 412 | 499 | −17.43% | Mingo |
| 164 | Paw Paw | 410 | 508 | −19.29% | Morgan |
| 165 | Jane Lew | 408 | 409 | −0.24% | Lewis |
| 166 | West Logan | 399 | 424 | −5.90% | Logan |
| 167 | Clay † | 396 | 491 | −19.35% | Clay |
| 168 | Burnsville | 394 | 510 | −22.75% | Braxton |
| 169 | Farmington | 392 | 375 | +4.53% | Marion |
| 170 | Bancroft | 387 | 587 | −34.07% | Putnam |
| 171 | Junior | 384 | 520 | −26.15% | Barbour |
| 172 | Fairview | 373 | 408 | −8.58% | Marion |
| 173 | Pine Grove | 363 | 552 | −34.24% | Wetzel |
| 174 | Whitesville | 361 | 514 | −29.77% | Boone |
| 175 | Windsor Heights | 361 | 423 | −14.66% | Brooke |
| 176 | Lost Creek | 359 | 496 | −27.62% | Harrison |
| 177 | Lester | 338 | 348 | −2.87% | Raleigh |
| 178 | Gilbert | 333 | 450 | −26.00% | Mingo |
| 179 | Meadow Bridge | 324 | 379 | −14.51% | Fayette |
| 180 | Kermit | 317 | 406 | −21.92% | Mingo |
| 181 | Mitchell Heights | 314 | 323 | −2.79% | Logan |
| 182 | Flemington | 309 | 312 | −0.96% | Taylor |
| 183 | Hedgesville | 300 | 318 | −5.66% | Berkeley |
| 184 | Tunnelton | 296 | 294 | +0.68% | Preston |
| 185 | Bramwell | 276 | 364 | −24.18% | Mercer |
| 186 | Valley Grove | 275 | 378 | −27.25% | Ohio |
| 187 | Harpers Ferry | 269 | 286 | −5.94% | Jefferson |
| 188 | Wardensville | 269 | 271 | −0.74% | Hardy |
| 189 | Flatwoods | 264 | 277 | −4.69% | Braxton |
| 190 | Newburg | 259 | 329 | −21.28% | Preston |
| 191 | Iaeger | 257 | 302 | −14.90% | McDowell |
| 192 | Hundred | 255 | 299 | −14.72% | Wetzel |
| 193 | Albright | 249 | 299 | −16.72% | Preston |
| 194 | Hillsboro | 232 | 260 | −10.77% | Pocahontas |
| 195 | Durbin | 231 | 293 | −21.16% | Pocahontas |
| 196 | Northfork | 231 | 429 | −46.15% | McDowell |
| 197 | Henderson | 228 | 271 | −15.87% | Mason |
| 198 | Hendricks | 228 | 272 | −16.18% | Tucker |
| 199 | Handley | 223 | 349 | −36.10% | Kanawha |
| 200 | Quinwood | 222 | 290 | −23.45% | Greenbrier |
| 201 | Ellenboro | 221 | 363 | −39.12% | Ritchie |
| 202 | Hambleton | 218 | 232 | −6.03% | Tucker |
| 203 | Elk Garden | 212 | 232 | −8.62% | Mineral |
| 204 | Davy | 209 | 420 | −50.24% | McDowell |
| 205 | Bradshaw | 207 | 337 | −38.58% | McDowell |
| 206 | Bayard | 201 | 290 | −30.69% | Grant |
| 207 | Womelsdorf (Coalton) | 189 | 250 | −24.40% | Randolph |
| 208 | Sand Fork | 180 | 159 | +13.21% | Gilmer |
| 209 | Worthington | 179 | 158 | +13.29% | Marion |
| 210 | Cairo | 176 | 281 | −37.37% | Ritchie |
| 211 | Keystone | 176 | 282 | −37.59% | McDowell |
| 212 | Matoaka | 173 | 227 | −23.79% | Mercer |
| 213 | Sylvester | 171 | 160 | +6.88% | Boone |
| 214 | Falling Spring | 170 | 211 | −19.43% | Greenbrier |
| 215 | Anawalt | 165 | 226 | −26.99% | McDowell |
| 216 | Huttonsville | 163 | 221 | −26.24% | Randolph |
| 217 | Reedy | 150 | 182 | −17.58% | Roane |
| 218 | Kimball | 145 | 194 | −25.26% | McDowell |
| 219 | Montrose | 145 | 156 | −7.05% | Randolph |
| 220 | Rhodell | 141 | 173 | −18.50% | Raleigh |
| 221 | Leon | 137 | 158 | −13.29% | Mason |
| 222 | Pax | 136 | 167 | −18.56% | Fayette |
| 223 | Pullman | 135 | 154 | −12.34% | Ritchie |
| 224 | Oakvale | 133 | 121 | +9.92% | Mercer |
| 225 | Brandonville | 129 | 101 | +27.72% | Preston |
| 226 | Camden-on-Gauley | 126 | 169 | −25.44% | Webster |
| 227 | Blacksville | 118 | 171 | −30.99% | Monongalia |
| 228 | Smithfield | 103 | 145 | −28.97% | Wetzel |
| 229 | Friendly | 101 | 132 | −23.48% | Tyler |
| 230 | Harman | 95 | 143 | −33.57% | Randolph |
| 231 | Auburn | 79 | 97 | −18.56% | Ritchie |
| 232 | Bruceton Mills | 63 | 85 | −25.88% | Preston |
| 233 | Thurmond | 5 | 5 | 0.00% | Fayette |
See also[]
- West Virginia
- List of towns in West Virginia
- List of villages in West Virginia
- List of census-designated places in West Virginia
References[]
- ^ "City and Town Population Totals: 2010-2020". United States Census Bureau. Retrieved November 27, 2021.
- ^ "2010 Census Redistricting Data (Public Law 94-171) Summary File". American FactFinder2. U.S. Census Bureau, 2010 Census. Retrieved August 23, 2014.[dead link]
Charleston (capital) | ||
| Topics |
| |
| Society | ||
| Insignia |
| |
| Regions |
| |
| Metro areas |
| |
| Largest cities |
| |
| Counties |
| |

Categories:
- Cities in West Virginia
- Lists of cities in the United States by state
- Lists of places in West Virginia