List of neighborhoods of St. Louis


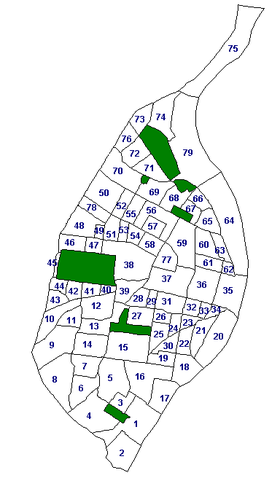
St. Louis is divided into 79 neighborhoods. Census data is collected for each neighborhood, as well as crime data, historic property data, and dining establishment health ratings. National historic neighborhoods are identified by the official neighborhood to which they belong.
Also, several neighborhood names extend to areas well beyond their technical borders. For example, Downtown St. Louis is generally thought to include the St. Louis Union Station and Enterprise Center, even though Downtown technically ends at Tucker Avenue (12th Street). Additionally, the Fox Theatre and Powell Symphony Hall are popularly considered a part of Midtown St. Louis even though they are in Grand Center. Dogtown is an area south of Forest Park that includes at least 4 distinct neighborhoods.
Moreover, sometimes several neighborhoods are lumped together in categories such as "North City" and "South City." North City used to have large Polish and German, among others, immigrant populations, evidenced by the churches they built, such as St. Stanislaus Kostka Church.
List of neighborhoods[]

The following is a list of neighborhoods of the city of St. Louis, Missouri.
Demographics[]
| Neighborhood | Population | White | Black | Hispanic/Latino2 | AIAN1 | Asian | Mixed Race | Corridor |
|---|---|---|---|---|---|---|---|---|
| Academy | 2,355 | 5.0 | 87.3 | 2.3 | 0.3 | 1.1 | 5.3 | North |
| Baden | 5,465 | 3.9 | 91.8 | 0.8 | 0.4 | 0.1 | 3.4 | North |
| Benton Park | 3,581 | 68.1 | 22.3 | 3.8 | 0.4 | 1.3 | 6.8 | South |
| Benton Park West | 4,328 | 31.7 | 50.0 | 13.2 | 0.6 | 1.9 | 8.2 | South |
| Bevo Mill | 11,941 | 58.3 | 20.6 | 11.6 | 0.6 | 4.8 | 9.9 | South |
| Botanical Heights | 1,196 | 37.2 | 50.0 | 5.0 | 0.3 | 3.3 | 7.3 | Central |
| Boulevard Heights | 8,690 | 74.0 | 6.4 | 5.5 | 0.3 | 9.1 | 7.9 | South |
| Carondelet | 7,734 | 43.1 | 39.3 | 9.6 | 0.5 | 1.5 | 9.9 | South |
| Carr Square | 2,236 | 2.1 | 94.9 | 0.9 | 0 | 0.3 | 2.0 | North |
| Central West End | 16,670 | 56.9 | 21.0 | 4.7 | 0.1 | 13.7 | 6.4 | Central |
| Cheltenham | 1260 | 65.2 | 8.4 | 5.4 | 0.2 | 17.9 | 7.1 | Central |
| Clayton-Tamm | 2,348 | 85.2 | 4.6 | 4.8 | 0.2 | 2.2 | 6.8 | Central |
| Clifton Heights | 2,836 | 86.2 | 3.9 | 3.3 | 0.1 | 2.3 | 5.8 | South |
| College Hill | 1,243 | 4.3 | 92.2 | 0.6 | 0.5 | 1.7 | 1.6 | North |
| Columbus Square | 1,978 | 5.8 | 88.7 | 2.2 | 0.2 | 0.6 | 3.3 | North |
| Compton Heights | 1,396 | 72.6 | 16.5 | 3.5 | 0.2 | 3.6 | 6.3 | South |
| DeBaliviere Place | 3,651 | 55.0 | 25.0 | 5.0 | 0.2 | 10.9 | 6.9 | Central |
| Downtown | 5,442 | 43.3 | 44.2 | 4.9 | 0.3 | 4.4 | 5.6 | Central |
| Downtown West | 5,115 | 46.2 | 41.0 | 4.8 | 0.4 | 4.0 | 6.0 | Central |
| Dutchtown | 15,356 | 26.0 | 50.7 | 12.1 | 0.5 | 7.0 | 8.3 | South |
| Ellendale | 1,385 | 76.3 | 10.6 | 4.3 | 0.2 | 1.7 | 8.4 | South |
| Fairground | 1,157 | 2.8 | 93.7 | 0.9 | 0.4 | 0 | 2.2 | North |
| Forest Park Southeast | 3,458 | 46.2 | 36.1 | 4.7 | 0.2 | 7.0 | 7.3 | Central |
| Fountain Park | 1,075 | 3.6 | 89.2 | 1.7 | 1.1 | 0 | 4.2 | North |
| Fox Park | 2,545 | 41.4 | 48.9 | 4.8 | 0.1 | 1.3 | 5.4 | South |
| Franz Park | 2,260 | 80.4 | 6.0 | 5.0 | 0.2 | 2.9 | 7.7 | Central |
| The Gate District | 3,419 | 19.2 | 72.5 | 3.0 | 0.1 | 1.9 | 5.1 | Central |
| Grand Center | 3,041 | 31.1 | 53.1 | 5.2 | 0.1 | 8.7 | 4.4 | Central |
| Gravois Park | 4,684 | 20.6 | 60.7 | 10.9 | 0.5 | 2.7 | 8.0 | South |
| Greater Ville | 4,545 | 1.3 | 95.2 | 1.1 | 0.2 | 0 | 2.5 | North |
| Hamilton Heights | 2,187 | 2.7 | 92.8 | 1.4 | 0.1 | 0.1 | 3.3 | North |
| The Hill | 2,487 | 90.4 | 2.5 | 3.3 | 0.2 | 1.1 | 4.5 | South |
| Hi-Pointe | 2,151 | 80.2 | 6.3 | 3.5 | 0.2 | 5.3 | 6.6 | Central |
| Holly Hills | 3,647 | 67.5 | 16.8 | 8.0 | 0.5 | 3.2 | 8.6 | South |
| Hyde Park | 2,271 | 9.7 | 84.6 | 1.6 | 0.4 | 0.3 | 3.8 | North |
| JeffVanderLou | 4,209 | 2.9 | 92.3 | 1.5 | 0.5 | 0.2 | 3.6 | North |
| Kings Oak | 167 | 61.1 | 31.1 | 1.2 | 0 | 0.6 | 6.0 | Central |
| Kingsway East | 2,502 | 1.8 | 92.9 | 1.1 | 0.3 | 0.2 | 4.0 | North |
| Kingsway West | 2,604 | 7.0 | 89.6 | 0.6 | 0.1 | 0 | 2.6 | North |
| Kosciusko | 52 | 38.5 | 30.8 | 15.4 | 0 | 0 | 26.9 | South |
| Lafayette Square | 2,164 | 77.7 | 11.4 | 3.3 | 0 | 2.4 | 7.3 | Central |
| LaSalle Park | 1,088 | 30.7 | 62.7 | 1.6 | 0.1 | 0.4 | 5.4 | Central |
| Lewis Place | 1,359 | 11.8 | 84.5 | 1.8 | 0.4 | 0.2 | 2.1 | North |
| Lindenwood Park | 9,387 | 83.1 | 6.3 | 4.4 | 0.1 | 2.5 | 6.6 | South |
| Marine Villa | 2,530 | 35.3 | 48.0 | 10.1 | 0.7 | 1.1 | 9.1 | South |
| Mark Twain | 3,257 | 2.4 | 95.1 | 1.0 | 0.2 | 0.3 | 1.4 | North |
| Mark Twain/I-70 Industrial | 902 | 3.7 | 92.5 | 1.3 | 0.1 | 0.2 | 3.0 | North |
| McKinley Heights | 1,668 | 52.3 | 37.8 | 3.2 | 0.1 | 1.5 | 7.8 | South |
| Midtown | 6,862 | 47.7 | 34.7 | 3.9 | 0.2 | 9.7 | 4.1 | Central |
| Mount Pleasant | 4,376 | 36.3 | 46.7 | 10.6 | 0.6 | 2.1 | 7.8 | South |
| Near North Riverfront | 395 | 42.5 | 50.6 | 3.8 | 0.3 | 2.8 | 2.1 | North |
| North Hampton | 7,489 | 71.4 | 15.9 | 4.6 | 0.3 | 4.2 | 6.8 | South |
| North Point | 3,396 | 1.6 | 95.3 | 0.8 | 0.1 | 0 | 2.5 | North |
| North Riverfront | 154 | 57.8 | 32.5 | 9.7 | 1.3 | 0.6 | 0 | North |
| O’Fallon | 4,342 | 1.3 | 95.2 | 0.8 | 0.3 | 0.5 | 2.5 | North |
| Old North St. Louis | 1,488 | 12.8 | 82.5 | 1.1 | 0.1 | 0.1 | 4.3 | North |
| Patch | 2,842 | 55.2 | 29.7 | 8.1 | 1.0 | 1.3 | 8.8 | South |
| Peabody Darst Webbe | 2,443 | 15.3 | 79.7 | 1.6 | 0.1 | 0.8 | 3.6 | Central |
| Penrose | 5,243 | 0.9 | 95.3 | 0.8 | 0.5 | 0 | 2.8 | North |
| Princeton Heights | 7,346 | 81.4 | 7.4 | 5.0 | 0.2 | 1.9 | 7.4 | South |
| Riverview | 242 | 28.1 | 69.8 | 0.4 | 0 | 0 | 1.7 | North |
| Shaw | 6,919 | 66.2 | 21.9 | 4.4 | 0.2 | 2.8 | 7.7 | South |
| Skinker-DeBaliviere | 3,899 | 48.6 | 29.4 | 4.2 | 0.4 | 13.2 | 6.7 | Central |
| Soulard | 3,831 | 75.2 | 15.8 | 4.3 | 0.2 | 1.1 | 6.0 | South |
| South Hampton | 6,647 | 82.0 | 8.6 | 4.4 | 0.4 | 1.7 | 5.9 | South |
| Southwest Garden | 5,245 | 73.8 | 13.1 | 4.5 | 0.2 | 4.7 | 6.5 | South |
| St. Louis Hills | 7,516 | 88.8 | 3.7 | 2.6 | 0.2 | 1.5 | 5.0 | South |
| St. Louis Place | 2,336 | 6.3 | 89.8 | 1.4 | 0.5 | 0.2 | 2.9 | North |
| Tiffany | 915 | 25.7 | 62.6 | 3.5 | 0.2 | 4.7 | 4.5 | Central |
| Tower Grove East | 5,708 | 55.6 | 28.9 | 5.3 | 0.1 | 5.3 | 8.2 | South |
| Tower Grove South | 12,719 | 57.6 | 21.8 | 8.4 | 0.4 | 7.7 | 7.6 | South |
| Vandeventer | 2,041 | 4.8 | 88.9 | 1.9 | 0.4 | 0.5 | 3.9 | North |
| The Ville | 1,427 | 1.7 | 95.9 | 0.3 | 0.3 | 0 | 1.8 | North |
| Visitation Park | 924 | 18.1 | 77.6 | 1.5 | 0.2 | 1.2 | 2.3 | North |
| Walnut Park East | 2,757 | 1.4 | 93.9 | 1.6 | 0.1 | 0 | 3.4 | North |
| Walnut Park West | 2,561 | 0.8 | 95.1 | 0.8 | 0.2 | 0.1 | 3.4 | North |
| Wells/Goodfellow | 4,473 | 1.5 | 94.7 | 1.0 | 0.1 | 0.1 | 2.9 | North |
| West End | 6,846 | 10.5 | 71.5 | 7.7 | 0.4 | 6.8 | 5.4 | North |
| Wydown/Skinker | 1,121 | 73.4 | 2.9 | 3.7 | 0.2 | 18.5 | 4.6 | Central |
- All Data from 2020 U.S. Census Bureau[1]
^1 American Indian or Alaskan Native ^2 May be of any race.
The north side of the city is defined as north of Delmar Boulevard, the central corridor as between Delmar and I-44, and the south side as south of I-44.
In 2020 the north side was 90.0% Black, 4.5% White, 0.3% American Indian/Alaska Native, 0.8% Asian, 3.2% Two or More Races and 1.2% Some Other Race. 1.8% of the population was of Hispanic or Latino origin.
In 2020 the central corridor was 32.6% Black, 50.9% White, 0.2% American Indian/Alaska Native, 5.9% Two or More Races, 8.3% Asian, and 2.0% Some Other Race. 4.3% of the population was of Hispanic or Latino origin.
In 2020 the south side was 24.0% black, 60.6% white, 0.4% American Indian/Alaska Native, 7.6% Two or More Races, 3.9% Asian, and 3.6% Some Other Race. 7.1% of the population was of Hispanic or Latino origin.
Aldermanic wards[]
The city can also be divided by the wards of the Board of Aldermen. These wards, however, change with every new census, and data is not as readily available for comparison across wards. Nevertheless, the wards are important in the functioning of the city, as the approval of the local Alderman is generally understood to be necessary before large projects may begin.
References[]
- "St. Louis Census 2000". U.S. Census Bureau. Retrieved 2008-05-30.
- ^ "2020 Census Neighborhood Results". Retrieved 2021-09-27.
External links[]
- St. Louis Neighborhoods - official city site with map
- History of St. Louis Neighborhoods - Historical Neighborhoods with map
- Architectural Survey of Historic La Salle Park February, 1977 - Map of historic buildings
| |
|
- Neighborhoods in St. Louis
- Lists of neighborhoods in U.S. cities
- St. Louis-related lists