List of wettest tropical cyclones in the United States

Tropical cyclones move into the contiguous United States from the Atlantic Ocean, the Gulf of Mexico, and the eastern Pacific Ocean. The highest rainfall totals in the country have been measured across the Gulf Coast and lower portions of the Eastern Seaboard. Intermediate amounts have been measured across the Southwest, New England, and the Midwest. The northern Great Plains and Pacific Northwest have received the lowest amounts, as those regions lie exceptionally far from the breeding grounds of Atlantic and Eastern Pacific tropical cyclones.
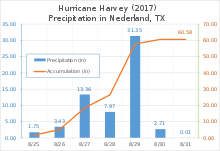
The wettest tropical cyclone in the United States storm on record is Hurricane Harvey, which dumped 60.58 in (1,539 mm) of rain on Southeast Texas in 2017. Tropical Storm Claudette holds the national 24-hour rainfall record: 42.00 in (1,067 mm) in Alvin, Texas.
Overall wettest[]
Here are the 10 highest rainfall amounts from tropical cyclones in the United States since 1950, including territories.
| Precipitation | Storm | Location | Ref. | ||
|---|---|---|---|---|---|
| Rank | mm | in | |||
| 1 | 1538.7 | 60.58 | Harvey 2017 | Nederland, Texas | [1] |
| 2 | 1473 | 58.00 | Lane 2018 | Kahūnā Falls, Hawaii | [2] |
| 3 | 1321 | 52.00 | Hiki 1950 | Kanalohuluhulu Ranger Station, Hawaii | [3] |
| 4 | 1219 | 48.00 | Amelia 1978 | Medina, Texas | [1] |
| 5 | 1148 | 45.20 | Easy 1950 | Yankeetown, Florida | [1] |
| 6 | 1143 | 45.00 | Claudette 1979 | Alvin, Texas | [1] |
| 7 | 1096 | 43.15 | Imelda 2019 | Jefferson County, Texas | [4] |
| 8 | 1058.7 | 41.68 | T. D. #15 1970 | Jayuya, Puerto Rico | [1] |
| 9 | 1033 | 40.68 | Allison 2001 | Northwest Jefferson County, Texas | [1] |
| 10 | 985 | 38.76 | Paul 2000 | Kapapala Ranch 36, Hawaii | [5] |
Overall wettest in the contiguous United States[]
Here are the 10 highest rainfall amounts from tropical cyclones in the contiguous United States since 1950. Amelia 1978 held the record until[1] Hurricane Harvey dropped 60.58 inches (1538.7 mm) in 2017.[1]
| Precipitation | Storm | Location | Ref. | ||
|---|---|---|---|---|---|
| Rank | mm | in | |||
| 1 | 1538.7 | 60.58 | Harvey 2017 | Nederland, Texas | [1] |
| 2 | 1219 | 48.00 | Amelia 1978 | Medina, Texas | [1] |
| 3 | 1148 | 45.20 | Easy 1950 | Yankeetown, Florida | [1] |
| 4 | 1143 | 45.00 | Claudette 1979 | Alvin, Texas | [1] |
| 5 | 1096 | 43.31 | Imelda 2019 | Jefferson County, Texas | [4] |
| 6 | 1033 | 40.68 | Allison 2001 | Northwest Jefferson County, Texas | [1] |
| 7 | 977 | 38.46 | Georges 1998 | Munson, Florida | [1] |
| 8 | 932.4 | 36.71 | Danny 1997 | Dauphin Island Sea Lab, Alabama | [1] |
| 9 | 912.6 | 35.93 | Florence 2018 | Elizabethtown, North Carolina | [6] |
| 10 | 756 | 29.76 | Unnamed 1960 | Port Lavaca #2, Texas | [1] |
Alabama[]
The wettest tropical cyclone to hit the state of Alabama was Hurricane Danny, which stalled over Mobile Bay for over 24 hours.[7]

| Precipitation | Storm | Location | Ref. | ||
|---|---|---|---|---|---|
| Rank | mm | in | |||
| 1 | 932.4 | 36.71 | Danny 1997 | Dauphin Island Sea Lab | [1][1] |
| 3 | 761.7 | 29.99 | Sally 2020 | Orange Beach | [8] |
| 2 | 753.4 | 29.66 | Georges 1998 | Bay Minette | [9] |
| 4 | 574.8 | 22.63 | Alberto 1994 | Enterprise 5 NNW | [9] |
| 5 | 493.3 | 19.42 | Opal 1995 | Brewton 3 ENE | [1] |
| 6 | 469.9 | 18.50 | 1926 Miami hurricane | Bay Minette | [10] |
| 7 | 428.0 | 16.85 | Debbie 1965 | Mobile | [1] |
| 8 | 420.6 | 16.56 | Unnamed 1987 | Brewton 3 SSE | [9] |
| 9 | 408.7 | 16.09 | Beryl 1988 | Dauphin Island #2 | [1] |
| 10 | 393.7 | 15.50 | Tropical Storm Two 1931 | Seven Hill | [10] |
Alaska[]
No storm has ever affected Alaska as a tropical cyclone, but extratropical remnants of tropical cyclones have brought heavy rainfall to the state. Examples include the extratropical remnants of Hurricane Fico in 1978.[11]
American Samoa[]

Tropical cyclones affect the island chain with tropical storm-force winds once every three years, on average.[12] The wettest known cyclone to affect the island group occurred early in 1966, when nearly 19 inches (480 mm) fell at Vaipito.[1]
| Precipitation | Storm | Location | Ref. | ||
|---|---|---|---|---|---|
| Rank | mm | in | |||
| 1 | 472.4 | 18.60 | Unnamed Jan-Feb 1966 | Vaipito | [1] |
| 2 | 445.5 | 17.54 | Val 1991 | Pago Pago Airport | [1] |
| 3 | 394.7 | 15.54 | Ofa 1990 | Aasufou | [1] |
| 4 | 359.9 | 14.17 | Heta 2004 | Aasufou | [1] |
| 5 | 254.5 | 10.02 | Olaf 2005 | Aasufou | [1] |
| 6 | 242.8 | 9.56 | Wilma 2011 | NWS Pago Pago | [13] |
| 7 | 212.1 | 8.35 | Esau 1981 | Aasufou | [1] |
| 8 | 198.1 | 7.80 | Tuni 2015 | Tafuna | [14] |
| 8 | 118.0 | 4.65 | Nisha 2010 | NWS Pago Pago | [15] |
| 9 | 95.5 | 3.76 | Keli 1997 | Afono | [1] |
Arizona[]
Hurricane Nora was the last tropical cyclone to enter the United States from Mexico at tropical storm strength.[16] The rainfall which fell across the Harquahala Mountains led to the state's 24-hour rainfall record.[17]

| Precipitation | Storm | Location | Ref. | ||
|---|---|---|---|---|---|
| Rank | mm | in | |||
| 1 | 305.1 | 12.01 | Nora 1997 | Harquahala Mountains | [18] |
| 2 | 304.8 | 12.00 | Octave 1983 | Mount Graham | [18] |
| 3 | 210.8 | 8.30 | Heather 1977 | Nogales | [18] |
| 4 | 178.1 | 7.01 | Doreen 1977 | Yuma Valley | [18] |
| 5 | 177.8 | 7.00 | Javier 2004 | Walnut Creek | [18] |
| 6 | 166.9 | 6.57 | Newton 2016 | Rincon Mountains | [19] |
| 7 | 158.8 | 6.25 | Norbert 2014 | Tempe 3.1 WSW | [1] |
| 8 | 133.9 | 5.27 | Lester 1992 | Irving | [18] |
| 9 | 100.1 | 3.94 | TD Sixteen-E 2015 | Dan Saddle | [20] |
| 10 | 96.0 | 3.78 | Raymond 1989 | Santa Rita Experiment Range | [18] |
Arkansas[]
Although having weakened significantly by the time it reached the state, the slow movement of Hurricane Barry over Arkansas led to a widespread and significant flooding event. Murfreesboro saw the greatest rainfall accumulation at 14.58 inches (370.3 mm), which is the highest total ever recorded from a tropical cyclone in the state of Arkansas.[21]
| Precipitation | Storm | Location | Ref. | ||
|---|---|---|---|---|---|
| Rank | mm | in | |||
| 1 | 421.4 | 16.59 | Barry 2019 | Dierks | [21] |
| 2 | 353.3 | 13.91 | Allison 1989 | Portland | [9] |
| 3 | 349.8 | 13.77 | Bertha 1957 | Damascus 2 NNE | [22] |
| 4 | 298.5 | 11.75 | Bonnie 1986 | El Dorado Regional AP | [9] |
| 5 | 298.2 | 11.74 | Gustav 2008 | Eudora/Bayou Macon | [23] |
| 6 | 286.8 | 11.29 | Isaac 2012 | White Hall 0.8 SE | [24] |
| 7 | 283.5 | 11.16 | Unnamed 1960 | Clarendon | [9] |
| 8 | 265.4 | 10.45 | Frances 1998 | Sparkman | [9] |
| 9 | 253.0 | 9.96 | Harvey 2017 | Watson 9 N | [25] |
| 10 | 248.9 | 9.80 | Hurricane Two, 1942 | Springbank | [10] |
California[]
One of five known eastern Pacific tropical cyclones to bring tropical storm-force winds to the Southwest,[26] Hurricane Kathleen accelerated northward ahead of an upper-level trough, spreading heavy rains into the transverse ranges of southern California.[27]

| Precipitation | Storm | Location | Ref. | ||
|---|---|---|---|---|---|
| Rank | mm | in | |||
| 1 | 374.9 | 14.76 | Kathleen 1976 | San Gorgonio | [18] |
| 2 | 294.6 | 11.60 | 1939 California tropical storm | Mount Wilson | [28] |
| 3 | 189.2 | 7.45 | Doreen 1977 | Mount San Jacinto | [18] |
| 4 | 182.6 | 7.19 | Olivia 1982 | Grant Grove | [18] |
| 5 | 178.1 | 7.01 | Norman 1978 | Lodgepole | [18] |
| 6 | 152.4 | 6.00 | Dolores 2015 | Desert Center | [28] |
| 7 | 88.1 | 3.47 | Nora 1997 | Beaumont 1 E | [18] |
| 8 | 76.5 | 3.01 | Isis 1998 | Balch Power House | [18] |
| 9 | 60.7 | 2.39 | Linda 2015 | Los Angeles | [29] |
| 10 | 55.1 | 2.17 | Ignacio 1997 | Three Peaks | [1] |
Colorado[]
Few tropical cyclone remnants originating from the eastern Pacific make it as far north as Colorado. Javier dropped locally heavy rainfall exceeding 4 inches (100 mm) over the higher terrain of western Colorado in 2004.[18]

| Precipitation | Storm | Location | Ref. | ||
|---|---|---|---|---|---|
| Rank | mm | in | |||
| 1 | 135.9 | 5.35 | Lester 1992 | Wolf Creek Pass 1 E | [18] |
| 2 | 109.2 | 4.30 | Javier 2004 | Beartown | [18] |
| 3 | 68.6 | 2.70 | Blanca 2015 | Paonia 15 NW | [18] |
| 4 | 48.3 | 1.90 | Dolly 2008 | Her | [18] |
Connecticut[]
While Hurricane Diane is the wettest known tropical cyclone to impact New England, the 1938 New England hurricane produced the most rain in the state of Connecticut.[1] Nonetheless, the flood from Hurricane Diane led to a significant death toll (nearly 200) from Pennsylvania eastward through southern New England.[30]

| Precipitation | Storm | Location | Ref. | ||
|---|---|---|---|---|---|
| Rank | mm | in | |||
| 1 | 434.3 | 17.10 | 1938 New England hurricane | Buck | [10] |
| 2 | 428.2 | 16.86 | Diane 1955 | Torrington #2 | [31] |
| 3 | 338.3 | 13.32 | Eloise 1975 | Mount Carmel | [31] |
| 4 | 289.6 | 11.40 | Floyd 1999 | West Hartford | [31] |
| 5 | 257.8 | 10.15 | Irene 2011 | New Hartford | [32] |
| 6 | 240.8 | 9.48 | Connie 1955 | Round Pond | [31] |
| 7 | 185.9 | 7.34 | Donna 1960 | Wolcott Reservoir | [31] |
| 8 | 176.5 | 6.95 | Ida 2021 | Middletown | [33] |
| 9 | 162.3 | 6.39 | Lee 2011 | Danbury | [34] |
| 10 | 158.0 | 6.22 | Bob 1991 | Norwich Public Utility Plant | [31] |
Delaware[]

A large swath of heavy rainfall spread associated with a predecessor rainfall event fell before 1933 Chesapeake–Potomac hurricane arrived in Delaware. Over four days, a total of 13.24 inches (336 mm) of rain fell in Bridgeville, the most known associated with a tropical cyclone anywhere in Delaware.[10]
| Precipitation | Storm | Location | Ref. | ||
|---|---|---|---|---|---|
| Rank | mm | in | |||
| 1 | 278.9 | 10.98 | Sandy 2012 | Indian River Inlet | [35] |
| 2 | 268.7 | 10.58 | Floyd 1999 | Greenwood 2 NE | [35] |
| 3 | 264.9 | 10.43 | Irene 2011 | Ellendale | [32] |
| 4 | 207.8 | 8.18 | Connie 1955 | Newark University Farm | [35] |
| 5 | 195.6 | 7.70 | Donna 1960 | Bridgeville 1 NW | [35] |
| 6 | 193.0 | 7.60 | Agnes 1972 | Middletown 3 E | [35] |
| 7 | 181.1 | 7.13 | Danny 1985 | Lewes | [35] |
| 8 | 175.7 | 6.90 | 1933 Chesapeake–Potomac hurricane | Bridgeville | [35] |
| 9 | 174.5 | 6.87 | Allison 1989 | Wilmington New Castle | [35] |
| 10 | 158.0 | 6.22 | 1944 Great Atlantic hurricane | Millsboro | [35] |
Florida[]
The heaviest rainfall to occur in 24 hours was measured in Yankeetown during Hurricane Easy in 1950, which caused 38.70 inches (983 mm) of precipitation. This is also the highest known point storm total maximum related to any tropical cyclone which has impacted Florida,[1] and by itself would be the highest known rainfall total for any month, or any 24 hour period, from any location within Florida. This rainfall amount remained the national 24-hour rainfall record until Tropical Storm Claudette's landfall in 1979.[36]

| Precipitation | Storm | Location | Ref. | ||
|---|---|---|---|---|---|
| Rank | mm | in | |||
| 1 | 1148.1 | 45.20 | Easy 1950 | Yankeetown | [37] |
| 2 | 976.9 | 38.46 | Georges 1998 | Munson | [37] |
| 3 | 889.0 | 35.00 | October Hurricane 1941 | Trenton | [38] |
| 4 | 762.0 | 30.00 | Sally 2020 | Pensacola | [39] |
| 5 | 731.0 | 28.78 | Debby 2012 | Curtis Mill | [37] |
| 6 | 702.3 | 27.65 | Fay 2008 | Melbourne/Windover Farms | [37] |
| 7 | 649.2 | 25.56 | Dennis 1981 | Homestead/Ira Ebersole | [37] |
| 8 | 635.0 | 25.00 | TD 1, 1992 | Arcadia Tower | [37] |
| 9 | 634.5 | 24.98 | Jeanne 1980 | Key West International Airport | [37] |
| 10 | 622.2 | 24.50 | July 1916 Hurricane | Bonifay | [10] |
Georgia[]
Tropical Storm Alberto in 1994 looped across central Georgia, leading to 24-hour rainfall amounts exceeding 20 inches (510 mm) across central sections of the state.[40] It also became the wettest tropical cyclone on record for the state of Georgia, eclipsing the record set in 1929.[41]

| Precipitation | Storm | Location | Ref. | ||
|---|---|---|---|---|---|
| Rank | mm | in | |||
| 1 | 707.4 | 27.85 | Alberto 1994 | Americus | [40] |
| 2 | 621.3 | 24.46 | 1929 Florida Hurricane | Washington | [41] |
| 3 | 558.8 | 22.00 | T. D. #29 1969 | Attapulgus Mine | [42] |
| 4 | 541.0 | 21.30 | Fay 2008 | Thomasville 5 WNW | [42] |
| 5 | 508.0 | 20.00 | 1929 Bahamas hurricane | Glenville | [10] |
| 6 | 505.2 | 19.89 | Marco 1990 | Louisville 1E | [1] |
| 7 | 444.0 | 17.48 | Matthew 2016 | Savannah Hunter Field | [43] |
| 8 | 412.5 | 16.24 | Easy 1950 | Savannah Hunter Field | [42] |
| 9 | 395.2 | 15.56 | Hanna 2002 | Donalsonville | [1] |
| 10 | 367.8 | 14.48 | Tammy 2005 | Darien | [1] |
Guam[]
Super Typhoon Pamela was not only a wet tropical cyclone for the island of Guam, but a destructive one as well. Since Pamela, wooden structures across Guam have been largely replaced by concrete structures in order to better weather typhoons.[44][45]

| Precipitation | Storm | Location | Ref. | ||
|---|---|---|---|---|---|
| Rank | mm | in | |||
| 1 | 856.0 | 33.70 | Pamela 1976 | Guam WSMO | [1] |
| 2 | 846.8 | 33.34 | Alice 1953 | Andersen Air Force Base | [1] |
| 3 | 840.5 | 33.09 | Unnamed 1924 | Guam WSMO | [46] |
| 4 | 650.5 | 25.61 | Pongsona 2002 | University of Guam | [47][48] |
| 5 | 610.4 | 24.03 | Tingting 2004 | Inarajan Agricultural Station | [1] |
| 6 | 539.5 | 21.24 | Paka 1997 | Guam WSMO | [1] |
| 7 | 533.0 | 21.00 | Chataan 2002 | South-central Guam | [49] |
| 8 | 519.2 | 20.44 | Omar 1992 | Guam WSMO | [1] |
| 9 | 423.9 | 16.69 | Halong 2014 | Andersen Air Force Base | [50] |
| 10 | 414.5 | 16.32 | Ida 1969 | Andersen Air Force Base | [1] |
Hawaii[]

This island state frequently sees rainfall from the remains of former eastern and central Pacific tropical cyclones. However, despite Hawaii's location in the subtropics, direct impacts by tropical cyclones are infrequent due to the protective influence of the Central Pacific tropical upper tropospheric trough (TUTT), which normally dissipates systems approaching Hawaii. Hurricane Hiki in 1950 led to significant rainfall in the mountains, with 52 inches (1,300 mm) of rainfall reported.[3] This was the most rainfall reported to have been produced by a tropical cyclone within the United States until surpassed by Hurricane Harvey in 2017.[1]
| Precipitation | Storm | Location | Ref. | ||
|---|---|---|---|---|---|
| Rank | mm | in | |||
| 1 | 1473 | 58.00 | Lane 2018 | Kahūnā Falls, Hawaii | [51] |
| 2 | 1321 | 52.00 | Hiki 1950 | Kanalohuluhulu Ranger Station | [52] |
| 3 | 985 | 38.76 | Paul 2000 | Kapapala Ranch 36 | [53] |
| 4 | 635 | 25.00 | Maggie 1970 | Various stations | [54] |
| 5 | 519 | 20.42 | Nina 1957 | Wainiha | [55] |
| 6 | 516 | 20.33 | Iwa 1982 | Intake Wainiha 1086 | [1] |
| 7 | 476 | 18.75 | Fabio 1988 | Papaikou Mauka 140.1 | [1] |
| 8 | 387 | 15.25 | Iselle 2014 | Kulani NWR | [56] |
| 9 | 381 | 15.00 | One-C 1994 | Waiakea Uka, Piihonua | [57] |
| 10 | 372 | 14.63 | Felicia 2009 | Oahu Forecast National Wildlife Refuge | [58] |
Idaho[]
Impacts from tropical cyclones in the Pacific Northwest are rare. Most recently, the remains of Olivia moved through the region in 1982, spurring spotty moderate to heavy rainfall across Idaho.[18]

| Precipitation | Storm | Location | Ref. | ||
|---|---|---|---|---|---|
| Rank | mm | in | |||
| 1 | 52.1 | 2.051 | Kathleen 1976 | Ketchum RS | [18] |
| 2 | 50.5 | 1.988 | Olivia 1982 | Powell | [18] |
Illinois[]
Hurricane Audrey directed moisture up to a front to its north across the Midwest during late June 1957 as it transitioned into an extratropical cyclone. Heavy rains fell across central Illinois, leading to the wettest known event to be associated with a tropical cyclone or its remnants across Illinois.[59] More recently, the remnants of Hurricane Ike brought heavy flooding to the Chicago area in September 2008.[60]
| Precipitation | Storm | Location | Ref. | ||
|---|---|---|---|---|---|
| Rank | mm | in | |||
| 1 | 259.1 | 10.20 | Audrey 1957 | Paris | [61] |
| 2 | 209.6 | 8.25 | Ike 2008 | Elburn | [61] |
| 3 | 207.8 | 8.18 | Carla 1961 | Mount Carroll | [61] |
| 4 | 108.5 | 7.64 | Claudette 1979 | Hutsonville Power Station | [61] |
| 5 | 192.5 | 7.58 | Paine 1986 | Avon 5 NE | [61] |
| 6 | 178.6 | 7.03 | Tico 1983 | New Athenas | [61] |
| 7 | 156.5 | 6.16 | Hermine 2010 | Grand Chain | [61] |
| 8 | 152.7 | 6.01 | Alberto 2018 | Glencoe 0.1 NW | [62] |
| 9 | 151.4 | 5.96 | Lester 1992 | Mattoon | [61] |
| 10 | 146.1 | 5.75 | Chantal 1989 | Fulton Dam 13 | [61] |
Indiana[]
Indiana experienced its wettest tropical cyclone in 2008 with the arrival of Hurricane Ike. In 1979, Hurricane Bob produced considerable flooding in the state.[63]

| Precipitation | Storm | Location | Ref. | ||
|---|---|---|---|---|---|
| Rank | mm | in | |||
| 1 | 236.2 | 9.30 | Ike 2008 | South Bend 2.7 ESE | [61] |
| 2 | 225.3 | 8.87 | Audrey 1957 | Rockville | [61] |
| 3 | 209.8 | 8.26 | Tico 1983 | Seymour 2 N | [61] |
| 4 | 174.2 | 6.86 | Isidore 2002 | Lexington 3 N | [61] |
| 5 | 170.7 | 6.72 | Bill 2015 | Grissom AFB | [64] |
| 6 | 162.6 | 6.40 | Cindy 2017 | Albany | [65] |
| 7 | 162.6 | 6.40 | Erin 1995 | North Vernon 1 NW | [61] |
| 8 | 146.6 | 5.77 | Claudette 1979 | Jasper | [61] |
| 9 | 145.3 | 5.72 | Bob 1979 | Edwardsport Power Plant | [61] |
| 10 | 131.1 | 5.16 | Katrina 2005 | Hanover Radio | [61] |
Iowa[]
Hurricane Carla was a large hurricane that moved into Texas during September 1961. As it transitioned into an extratropical cyclone across the Great Plains and Midwest, heavy rain fell in a band on the poleward side of a frontal boundary extending northeast from Carla, leading to the wettest known event to be associated with a tropical cyclone or its remains across Iowa.[61]

| Precipitation | Storm | Location | Ref. | ||
|---|---|---|---|---|---|
| Rank | mm | in | |||
| 1 | 229.4 | 9.03 | Carla 1961 | Chariton 1 E | [61] |
| 2 | 124.5 | 4.90 | Frances 1998 | Fort Madison | [61] |
| 3 | 120.9 | 4.76 | Paine 1986 | Keokuk Lock Dam 19 | [61] |
| 4 | 99.8 | 3.93 | Waldo 1985 | Keosauqua | [61] |
| 5 | 94.0 | 3.70 | Newton 1986 | Mount Pleasant 1 SSW | [61] |
| 6 | 86.4 | 3.40 | Chantal 1989 | De Witt | [61] |
| 7 | 84.3 | 3.32 | Lester 1992 | Sigourney | [61] |
| 8 | 82.3 | 3.24 | Gustav 2008 | Rathbun Dam 2 N | [61] |
| 9 | 79.0 | 3.11 | Tico 1983 | Centerville | [61] |
| 10 | 60.7 | 2.39 | Juan 1985 | Bellevue Lock and Dam 12 | [61] |
Kansas[]
Heavy rainfall from Tropical Storm Frances fell from the western Gulf Coast northward into the Great Plains. Spreading across portions of Kansas, precipitation included with localized amounts above 12 inches (300 mm).[61]
| Precipitation | Storm | Location | Ref. | ||
|---|---|---|---|---|---|
| Rank | mm | in | |||
| 1 | 317.5 | 12.50 | Frances 1998 | Fort Scott | [61] |
| 2 | 288.3 | 11.35 | Paine 1986 | Fort Scott | [61] |
| 3 | 216.4 | 8.52 | Carla 1961 | Haddam | [61] |
| 4 | 170.4 | 6.71 | Tico 1983 | Independence | [61] |
| 5 | 147.1 | 5.79 | Newton 1986 | Tonganoxie 5 SE | [61] |
| 6 | 138.4 | 5.45 | Waldo 1985 | Burns | [61] |
| 7 | 127.0 | 5.00 | Gilbert 1988 | Cedar Vale | [61] |
| 8 | 117.6 | 4.63 | Norma 1981 | Iola 1 W | [61] |
| 9 | 114.6 | 4.51 | Matthew 2004 | Hale | [61] |
| 10 | 104.4 | 4.11 | Gustav 2008 | Pittsburg | [61] |
Kentucky[]
Soon after moving inland, the 1960 Texas tropical storm looped over South Texas, leading to heavy rains along the coastal plain near Port Lavaca. As it moved north-northeast, bursts of heavy rainfall were accompanied with the system over Arkansas and Kentucky. The maximum in Kentucky not only represents their highest tropical cyclone-related rainfall amount on record, but also the state's all-time 24 hour precipitation record (through 1998).[66]

| Precipitation | Storm | Location | Ref. | ||
|---|---|---|---|---|---|
| Rank | mm | in | |||
| 1 | 285.8 | 11.25 | Unnamed 1960 | Dunmor | [61] |
| 2 | 242.1 | 9.53 | Dennis 2005 | [67] | |
| 3 | 224.0 | 8.82 | Harvey 2017 | Brownsville Green River | [25] |
| 4 | 207.5 | 8.17 | Isidore 2002 | Paradise Steam Plant | [61] |
| 5 | 205.2 | 8.08 | Elena 1985 | WPSD-TV Paducah | [61] |
| 6 | 201.7 | 7.94 | Katrina 2005 | Finney | [61] |
| 7 | 195.8 | 7.71 | Tico 1983 | Lloyd Greenup Dam | [61] |
| 8 | 193.0 | 7.60 | Frederic 1979 | Aberdeen | [61] |
| 9 | 172.5 | 6.79 | Chris 1982 | Franklin 1 E | [61] |
| 10 | 170.4 | 6.71 | Jerry 1989 | Gray Hawk | [61] |
Louisiana[]
Heavy rains and flooding are the primary problem associated with tropical cyclones across the Pelican State. Recent examples of flooding across the state from tropical cyclones include Tropical Storm Allison in 2001, Tropical Storm Frances in 1998, Tropical Storm Allison in 1989, and Tropical Storm Claudette in 1979. Three of the four systems stalled across eastern Texas, prolonging the rainfall which occurred over Louisiana. If it were not for the intermittent invasions from tropical cyclones, rainfall during the months of August, September, and October would average about 25% less than it currently does.[68]

| Precipitation | Storm | Location | Ref. | ||
|---|---|---|---|---|---|
| Rank | mm | in | |||
| 1 | 952.2 | 37.50 | Unnamed 1940 | Miller Island | [10] |
| 2 | 760.0 | 29.92 | Allison 2001 | Thibodaux | [9] |
| 3 | 652.0 | 25.67 | Allison 1989 | Winnfield | [9] |
| 4 | 595.1 | 23.43 | Barry 2019 | Ragley | [69] |
| 5 | 568.7 | 22.39 | Frances 1998 | Terrytown | [9] |
| 6 | 565.4 | 22.25 | Harvey 2017 | [25] | |
| 7 | 541.0 | 21.30 | Unnamed 1933 | Logansport | [10] |
| 8 | 533.4 | 21.00 | Gustav 2008 | Larto Lake | [9] |
| 9 | 524.8 | 20.66 | Isaac 2012 | New Orleans Carrollton | [24] |
| 10 | 497.8 | 19.60 | Tropical Storm Four 1908 | Franklin | [10] |
Maine[]
The combined impact from a Nor'easter just one day before Daisy hit, and Hurricane Daisy, caused severe flooding in Maine, when rain fell for 65 consecutive hours in some locations. Rainfall from the two systems caused record rainfall in some areas in Maine.[70][71] Flooding caused by Hurricane Irene's heavy rainfall washed out two bridges on State Route 27 in Carrabassett Valley.[72]

| Precipitation | Storm | Location | Ref. | ||
|---|---|---|---|---|---|
| Rank | mm | in | |||
| 1 | 251.7 | 9.91 | Irene 2011 | St. Baxter Park | [32] |
| 2 | 240.5 | 9.47 | Daisy 1962 | Portland Int'l Jetport | [31] |
| 3 | 221.5 | 8.72 | Floyd 1999 | Poland | [31] |
| 4 | 209.8 | 8.26 | Donna 1960 | Sanford 2 NNW | [31] |
| 5 | 209.3 | 8.24 | Bob 1991 | Portland Int'l Jetport | [31] |
| 6 | 193.9 | 7.61 | Hanna 2008 | Bar Harbour | [31] |
| 7 | 164.6 | 6.48 | Arthur 2014 | Whiting 3 NNE | [73] |
| 8 | 148.6 | 5.85 | Belle 1976 | Brunswick | [31] |
| 9 | 141.2 | 5.56 | Gerda 1969 | Saco | [31] |
| 10 | 133.4 | 5.25 | Bertha 1996 | West Rockport 1 NNW | [31] |
Maryland[]
Eloise's remnants brought great moisture to the Northeast third of the United States in the combination of warm, tropical air and cold air from a cold front. From Virginia through New Jersey, 5 inches (130 mm) of rain were reported, while New York and Pennsylvania experienced 10 inches (250 mm). Westminster, Maryland received the maximum amount from the storm in this region with a total of 14.23 inches (361 mm).[74] The 1935 Labor Day hurricane holds the record for producing the most rainfall in Maryland.[10]

| Precipitation | Storm | Location | Ref. | ||
|---|---|---|---|---|---|
| Rank | mm | in | |||
| 1 | 424.2 | 16.70 | Labor Day 1935 hurricane | Easton | [10] |
| 2 | 361.4 | 14.23 | Eloise 1975 | Westminster 2 SSE | [74] |
| 3 | 346.2 | 13.63 | Lee 2011 | Waldorf 3.6 SSE | [34] |
| 4 | 344.4 | 13.56 | Agnes 1972 | Westminster 2 SSE | [35] |
| 5 | 337.8 | 13.30 | First August 1928 hurricane | Cheltenham | [10] |
| 6 | 329.2 | 12.96 | Irene 2011 | Plum Point | [32] |
| 7 | 318.8 | 12.83 | Sandy 2012 | Belleview | [1] |
| 8 | 319.8 | 12.59 | Floyd 1999 | Chestertown | [35] |
| 9 | 312.9 | 12.32 | Connie 1955 | Preston 1 S | [35] |
| 10 | 238.8 | 9.40 | David 1979 | Catoctin Mountain Park | [35] |
Massachusetts[]
The wettest known tropical cyclone to impact New England is also the wettest known for the state of Massachusetts.[1] The flood from Hurricane Diane led to a significant death toll (nearly 200) from Pennsylvania eastward through southern New England.[30]

| Precipitation | Storm | Location | Ref. | ||
|---|---|---|---|---|---|
| Rank | mm | in | |||
| 1 | 501.7 | 19.75 | Diane 1955 | Westfield | [10] |
| 2 | 324.4 | 12.77 | New England Hurricane of 1938 | Gardner | [1] |
| 3 | 317.5 | 12.50 | Carrie 1972 | Tashmoo | [31] |
| 4 | 312.4 | 12.3 | 1933 Outer Banks hurricane | Provincetown | [10] |
| 5 | 251.0 | 9.88 | Eloise 1975 | Westfield | [31] |
| 6 | 241.3 | 9.50 | Ida 2021 | New Bedford | [33] |
| 7 | 236.7 | 9.32 | Connie 1955 | Plainfield | [31] |
| 8 | 231.65 | 9.12 | Esther 1961 | Ashland | [31] |
| 9 | 231.1 | 9.10 | Irene 2011 | Savoy | [32] |
| 10 | 214.1 | 8.43 | Jeanne 2004 | Nantucket | [31] |
Michigan[]
In 1961, Hurricane Carla generated more precipitation in Michigan than any other tropical cyclone has ever generated in the state. Carla is also the wettest tropical cyclone to have hit Iowa, Nebraska, and Wisconsin.[61]

| Precipitation | Storm | Location | Ref. | ||
|---|---|---|---|---|---|
| Rank | mm | in | |||
| 1 | 154.2 | 6.07 | Carla 1961 | Boyne Falls | [61] |
| 2 | 136.4 | 5.37 | Chantal 1989 | Kent City 2 SW | [61] |
| 3 | 127.5 | 5.02 | Newton 1986 | South Haven | [61] |
| 4 | 115.8 | 4.56 | Juan 1985 | Escanaba | [61] |
| 5 | 105.2 | 4.14 | Opal 1995 | Grosse Pointe Farms | [61] |
| 6 | 103.4 | 4.07 | Fran 1996 | Port Huron | [61] |
| 7 | 101.1 | 3.98 | Gustav 2008 | Sparta 2 SW | [61] |
| 8 | 90.7 | 3.57 | Alberto 2018 | Luzerne 2.4 NE | [62] |
| 9 | 85.9 | 3.38 | Frances 1998 | Kenton | [61] |
| 10 | 78.0 | 3.07 | Arlene 2005 | Hastings | [61] |
| 10 | 78.0 | 3.07 | Gilbert 1988 | Charlotte 3 S | [61] |
Minnesota[]
Few tropical cyclone remnants originating from the eastern Pacific or Atlantic Basins make it as far north as Minnesota. Most recently, 2020's Tropical Storm Cristobal dropped heavy rainfall exceeding 5 inches (130 mm) in localized spots.[61]

| Precipitation | Storm | Location | Ref. | ||
|---|---|---|---|---|---|
| Rank | mm | in | |||
| 1 | 128.5 | 5.06 | Cristobal 2020 | Whalan 1 NE | [75] |
| 2 | 97.3 | 3.83 | Lester 1992 | Indus 3 W | [61] |
| 3 | 52.8 | 2.08 | Javier 2004 | Bemidji Municipal AP | [61] |
| 4 | 41.9 | 1.65 | Alicia 1983 | Montgomery | [61] |
| 5 | 38.1 | 1.50 | Newton 1986 | Beaver | [61] |
Mississippi[]
Hurricane Georges stalled over the southern portion of the state, it produced torrential rainfall, exceeding 30 inches (760 mm) locally.[76] The heavy rainfall contributed to significant river overflowing, including the Tchoutacabouffa River at D'Iberville, which set a record crest of 19 feet (5.8 m).[77]

| Precipitation | Storm | Location | Ref. | ||
|---|---|---|---|---|---|
| Rank | mm | in | |||
| 1 | 818.1 | 32.21 | Georges 1998 | Wiggins 5 W | [67] |
| 2 | 678.4 | 26.71 | Isaac 2012 | Pascagoula | [1] |
| 3 | 535.0 | 21.06 | Unnamed 1987 | [1] | |
| 4 | 481.3 | 18.95 | Allison 2001 | Liberty 5 W | [9] |
| 5 | 388.1 | 15.28 | Claudette 2021 | Gulfport 6 NW | [78] |
| 6 | 364.0 | 14.33 | Gustav 2008 | Chatham | [9] |
| 7 | 346.7 | 13.65 | Cristobal 2020 | Caesar | [79] |
| 8 | 344.2 | 13.55 | Lee 2011 | Waveland | [9] |
| 9 | 333.5 | 13.13 | Isidore 2002 | Poplarville Experimental Stn 5 W | [9] |
| 10 | 333.2 | 13.12 | Ida 2021 | Bay St. Louis 1.4 WSW | [33] |
Missouri[]
Remnant tropical cyclones can move into the state which originate in either the Pacific or Atlantic hurricane basins. Tropical Storm Erin reintensified over Oklahoma leading to heavy rainfall in that state. As the system moved eastward, its surface low quickly dissipated. However, its mid-level circulation remained robust, leading to a burst of heavy rainfall across Missouri exceeding 10 inches (250 mm) in isolated spots, which became the wettest tropical cyclone remnant on record for the state.[35][80]

| Precipitation | Storm | Location | Ref. | ||
|---|---|---|---|---|---|
| Rank | mm | in | |||
| 1 | 302.8 | 11.94 | Erin 2007 | Miller | [67] |
| 2 | 291.6 | 11.48 | Bertha 1957 | Kennett | [22] |
| 3 | 258.1 | 10.16 | Audrey 1957 | Hermann | [35] |
| 4 | 249.4 | 9.82 | Paine 1986 | Truman Dam & Reservoir | [35] |
| 5 | 237.2 | 9.34 | Carla 1961 | Condordia | [35] |
| 6 | 231.1 | 9.10 | Frances 1998 | Odessa 4 SE | [35] |
| 7 | 230.1 | 9.06 | Gustav 2008 | Alley Spring/Jack Fork | [35] |
| 8 | 209.6 | 8.25 | Bill 2015 | Fordland 4 WNW | [64] |
| 9 | 186.7 | 7.35 | Tico 1983 | Appleton City | [35] |
| 10 | 168.4 | 6.63 | Waldo 1985 | Polo | [35] |
Montana[]
It is rare for tropical cyclone remnants originating from the eastern Pacific or Atlantic Basins to make it as far north as Montana. The remains of Kathleen dropped locally heavy rainfall approaching 2 inches (51 mm) in localized spots.[18]

| Precipitation | Storm | Location | Ref. | ||
|---|---|---|---|---|---|
| Rank | mm | in | |||
| 1 | 48.0 | 1.89 | Kathleen 1976 | Lakeview | [18] |
Nebraska[]
The wettest known event in Nebraska to be associated with a tropical cyclone or its remains was Hurricane Carla. Carla resulted in the heaviest known rainfall in several other states as well.[61]
| Precipitation | Storm | Location | Ref. | ||
|---|---|---|---|---|---|
| Rank | mm | in | |||
| 1 | 144.3 | 5.68 | Carla 1961 | Hubbrell | [61] |
| 2 | 132.1 | 5.20 | Lester 1992 | Arnold | [61] |
| 3 | 69.3 | 2.73 | Alicia 1983 | Miller | [61] |
| 4 | 49.0 | 1.93 | Tico 1983 | Beemer | [61] |
| 5 | 46.7 | 1.84 | Javier 2004 | Ainsworth Municipal AP | [61] |
| 6 | 44.5 | 1.75 | Waldo 1985 | Falls City Brenner AP | [61] |
| 7 | 23.6 | 0.93 | Newton 1986 | Lyman | [61] |
Nevada[]
Every few years, Nevada is impacted by eastern Pacific tropical cyclones, or their remnants. The wettest known event for the state was during Hurricane Doreen, when over 4 inches (100 mm) fell in isolated spots.[18]

| Precipitation | Storm | Location | Ref. | ||
|---|---|---|---|---|---|
| Rank | mm | in | |||
| 1 | 105.2 | 4.14 | Doreen 1977 | Adaven | [18] |
| 2 | 89.4 | 3.52 | Olivia 1982 | Ely Yelland Field | [18] |
| 3 | 86.4 | 3.40 | Kathleen 1976 | Searchlight | [18] |
| 4 | 73.7 | 2.90 | Norman 1978 | Adaven | [18] |
| 5 | 50.8 | 2.00 | Boris 1990 | Lund | [18] |
| 6 | 36.1 | 1.42 | Nora 1997 | Valley of Fire State Park | [18] |
| 7 | 32.8 | 1.29 | Isis 1998 | Goldfield | [18] |
| 8 | 5.3 | 0.21 | Lester 1992 | Montello 2 SE | [18] |
New Hampshire[]
A large swath of heavy rainfall spread up the East Coast along a frontal zone draping over the northern side of Hurricane Floyd.[81] Nearly 10 inches (250 mm) fell across portions of New Hampshire, the most recorded during the passage of a tropical cyclone or its remnants.[31]

| Precipitation | Storm | Location | Ref. | ||
|---|---|---|---|---|---|
| Rank | mm | in | |||
| 1 | 242.3 | 9.54 | Floyd 1999 | Mount Washington | [31] |
| 2 | 189.7 | 7.47 | Bertha 1996 | Mount Washington | [31] |
| 3 | 189.5 | 7.46 | Bob 1991 | Mount Washington | [31] |
| 4 | 186.1 | 7.33 | Irene 2011 | Pinkham Notch | [32] |
| 5 | 184.2 | 7.25 | Donna 1960 | Macdowell Dam | [31] |
| 6 | 182.4 | 7.18 | Connie 1955 | Newport | [31] |
| 7 | 168.7 | 6.64 | Lee 2011 | Keene 1.7 WSW | [34] |
| 8 | 165.9 | 6.53 | Eloise 1975 | Greenville 2 NNE | [31] |
| 9 | 153.7 | 6.05 | Sandy 2012 | Randolph 1.4 NE | [82] |
| 10 | 153.2 | 6.03 | Gloria 1985 | Mount Washington | [31] |
New Jersey[]
A large swath of heavy rainfall spread up the East Coast along a frontal zone draping over the northern side of Hurricane Floyd.[81] Hurricane Four of the September 1940 hurricane season holds the record for the wettest tropical cyclone in New Jersey.[10]

| Precipitation | Storm | Location | Ref. | ||
|---|---|---|---|---|---|
| Rank | mm | in | |||
| 1 | 609.6 | 24.00 | September 1940 hurricane | Ewan | [10] |
| 2 | 452.1 | 17.80 | August 19, 1939 | Manahawkin, New Jersey | [10] |
| 3 | 363.2 | 14.30 | Henri 2021 | Concordia | [83] |
| 4 | 358.9 | 14.13 | Floyd 1999 | Little Falls | [35][67] |
| 5 | 304.3 | 11.98 | 1944 Great Atlantic hurricane | New Brunswick Experimental Station | [1][35] |
| 6 | 302.5 | 11.91 | Sandy 2012 | Wildwood Crest 0.6 NNE | [82] |
| 7 | 291.6 | 11.48 | Connie 1955 | Canistear Reservoir | [35] |
| 8 | 286.3 | 11.27 | Irene 2011 | Freehold Township | [32] |
| 9 | 267.0 | 10.51 | Eloise 1975 | New Brunswick 3 SE | [35] |
| 10 | 261.4 | 10.29 | Doria 1971 | [1][35] | |
New Mexico[]
Tropical cyclones, and their remnants, move into New Mexico from both the eastern Pacific and Atlantic basins. Although Atlantic Basin tropical cyclones are more unusual events, the rainfall record for New Mexico was from a tropical depression which moved across Texas from the Gulf of Mexico in October 1954.[18]

| Precipitation | Storm | Location | Ref. | ||
|---|---|---|---|---|---|
| Rank | mm | in | |||
| 1 | 248.9 | 9.80 | Tropical Depression (10/1954) | Canton | [18] |
| 2 | 216.7 | 8.53 | Dolly 2008 | Sunspot | [18] |
| 3 | 169.2 | 6.66 | Waldo 1985 | Hobbs | [18] |
| 4 | 134.9 | 5.31 | Octave 1983 | Luna RS | [18] |
| 5 | 87.12 | 3.43 | Newton 2016 | Texico | [84] |
| 6 | 84.84 | 3.34 | TD Sixteen-E 2015 | Mogollon | [20] |
| 7 | 80.52 | 3.17 | Heather 1977 | Yeso 2 S | [18] |
| 8 | 75.95 | 2.99 | Raymond 1989 | Red River | [18] |
| 9 | 62.99 | 2.48 | Javier 2004 | Albuquerque | [18] |
| 10 | 55.12 | 2.17 | Lester 1992 | Lindrith 1 WSW | [18] |
New York[]
Tropical cyclones moving up the East Coast bring rainfall to New York frequently. During Hurricane Connie, over 13 inches (330 mm) fell in isolated spots, which was the most rainfall recorded with a tropical cyclone or its remains across the state.[32][35]
| Precipitation | Storm | Location | Ref. | ||
|---|---|---|---|---|---|
| Rank | mm | in | |||
| 1 | 386.1 | 15.20 | Connie 1955 | Slide Mountain | [10] |
| 2 | 337.8 | 13.30 | Irene 2011 | East Durham | [32] |
| 3 | 331.2 | 12.25 | Floyd 1999 | Yorktown Heights 1 W | [35] |
| 4 | 300.5 | 11.83 | Lee 2011 | Appalachian | [34] |
| 5 | 282.2 | 11.11 | 1944 Great Atlantic hurricane | Mineola | [35] |
| 6 | 280.9 | 11.06 | Eloise 1975 | Bedford Hills | [35] |
| 7 | 250.1 | 9.85 | Henri 2021 | Brooklyn | [85] |
| 8 | 229.9 | 9.05 | Diane 1955 | Montauk | [35] |
| 9 | 226.6 | 8.92 | Ida 2021 | Staten Island | [33] |
| 10 | 222.8 | 8.77 | 1933 Chesapeake–Potomac hurricane | Honk Falls | [35] |
North Carolina[]

Heavy rains accompany tropical cyclones and their remnants which move northeast from the Gulf of Mexico coastline, as well as inland from the western subtropical Atlantic ocean. As much as 15% of the rainfall which occurs during the warm season in the Carolinas is attributable to tropical cyclones.[86] Over the past 30 years, the wettest tropical cyclone to strike the coastal plain was Hurricane Florence of September 2018, which dropped over 35 inches (890 mm) of rainfall in Elizabethtown. In the mountains, Hurricane Frances of September 2004 was the wettest, bringing over 23 inches (580 mm) of rainfall to Mount Mitchell.[42]
| Precipitation | Storm | Location | Ref. | ||
|---|---|---|---|---|---|
| Rank | mm | in | |||
| 1 | 912.6 | 35.93 | Florence 2018 | Elizabethtown | [6] |
| 2 | 611.1 | 24.06 | Floyd 1999 | Southport 5 N | [1] |
| 3 | 602.7 | 23.73 | Mid-July Hurricane 1916 | Altapass | [41] |
| 4 | 598.7 | 23.57 | Frances 2004 | Mount Mitchell | [1] |
| 5 | 524.5 | 20.65 | Mid-Aug Hurricane 1940 | Idlewild | [1] |
| 6 | 505.7 | 19.91 | Dennis 1999 | Ocracoke | [1] |
| 7 | 482.1 | 18.98 | Diana 1984 | Southport 5 N | [1] |
| 8 | 481.3 | 18.95 | Matthew 2016 | Evergreen | [43] |
| 9 | 444.5 | 17.50 | Ophelia 2005 | Oak Island Water Treatment Plant | [1] |
| 10 | 431.8 | 17.00 | Ivan 2004 | Cruso | [1] |
North Dakota[]
It is rare for tropical cyclone remnants originating from the eastern Pacific or Atlantic Basins to migrate as far north as North Dakota. The remains of Javier in 2004 dropped locally heavy rainfall exceeding 1 inch (25 mm) in localized spots.[61]

| Precipitation | Storm | Location | Ref. | ||
|---|---|---|---|---|---|
| Rank | mm | in | |||
| 1 | 34.0 | 1.34 | Javier 2004 | Homme Dam | [61] |
Northern Mariana Islands[]

The Northern Mariana Islands are an archipelago north of Guam which gets impacted by typhoons in the western Pacific from time to time. Typhoon Champi dropped 26.25 inches (667 mm) on Tinian in 2015,[87] making it the wettest known tropical cyclone for the island chain.
| Precipitation | Storm | Location | Ref. | ||
|---|---|---|---|---|---|
| Rank | mm | in | |||
| 1 | 666.8 | 26.25 | Champi 2015 | Tinian | [87] |
| 2 | 487.6 | 19.20 | Steve 1993 | Saipan | [88] |
| 3 | 241.3 | 9.50 | Seth 1991 | Saipan | [89] |
| 4 | 205.7 | 8.10 | Soulik 2006 | Pagan | [90] |
| 5 | 173.2 | 6.82 | Nabi 2005 | Saipan | [91] |
| 6 | 119.1 | 4.69 | Bavi 2015 | Tinian | [92] |
| 7 | 118.1 | 4.65 | Sanvu 2012 | Tinian | [93] |
| 8 | 90.9 | 3.58 | Kong-rey 2007 | Pagan | [94] |
| 9 | 85.8 | 3.38 | Mirinae 2009 | Rota | [95] |
| 10 | 82.5 | 3.25 | Melor 2009 | Tinian | [96] |
Ohio[]
The state of Ohio can be impacted by the remnants of both eastern Pacific and Atlantic tropical cyclones, with a bulk of the activity originating in the Gulf of Mexico. Hurricane Frederic in 1979, interacting with a nearby frontal zone,[97] brought over 8 inches (200 mm) of rainfall to isolated spots of the state, becoming the wettest known tropical cyclone, or remnant, to impact Ohio.[61]

| Precipitation | Storm | Location | Ref. | ||
|---|---|---|---|---|---|
| Rank | mm | in | |||
| 1 | 220.2 | 8.67 | Frederic 1979 | Akron 30 E | [61] |
| 2 | 216.7 | 8.53 | Ivan 2004 | Albany | [61] |
| 3 | 201.9 | 7.95 | Frances 2004 | Mount Ephraim | [61] |
| 4 | 178.8 | 7.04 | Sandy 2012 | Kirtland 0.9 SW | [61] |
| 5 | 164.3 | 6.47 | Fran 1996 | Elyria 3 E | [61] |
| 6 | 157.0 | 6.18 | Katrina 2005 | Nashville | [61] |
| 7 | 156.2 | 6.15 | Tico 1983 | Ironton 1 NE | [61] |
| 8 | 138.7 | 5.46 | Isidore 2002 | New Carlisle | [61] |
| 9 | 131.3 | 5.17 | Fred 2021 | Pickerington 6 NNW | [98] |
| 10 | 130.8 | 5.15 | Ida 2021 | Granville 5.6 N | [33] |
Oklahoma[]
Remnant tropical cyclones can move into the state which originate in either the Pacific or Atlantic hurricane basins. In 2007, Tropical Storm Erin reintensified over Oklahoma leading to heavy rainfall within the state. Rainfall exceeded 12 inches (300 mm) in isolated spots, which turned out to be the third wettest tropical cyclone remnant on record for Oklahoma.[9][80]

| Precipitation | Storm | Location | Ref. | ||
|---|---|---|---|---|---|
| Rank | mm | in | |||
| 1 | 475.2 | 18.71 | Norma 1981 | Kingston 4 SSE | [1] |
| 2 | 430.5 | 16.95 | Tico 1983 | Just south of Chickasha | [9] |
| 3 | 401.6 | 15.81 | Nineteen-E 2018 | Johnston County | [9] |
| 4 | 325.4 | 12.81 | Erin 2007 | Eakly 3 NE | [9] |
| 5 | 318.3 | 12.53 | Bill 2015 | Healdton 3 E | [64] |
| 6 | 306.6 | 12.07 | Dean 1995 | Great Salt Plains Dam | [9] |
| 7 | 279.9 | 11.02 | Frances 1998 | Valliant 3 W | [9] |
| 8 | 275.3 | 10.84 | Paine 1986 | Ponca City Municipal AP | [9] |
| 9 | 218.4 | 8.60 | Gilbert 1988 | Wichita Mountain Wildlife Refuge | [9] |
| 10 | 217.7 | 8.57 | Carmen 1974 | Flashman Tower | [9] |
Oregon[]
Impacts from tropical cyclones in the Pacific Northwest are rare.[18] Most recently, the remains of Ignacio moved through the region, spurring spotty moderate rainfall across the region.[99]

| Precipitation | Storm | Location | Ref. | ||
|---|---|---|---|---|---|
| Rank | mm | in | |||
| 1 | 34.3 | 1.35 | Kathleen 1976 | Rome 2 NW | [18] |
| 2 | 32.0 | 1.26 | Ignacio 1997 | Crater Lake NPS HQ | [18] |
Pennsylvania[]
Although Hurricane Agnes was barely a hurricane at landfall in Florida, its major impact was over the Mid-Atlantic region, where Agnes combined with a non-tropical low to produce widespread rains of 6 to 12 inches (150 to 300 mm) with local amounts up to 19 inches (480 mm) in western Schuylkill County in Pennsylvania.[1] These rains produced widespread severe flooding from Virginia northward to New York, with other flooding occurring over the western portions of the Carolinas.

| Precipitation | Storm | Location | Ref. | ||
|---|---|---|---|---|---|
| Rank | mm | in | |||
| 1 | 482.6 | 19.00 | Agnes 1972 | Western Schuylkill County | [35] |
| 2 | 395.9 | 15.59 | Lee 2011 | Elizabethtown | [34] |
| 3 | 337.3 | 13.28 | Chesapeake Potomac 1933 | York 3 SSW Pump Station | [35] |
| 4 | 308.1 | 12.13 | Floyd 1999 | Marcus Hook | [35] |
| 5 | 306.1 | 12.05 | Connie 1955 | Geigertown | [35] |
| 6 | 301.2 | 11.86 | Eloise 1975 | Harrisburg Capital City AP | [35] |
| 7 | 282.2 | 11.11 | Diane 1955 | Pecks Pond | [35] |
| 8 | 239.5 | 9.43 | Ida 2021 | Coatesville | [33] |
| 9 | 232.9 | 9.17 | Gloria 1985 | Valley Forge | [35] |
| 10 | 227.8 | 8.97 | Jeanne 2004 | West Chester 2 NW | [35] |
Puerto Rico[]
Puerto Rico has seen dramatic rainfall from tropical cyclones and their precursor disturbances. The most recent tropical cyclone-related deluge was from Hurricane Irene in August 2011, when 22.05 inches (560 mm) of rain was measured at Gurabo Abajo.[100] The heaviest rainfall noted over the past 30 years was from the precursor disturbance to Tropical Storm Isabel, when 31.67 inches (804 mm) fell at Toro Negro Forest.[101] Hurricane Eloise of 1975 dropped 33.29 inches (846 mm) of rainfall at Dos Bocas, with 23.07 inches (586 mm) falling in 24 hours.

| Precipitation | Storm | Location | Ref. | ||
|---|---|---|---|---|---|
| Rank | mm | in | |||
| 1 | 1,058.7 | 41.68 | T. D. #15 (1970) | Jayuya 1 SE | [1] |
| 2 | 962.7 | 37.90 | Maria 2017 | Caguas | [102] |
| 3 | 845.6 | 33.29 | Eloise 1975 | Dos Bocas | [1] |
| 4 | 804.4 | 31.67 | Isabel 1985 | Toro Negro Forest | [103] |
| 5 | 775.0 | 30.51 | Georges 1998 | Jayuya | [1] |
| 6 | 662.2 | 26.07 | Hazel 1954 | Toro Negro Tunnel | [104] |
| 7 | 652.5 | 25.69 | Klaus 1984 | Guavate Camp | [1] |
| 8 | 596.4 | 23.48 | Hortense 1996 | Cayey 1 NW | [1] |
| 9 | 584.2 | 23.00 | 1899 San Ciriaco hurricane | Adjuntas | [105] |
| 10 | 560.1 | 22.05 | Irene 2011 | Gurabo Abajo | [106] |
Rhode Island[]
The flood from Hurricane Diane led to a significant death toll (nearly 200) from Pennsylvania eastward through southern New England.[30]

| Precipitation | Storm | Location | Ref. | ||
|---|---|---|---|---|---|
| Rank | mm | in | |||
| 1 | 309.9 | 12.2 | Unnamed 1932 | Westerly | [10] |
| 2 | 239.5 | 9.43 | Ida 2021 | Uri Peckham Farm | [33] |
| 3 | 214.6 | 8.45 | Diane 1955 | Greenville | [31] |
| 4 | 181.1 | 7.13 | Bob 1991 | North Foster | [31] |
| 5 | 175.3 | 6.90 | Unnamed 1924 | Kingston | [10] |
| 6 | 149.9 | 5.90 | Floyd 1999 | North Foster 1 E | [31] |
| 7 | 145.8 | 5.74 | Connie 1955 | Kingston | [31] |
| 8 | 137.2 | 5.40 | Lee 2011 | Coventry Center | [34] |
| 9 | 136.4 | 5.37 | Irene 2011 | Warren | [32] |
| 10 | 133.4 | 5.25 | Allison 2001 | North Foster | [31] |
South Carolina[]
Portions of South Carolina experienced significant rainfall totals eclipsing 35 inches (890 mm) with Hurricane Florence, which became the wettest known tropical cyclone to impact the state. The flash flooding covered numerous roadways and washed out bridges. River flooding was great across the state. In addition, the rainfall broke dams, flooded houses, and covered fields.
| Precipitation | Storm | Location | Ref. | ||
|---|---|---|---|---|---|
| Rank | mm | in | |||
| 1 | 600.2 | 23.63 | Florence 2018 | Loris | [107] |
| 2 | 470.2 | 18.51 | Jerry 1995 | Antreville | [1] |
| 3 | 443.2 | 17.45 | Beryl 1994 | Jocassee 8 WNW | [1] |
| 4 | 429.3 | 16.90 | Matthew 2016 | Edisto Island | [43] |
| 5 | 407.9 | 16.06 | Floyd 1999 | Myrtle Beach Airport | [108] |
| 6 | 386.3 | 15.21 | Dorian 2019 | Pawleys Island | [41] |
| 7 | 358.4 | 14.11 | T. D. #8 1971 | Sullivans Island | [1] |
| 8 | 354.6 | 13.96 | Marco/Klaus 1990 | Pageland | [42] |
| 9 | 342.1 | 13.47 | Mid-Aug T.S. 1928 | Caesars Head | [41] |
| 10 | 329.1 | 12.96 | Fay 2020 | St. Helena | [109] |
South Dakota[]
It is rare for tropical cyclone remnants originating from the eastern Pacific or Atlantic Basins to move as far inland as South Dakota. The remains of Javier in 2004 dropped locally heavy rainfall exceeding 2 inches (51 mm) in localized spots.[61]
| Precipitation | Storm | Location | Ref. | ||
|---|---|---|---|---|---|
| Rank | mm | in | |||
| 1 | 83.6 | 3.29 | Lester 1992 | Armour | [61] |
| 2 | 71.9 | 2.83 | Javier 2004 | Gregory | [61] |
Tennessee[]
Tropical Storm Chris moved inland into the Southeast, producing a burst of rainfall across Tennessee exceeding 13 inches (330 mm).[110] This system stands as Tennessee's wettest known tropical cyclone.[42]
| Precipitation | Storm | Location | Ref. | ||
|---|---|---|---|---|---|
| Rank | mm | in | |||
| 1 | 345.4 | 13.60 | Chris 1982 | Milan | [42] |
| 2 | 332.9 | 13.11 | Lee 2011 | Charleston | [111] |
| 3 | 285.8 | 11.25 | Ivan 2004 | Soddy Daisy Mowbray Mt | [42] |
| 4 | 267.2 | 10.52 | Isidore 2002 | Big Sandy | [42] |
| 5 | 232.9 | 9.17 | Harvey 2017 | Port Royal | [25] |
| 6 | 213.1 | 8.39 | Allison 1989 | Murfreesboro 5 N | [42] |
| 7 | 185.7 | 7.31 | Gracie 1959 | Roan High Knob | [42] |
| 8 | 183.6 | 7.23 | Easy 1950 | Point Park Lookout Mountain | [42] |
| 9 | 172.5 | 6.79 | Ida 2021 | Benton 2.3 ESE | [33] |
| 10 | 172.2 | 6.78 | Dennis 2005 | Oak Ridge ATDD | [42] |
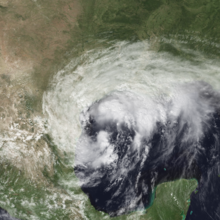
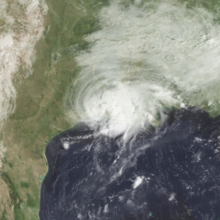
Texas[]

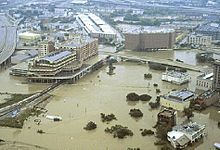
The most serious threat from tropical cyclones in Texas residents is from flooding, from both Gulf of Mexico hurricanes and tropical storms and the remnants of Eastern Pacific storms. Systems with sprawling circulations, such as Hurricane Beulah, also tend to make good rainmakers.[112] Slow moving systems, such as Tropical Storm Amelia or Hurricane Harvey also can produce significant rainfall over Texas. Harvey's storm total rainfall is the most recorded within the United States.[113][114] Harvey's extremely heavy rainfall produced catastrophic flooding across much of southeastern Texas; particularly in and around the Houston metropolitan area, where accumulations exceeded 40 in (1,000 mm) over a four-day period.[113] Tropical Storm Claudette holds the national 24-hour rainfall record for the United States, with 42 inches (1,100 mm) falling within a day.[115]
| Precipitation | Storm | Location | Ref. | ||
|---|---|---|---|---|---|
| Rank | mm | in | |||
| 1 | 1538.7 | 60.58 | Harvey 2017 | Nederland | [1] |
| 2 | 1219.2 | 48.00 | Amelia 1978 | Medina | [1] |
| 3 | 1143.0 | 45.00 | Claudette 1979 | Alvin coop site | [115] |
| 4 | 1102 | 43.39 | Imelda 2019 | North Fork Taylor Bayou | [116] |
| 5 | 1033.3 | 40.68 | Allison 2001 | Moore Road Detention Pond | [1] |
| 6 | 1008.6 | 39.71 | September Hurricane 1921 | Thrall | [10] |
| 7 | 762.0 | 30.00 | September T.S. 1936 | Broome | [10] |
| 8 | 755.9 | 29.76 | Unnamed 1960 | Port Lavaca #2 | [1] |
| 9 | 695.5 | 27.38 | Beulah 1967 | Pettus | [1] |
| 10 | 688.3 | 27.10 | Alice 1954 | Pandale | [10] |
United States Virgin Islands[]

Tropical cyclones affect these islands of the northeast Caribbean on a regular basis. Hurricane Hortense is the wettest known system for the U. S. Virgin Islands, bringing over 18 inches (460 mm) of rainfall.[117]
| Precipitation | Storm | Location | Ref. | ||
|---|---|---|---|---|---|
| Rank | mm | in | |||
| 1 | 458.0 | 18.03 | Hortense 1996 | Christiansted Hamilton Field | [117] |
| 2 | 394.5 | 15.53 | Klaus 1984 | Caneel Bay Plantation | [1] |
| 3 | 293.4 | 11.55 | David 1979 | Fredericksted Fort | [118] |
| 4 | 284.5 | 11.20 | Hugo 1989 | Ham Bluff Light House Station | [1] |
| 5 | 265.9 | 10.47 | Lenny 1999 | Granard | [1] |
| 6 | 234.2 | 9.22 | Eloise 1975 | Annaly | [1] |
| 7 | 224.0 | 8.82 | Kendra 1978 | Fredericksted Fort | [119] |
| 8 | 221.2 | 8.71 | Isabel 1985 | Annually | [1] |
| 9 | 154.4 | 6.05 | Grace 1997 | Wintberg | [1] |
| 10 | 147.0 | 5.80 | Dorian 2019 | Anna's Retreet's | [1] |
Utah[]
On occasion, Utah is impacted by the remnants of eastern Pacific tropical cyclones. The remains of Olivia moved through the region in 1982, spurring spotty moderate to heavy rainfall exceeding 7 inches (180 mm) in isolated spots.[18]
| Precipitation | Storm | Location | Ref. | ||
|---|---|---|---|---|---|
| Rank | mm | in | |||
| 1 | 188.2 | 7.41 | Olivia 1982 | Cottonwood Weir | [18] |
| 2 | 109.5 | 4.31 | Doreen 1977 | Logan 5 SW Experimental Farm | [18] |
| 3 | 61.7 | 2.43 | Javier 2004 | Monticello 15 ESE | [18] |
| 4 | 59.4 | 2.34 | Boris 1990 | Bartholomew Powerhouse | [18] |
| 5 | 56.1 | 2.21 | Nora 1997 | Enterprise | [18] |
| 6 | 48.0 | 1.89 | Lester 1992 | Cedar City and New Harmony | [18] |
| 7 | 38.6 | 1.52 | Isis 1998 | La Verkin | [18] |
| 8 | 33.8 | 1.33 | Kathleen 1976 | New Harmony | [18] |
Vermont[]
A large swath over heavy rainfall spread up the East Coast along a frontal zone draped over the northern side of Hurricane Floyd.[81] Over 11 inches (280 mm) fell across portions of Vermont, the most recorded during the passage of a tropical cyclone or its remnants within the state.[31]

| Precipitation | Storm | Location | Ref. | ||
|---|---|---|---|---|---|
| Rank | mm | in | |||
| 1 | 292.9 | 11.53 | Floyd 1999 | Mount Mansfield | [31] |
| 2 | 285.2 | 11.23 | Irene 2011 | Mendon | [32] |
| 3 | 209.8 | 8.26 | Connie 1955 | Whitingham 1 W | [31] |
| 4 | 170.2 | 6.70 | Erin 1995 | Morrisville Stowe State Park | [31] |
| 5 | 167.9 | 6.61 | Lee 2011 | Pownal | [34] |
| 6 | 160.8 | 6.33 | Donna 1960 | Somerset | [31] |
| 7 | 145.5 | 5.73 | Bertha 1996 | Dorset 2 SE | [31] |
| 8 | 126.5 | 4.98 | Chris 1988 | Vernon | [31] |
| 9 | 124.7 | 4.91 | Eloise 1975 | Vernon | [31] |
| 10 | 113.7 | 4.48 | Able 1950 | Searsburg Power Plant | [31] |
Virginia[]
Virginia has some special considerations that affect tropical cyclone-related rainfall. Mountains to the west act as a perfect mechanism for upward motion during sustained east winds, which can lead to flash flooding and landslides in that region (e.g. Hurricane Camille). As a tropical system approaches from the south, a frontal zone sets up between the moist Atlantic Ocean and the drier landmass to the west. This boundary can set up two or three days in advance of a tropical storm, and can lead up to prolonged heavy rains across coastal sections (e.g. Hurricane Floyd). As the cyclone advances north, the boundary will slowly shift west, but progresses west of a Richmond/Washington, D.C. line.[120]

| Precipitation | Storm | Location | Ref. | ||
|---|---|---|---|---|---|
| Rank | mm | in | |||
| 1 | 685.8 | 27.00 | Camille 1969 | West-Central Nelson County | [35] |
| 2 | 532.4 | 20.96 | Lee 2011 | Colonial Beach | [111] |
| 3 | 513.1 | 20.20 | Isabel 2003 | Upper Sherando | [1] |
| 4 | 480.1 | 18.9 | October 1942 T.S. | Big Meadows | [10] |
| 5 | 457.2 | 18.0 | Ida 2009 | Hampton 1.8 NW | [35] |
| 6 | 444.5 | 17.50 | Southeast hurricane 1940 | Keysville | [10] |
| 7 | 431.3 | 16.98 | Floyd 1999 | Williamsburg 2 N | [35] |
| 8 | 406.4 | 16.00 | Fran 1996 | Big Meadows | [1] |
| 9 | 364.0 | 14.33 | Cleo 1964 | Back Bay Wildlife Refuge | [1] |
| 10 | 360.9 | 14.21 | Matthew 2016 | Chesapeake | [43] |
Washington[]
Impacts from tropical cyclones in the Pacific Northwest are rare.[18] The remains of Ignacio moved through the region, spurring spotty moderate rainfall across the region.[99]
| Precipitation | Storm | Location | Ref. | ||
|---|---|---|---|---|---|
| Rank | mm | in | |||
| 1 | 18.3 | 0.72 | Ignacio 1997 | Merwin Dam | [18] |
West Virginia[]
Although Hurricane Agnes was barely a hurricane at landfall in Florida, its major impact was over the Mid-Atlantic region, where Agnes combined with a non-tropical low to produce widespread heavy rainfall, including amounts approaching 8 inches (200 mm) in isolated spots of West Virginia.[35] These rains produced widespread severe flooding from Virginia northward to New York, with other flooding occurring over the western portions of the Carolinas.

| Precipitation | Storm | Location | Ref. | ||
|---|---|---|---|---|---|
| Rank | mm | in | |||
| 1 | 201.7 | 7.94 | Agnes 1972 | Berkeley Springs | [35] |
| 2 | 180.0 | 7.09 | Lee 2011 | Mt. Storm | [111] |
| 3 | 175.3 | 6.90 | Hazel 1954 | Mathias | [35] |
| 4 | 174.5 | 6.87 | Eloise 1975 | Brushy Run | [35] |
| 5 | 152.9 | 6.02 | Frances 2004 | Berkeley Springs | [35] |
| 6 | 141.5 | 5.57 | Gracie 1959 | Wardensville RM Farm | [35] |
| 7 | 136.9 | 5.39 | Fred 2021 | Athens | [98] |
| 8 | 136.1 | 5.36 | Connie 1955 | Kearneysville | [35] |
| 9 | 128.0 | 5.04 | Camille 1969 | McRoss | [35] |
| 10 | 118.9 | 4.68 | Beryl 1994 | Richwood 1 SSE | [35] |
Wisconsin[]
Wisconsin experienced its heaviest tropical-cyclone-related rainfall in 1961 when Hurricane Carla entered the United States. Carla broke the record for highest rainfall in three other states as well.[61]

| Precipitation | Storm | Location | Ref. | ||
|---|---|---|---|---|---|
| Rank | mm | in | |||
| 1 | 192.5 | 7.58 | Carla 1961 | Brodhead | [61] |
| 2 | 124.5 | 4.90 | Juan 1985 | Marinette | [61] |
| 3 | 95.3 | 3.75 | Frances 1998 | Darlington | [61] |
| 4 | 93.2 | 3.67 | Chantal 1989 | Port Washington | [61] |
| 5 | 84.6 | 3.33 | Cristobal 2020 | Augusta 4 NW | [121] |
| 6 | 83.8 | 3.30 | Newton 1986 | Beloit | [61] |
| 7 | 79.8 | 3.14 | Gustav 2008 | Kenosha | [61] |
| 8 | 71.9 | 2.83 | Lester 1992 | Blue Mounds 6 SSE | [61] |
| 9 | 71.9 | 2.83 | Unnamed 1960 | Eau Pleine Reservoir | [61] |
| 10 | 68.1 | 2.68 | Alberto 2018 | New London 1 ENE | [62] |
Wyoming[]
Few tropical cyclone remnants originating from the eastern Pacific make it as far north as Wyoming. Most recently, Hurricane Javier dropped locally heavy rainfall of up to 2 inches (51 mm) in the higher terrain of western Wyoming.[18]
| Precipitation | Storm | Location | Ref. | ||
|---|---|---|---|---|---|
| Rank | mm | in | |||
| 1 | 50.80 | 2.00 | Javier 2004 | Encampment 19 WNW | [18] |
| 2 | 25.90 | 1.02 | Boris 1990 | Bitter Creek 4 NE | [18] |
See also[]
- List of wettest tropical cyclones
- List of wettest tropical cyclones by country
- Tropical cyclone rainfall climatology
- United States rainfall climatology
- United States tropical cyclone rainfall climatology
References[]
- ^ Jump up to: a b c d e f g h i j k l m n o p q r s t u v w x y z aa ab ac ad ae af ag ah ai aj ak al am an ao ap aq ar as at au av aw ax ay az ba bb bc bd be bf bg bh bi bj bk bl bm bn bo bp bq br bs bt bu bv bw bx by bz ca cb cc cd ce cf Roth, David M. (October 18, 2017). "Tropical Cyclone Point Maxima". Tropical Cyclone Rainfall Data. United States Weather Prediction Center. Retrieved November 26, 2017.
- ^ David Roth (2019). "Hurricane Lane - August 22-27, 2018". Weather Prediction Center. Retrieved July 24, 2019.
- ^ Jump up to: a b Central Pacific Hurricane Center. Tropical Cyclones During the Years 1900-1952 (Report). United States National Oceanic and Atmospheric Administration's National Weather Service. Retrieved January 26, 2007.
- ^ Jump up to: a b Meg Wagner, Paul P. Murphy, Mike Hayes and Fernando Alfonso III (September 19, 2019). "Serious flooding in Texas". cnn.com. CNN. Retrieved September 19, 2019.CS1 maint: multiple names: authors list (link)
- ^ Roth, David M.; Hydrometeorological Prediction Center. "Remains of Paul" (GIF). Tropical Cyclone Point Maxima. United States National Oceanic and Atmospheric Administration's National Weather Service. Retrieved December 28, 2007.
- ^ Jump up to: a b Connor Pregizer (September 20, 2018). "Major preliminary rainfall totals for Hurricane Florence". KTVQ Billings News. Retrieved September 23, 2018.
- ^ Roth, David M; Hydrometeorological Prediction Center. "Hurricane Danny Rainfall Page". Tropical Cyclone Point Maxima. United States National Oceanic and Atmospheric Administration's National Weather Service. Retrieved June 9, 2012.
- ^ @NWSWPC (September 17, 2020). "Sally produced copious amounts of rainfall across the Southeast. Here are some selected preliminary rainfall totals from Alabama and Florida" (Tweet) – via Twitter.
- ^ Jump up to: a b c d e f g h i j k l m n o p q r s t u v w x Roth, David M; Hydrometeorological Prediction Center. "Tropical Cyclone Rainfall Impacts along the Gulf Coast". Tropical Cyclone Point Maxima. United States National Oceanic and Atmospheric Administration's National Weather Service. Retrieved June 4, 2012.
- ^ Jump up to: a b c d e f g h i j k l m n o p q r s t u v w x y z Schoner, Robert W; Molansky, Sydney; National Hurricane Research Project (1956). Rainfall associated with Hurricanes and other Tropical Disturbances (PDF) (Report). United States National Oceanic and Atmospheric Administration's National Weather Service. Retrieved June 14, 2012.
- ^ Central Pacific Hurricane Center. The 1978 Central Pacific Tropical Cyclone Season (Report). United States National Oceanic and Atmospheric Administration's National Weather Service. Retrieved June 5, 2012.
- ^ Astrid Sesega. "Cyclone Fears High In Samoa". Retrieved March 7, 2008.
- ^ National Climatic Data Center (2012). "Storm Events Database: Tropical Cyclone Wilma". United States National Oceanic and Atmospheric Administration. Retrieved May 13, 2012.
- ^ National Centers for Environmental Information. "Storm Events Database: Tropical Cyclone Tuni". Archived from the original on February 29, 2016. Retrieved February 29, 2016.
- ^ National Climatic Data Center. "Storm Events Database: Tropical Cyclone Nisha (06F)". Retrieved May 13, 2012.
- ^ Rappaport, Edward N; National Hurricane Center. Hurricane Nora 1997 (Preliminary Report). United States National Oceanic and Atmospheric Administration's National Weather Service. Archived from the original on September 25, 2005. Retrieved March 4, 2008.
- ^ "...Top Arizona Hurricane/Tropical Storm Events." Retrieved December 30, 2007.
- ^ Jump up to: a b c d e f g h i j k l m n o p q r s t u v w x y z aa ab ac ad ae af ag ah ai aj ak al am an ao ap aq ar as at au av aw ax ay az ba bb bc bd be bf Roth, David M (2012). "Tropical Cyclone Rainfall for the Western United States". Tropical Cyclone Point Maxima. Weather Prediction Center. Retrieved November 24, 2017.
- ^ Berg, Robbie (February 1, 2017). Tropical Cyclone Report: Hurricane Newton September 4–7, 2016 (PDF) (Report). United States National Hurricane Center.
- ^ Jump up to: a b Cangialosi, John P (January 11, 2016). Tropical Cyclone Report: Tropical Depression Sixteen-E September 20–21, 2015 (PDF) (Report). United States National Hurricane Center.
- ^ Jump up to: a b "Barry Sets New Rainfall Record in Arkansas". Little Rock, Arkansas: KARK-TV. July 16, 2019. Retrieved July 17, 2019.
- ^ Jump up to: a b Roth, David M; Hydrometeorological Prediction Center (March 8, 2010). "Tropical Storm Bertha (1957) Rainfall Graphic". Tropical Cyclone Point Maxima. United States National Oceanic and Atmospheric Administration's National Weather Service. Retrieved March 8, 2010.
- ^ Peterson, Dan; Hydrometeorological Prediction Center. "Public Advisory Number 44 for Tropical Depression Gustav". United States National Oceanic and Atmospheric Administration's National Weather Service. Retrieved June 4, 2012.
- ^ Jump up to: a b Gerhardt; National Hurricane Center (January 28, 2013). "Tropical Cyclone Report: Hurricane Isaac". United States National Oceanic and Atmospheric Administration's National Weather Service. Retrieved March 27, 2013.
- ^ Jump up to: a b c d Tate. "Post-Tropical Cyclone Harvey Advisory Number 53". Retrieved September 3, 2017.
- ^ Chenoweth, Michael; Landsea, Christopher W (2004). "The San Diego Hurricane of October 2, 1858". Bulletin of the American Meteorological Society. American Meteorological Society. 85 (11): 1689. Bibcode:2004BAMS...85.1689C. doi:10.1175/BAMS-85-11-1689.
- ^ Roth, David M; Hydrometeorological Prediction Center (March 8, 2010). "Hurricane Kathleen Rainfall Page". Tropical Cyclone Point Maxima. United States National Oceanic and Atmospheric Administration's National Weather Service. Retrieved June 4, 2012.
- ^ Jump up to: a b Weather Forecast Office San Diego, California. A History of Significant Weather Events in Southern California (PDF) (Report). United States National Oceanic and Atmospheric Administration's National Weather Service. p. 11. Archived (PDF) from the original on June 4, 2012. Retrieved June 4, 2012.
- ^ Daniel P. Brown (November 12, 2015). Hurricane Linda (EP152015) (PDF) (Report). Tropical Cyclone Report. National Hurricane Center. Retrieved October 13, 2019.
- ^ Jump up to: a b c Roth, David M; Hydrometeorological Prediction Center (March 4, 2008). "Hurricane Diane Rainfall Page". Tropical Cyclone Point Maxima. United States National Oceanic and Atmospheric Administration's National Weather Service. Retrieved March 4, 2008.
- ^ Jump up to: a b c d e f g h i j k l m n o p q r s t u v w x y z aa ab ac ad ae af ag ah ai aj ak al am an ao Roth, David M; Hydrometeorological Prediction Center (2012). "Tropical Cyclone Rainfall for the New England United States". Tropical Cyclone Rainfall Point Maxima. United States National Oceanic and Atmospheric Administration's National Weather Service. Retrieved June 23, 2012.
- ^ Jump up to: a b c d e f g h i j k Soltow, Michael C (August 29, 2011). "Post-Tropical Cyclone Irene Public Advisory Thirty-Seven (Final)". Hydrometeorological Prediction Center. Retrieved August 29, 2011.
- ^ Jump up to: a b c d e f g h Mussie Kebede (September 2, 2021). Storm Summary Number 7 for Heavy Rainfall and Wind Associated with Post Tropical Cyclone Ida (Report). Weather Prediction Center. Retrieved September 3, 2021.
- ^ Jump up to: a b c d e f g Hamrick, David F; Hydrometeorological Prediction Center. "Post-Tropical Cyclone LEE Public Advisory Number 34". Retrieved September 7, 2011.
- ^ Jump up to: a b c d e f g h i j k l m n o p q r s t u v w x y z aa ab ac ad ae af ag ah ai aj ak al am an ao ap aq ar as at au av aw ax ay az Roth, David M; Weather Prediction Center (2012). "Tropical Cyclone Rainfall in the Mid-Atlantic United States". Tropical Cyclone Rainfall Point Maxima. United States National Oceanic and Atmospheric Administration's National Weather Service. Retrieved June 23, 2012.
- ^ Roth, David M; Hydrometeorological Prediction Center. "Hurricane Easy (1950) Rainfall Graphic" (GIF). Tropical Cyclone Point Maxima. United States National Oceanic and Atmospheric Administration's National Weather Service. Retrieved June 4, 2012.
- ^ Jump up to: a b c d e f g Roth, David M (2020). "Tropical Cyclone Rainfall in Florida". Tropical Cyclone Rainfall Point Maxima. Weather Prediction Center. Retrieved December 11, 2020.
- ^ Barnes, Jay (2007). Florida's Hurricane History. University of North Carolina Press: Chapel Hill. pp. 25. ISBN 978-0-8078-3068-0.
- ^ Blanks, Annie. "Heartbreak and devastation in Pensacola after Sally: Residents begin to venture out". Pensacola News Journal.
- ^ Jump up to: a b Roth, David M; Hydrometeorological Prediction Center. "Tropical Storm Alberto Rainfall Page". Tropical Cyclone Point Maxima. United States National Oceanic and Atmospheric Administration's National Weather Service. Retrieved June 5, 2012.
- ^ Jump up to: a b c d e Haggard, William H; Bilton, Thaddeus H; Crutcher, Harold L (1973). "Maximum Rainfall from Tropical Cyclone Systems which Cross the Appalachians" (PDF). Journal of Applied Meteorology. 12 (1): 50–61. Bibcode:1973JApMe..12...50H. doi:10.1175/1520-0450(1973)012<0050:MRFTCS>2.0.CO;2. Retrieved July 16, 2007.
- ^ Jump up to: a b c d e f g h i j k l m Roth, David M; Hydrometeorological Prediction Center. "Tropical Cyclone Rainfall in the Southeastern United States". Tropical Cyclone Rainfall Point Maxima. United States National Oceanic and Atmospheric Administration's National Weather Service. Retrieved June 5, 2012.
- ^ Jump up to: a b c d Stacy R. Stewart (April 3, 2017). Hurricane Matthew (AL142016) (PDF) (Report). Tropical Cyclone Report. National Hurricane Center. Retrieved April 6, 2017.
- ^ "Guam Catastrophe Model". Risk Management Solutions. Archived from the original on February 7, 2011. Retrieved June 16, 2007.CS1 maint: unfit URL (link)
- ^ "Winds". PacificWorlds.com. Archived from the original on August 27, 2007. Retrieved June 16, 2007.
- ^ "Historical Tropical Cyclones Affecting Guam (1671-1990)" (PDF). U.S. Naval Oceanography Command Center and Joint Typhoon Warning Center. Retrieved August 25, 2018.
- ^ Lander, Mark A; Guard, Charles P; Chiu, Arthur (April 2003). "Meteorological Assessment for Super Typhoon Pongsona at Landfall on Guam — December 8, 2002" (PDF). American Meteorological Society. Retrieved June 10, 2012.
- ^ National Oceanic and Atmospheric Administration's National Weather Service. Super Typhoon Pongsona (PDF) (Service Assessment). United States Department of Commerce. Retrieved June 10, 2012.
- ^ Fontaine, Richard A. "Flooding Associated with Typhoon Chata'an, July 5, 2002, Guam" (PDF). United States Geological Survey. Retrieved June 10, 2012.
- ^ United States of America: Pacific Region (PDF). ESCAP/WMO Typhoon Committee 9th Integrated Workshop October 20 – 23, 2014 (Member Report). January 4, 2015. Archived from the original on April 5, 2015. Retrieved April 5, 2015.
- ^ David Roth (2019). "Hurricane Lane - August 22-27, 2018". Weather Prediction Center. Archived from the original on October 31, 2020. Retrieved July 24, 2019.
- ^ Central Pacific Hurricane Center. Tropical Cyclones During the Years 1900-1952 (Report). United States National Oceanic and Atmospheric Administration's National Weather Service. Archived from the original on June 14, 2019. Retrieved January 26, 2007.
- ^ Roth, David M.; Hydrometeorological Prediction Center. "Remains of Paul". Tropical Cyclone Point Maxima (GIF). United States National Oceanic and Atmospheric Administration's National Weather Service. Archived from the original on August 3, 2020. Retrieved December 28, 2007.
- ^ Central Pacific Hurricane Center. The 1970 Central Pacific Tropical Cyclone Season (PDF) (Report). United States National Oceanic and Atmospheric Administration's National Weather Service. Retrieved December 28, 2007.
- ^ Central Pacific Hurricane Center. The 1957 Central Pacific Tropical Cyclone Season (PDF) (Report). United States National Oceanic and Atmospheric Administration's National Weather Service. Retrieved November 28, 2007.
- ^ "Iselle Brought Heavy Rainfall and Flooding to Hawaii". National Weather Service Office in Honolulu, Hawaii. National Oceanic and Atmospheric Administration. August 10, 2014. Archived from the original on August 10, 2014. Retrieved August 10, 2014.
- ^ Central Pacific Hurricane Center. The 1994 Central Pacific Tropical Cyclone Season (PDF) (NOAA Technical Memorandum NWSTM PR-41). United States National Oceanic and Atmospheric Administration's National Weather Service. Retrieved November 28, 2007.
- ^ Kimberlain, Todd B; Wroe Derek; Knabb, Richard D; National Hurricane Center; Central Pacific Hurricane Center (January 10, 2010). Hurricane Felicia (PDF) (Tropical Cyclone Report). United States National Oceanic and Atmospheric Administration's National Weather Service. p. 3. Retrieved May 13, 2012.
- ^ Roth, David M; Hydrometeorological Prediction Center (April 22, 2010). "Hurricane Audrey rainfall page". Tropical Cyclone Point Maxima. Retrieved April 24, 2010.
- ^ Daniel J. Yovich (September 15, 2008). "Hurricane Ike remnants blamed for Midwest deaths, blackouts". Argus Observer. Retrieved September 9, 2020.
- ^ Jump up to: a b c d e f g h i j k l m n o p q r s t u v w x y z aa ab ac ad ae af ag ah ai aj ak al am an ao ap aq ar as at au av aw ax ay az ba bb bc bd be bf bg bh bi bj bk bl bm bn bo bp bq br bs bt bu bv bw bx by bz ca cb cc cd ce cf cg ch ci cj ck cl cm cn co cp Roth, David M; Hydrometeorological Prediction Center (2012). "Tropical Cyclone Rainfall for the Midwest states". United States National Oceanic and Atmospheric Administration's National Weather Service. Retrieved May 13, 2012.
- ^ Jump up to: a b c "Storm Summary Number 15 for Heavy Rain Associated with Alberto". National Oceanic and Atmospheric Administration. Weather Prediction Center. May 31, 2018. Retrieved September 26, 2018.
- ^ "Thunderstorms hit northern plains". The Chronicle Telegram. 1979. Retrieved October 1, 2007.[permanent dead link]
- ^ Jump up to: a b c Brendon Jarrod Rubin-Oster (June 21, 2015). Post-Tropical Cyclone Bill Advisory Number 22. Weather Prediction Center (Report). College Park, Maryland: National Oceanic and Atmospheric Administration. Retrieved June 21, 2015.
- ^ Krekeler (June 23, 2017). Tropical Depression CINDY Advisory Number 19 (Report). Weather Prediction Center. Retrieved August 27, 2017.
- ^ Roth, David M; Hydrometeorological Prediction Center. "Unnamed Tropical Storm — June 22–29, 1960". Tropical Cyclone Point Maxima. United States National Oceanic and Atmospheric Administration's National Weather Service. Retrieved June 13, 2012.
- ^ Jump up to: a b c d Roth, David M; Weather Prediction Center (January 7, 2013). "Maximum Rainfall caused by Tropical Cyclones and their Remnants Per State (1950–2012)". Tropical Cyclone Point Maxima. United States National Oceanic and Atmospheric Administration's National Weather Service. Retrieved March 15, 2013.
- ^ Roth, David M; Hydrometeorological Prediction Center. "A Brief Climatology of Tropical Cyclones in Louisiana" (PDF). United States National Oceanic and Atmospheric Administration's National Weather Service. Archived (PDF) from the original on June 5, 2012. Retrieved June 5, 2012.
- ^ Lamers (July 16, 2019). Post-Tropical Cyclone Barry Advisory Number 25 (Report). Weather Prediction Center. Retrieved July 16, 2019.
- ^ Sable, Edward Sable; United States Weather Bureau (November 23, 1962). Hurricane Daisy effects on New England (United States Government Memorandum). United States National Oceanic and Atmospheric Administration's National Weather Service. Retrieved June 5, 2012.
- ^ Dunn, Gordan E and staff (1963). "The hurricane season of 1962" (PDF). Monthly Weather Review. American Meteorological Society. 91 (4): 199–207. Bibcode:1963MWRv...91..199D. doi:10.1175/1520-0493-91.4.199. Retrieved June 5, 2012.
- ^ Bryant, Ann (August 30, 2011). "Carrabassett Valley deals with aftermath of Hurricane Irene". Sun Journal. Retrieved November 1, 2011.
- ^ "Public Information Statement: Spotter Reports". National Weather Service Office in Caribou, Maine. National Oceanic and Atmospheric Administration. July 6, 2014. Archived from the original on July 6, 2014. Retrieved July 6, 2014.
- ^ Jump up to: a b Roth, David M; Hydrometeorological Prediction Center. "Hurricane Eloise (1975) Rainfall Graphic" (GIF). Tropical Cyclone Point Maxima. United States National Oceanic and Atmospheric Administration's National Weather Service. Retrieved June 4, 2012.
- ^ US Department of Commerce, NOAA. "Impacts From Tropical Depression Cristobal - Heavy Rain / Flooding". www.weather.gov.
- ^ Roth, David M. "Hurricane Georges Rainfall Page". Tropical Cyclone Point Maxima. Retrieved June 4, 2012.
- ^ Guiney, John L; National Hurricane Center (January 5, 1999). "Hurricane Georges 1998". United States National Oceanic and Atmospheric Administration's National Weather Service. Archived from the original (Preliminary Report) on October 5, 2009. Retrieved June 3, 2012.
- ^ David Roth (2021). "[Tropical Storm Claudette 2021 Rainfall Map]". Weather Prediction Center. Retrieved September 3, 2021.
- ^ "Tropical Cyclone Point Maxima". www.wpc.ncep.noaa.gov.
- ^ Jump up to: a b David M. Roth. "Tropical Storm Erin Rainfall Page". Retrieved March 6, 2008.
- ^ Jump up to: a b c Roth, David M; Hydrometeorological Prediction Center. "Hurricane Floyd — September 14–17, 1999". United States National Oceanic and Atmospheric Administration's National Weather Service. Retrieved March 6, 2008.
- ^ Jump up to: a b Gerhardt; Hydrometeorological Prediction Center (October 31, 2012). "Remnants of Sandy Public Advisory Thirty-Seven (Final)". United States National Oceanic and Atmospheric Administration's National Weather Service. Retrieved March 17, 2013.
- ^ @MRotellaWx (August 22, 2021). "Significant flash flooding ongoing in parts of New Jersey this morning. Look at some of these rain totals over the last 12 hours. Please stay off the roads, and stay safe. @accuweather @breakingweather" (Tweet) – via Twitter.
- ^ "Remnants of NEWTON Public Advisory". www.nhc.noaa.gov.
- ^ @NWSNewYorkNY (August 23, 2021). "#Henri rainfall totals through early..." (Tweet) – via Twitter.
- ^ Knight, David B; Davis, Robert E (2007). "Climatology of Tropical Cyclone Rainfall in the Southeastern United States". Physical Geography. 28 (2): 126–147. doi:10.2747/0272-3646.28.2.126. S2CID 129915497. Archived from the original on July 9, 2012. Retrieved June 5, 2012.
- ^ Jump up to: a b "Storm Events Database: Northern Mariana Islands: Tropical Storm Champi". United States National Centers for Environmental Information. Retrieved July 9, 2016.
- ^ Report for 2002GU3B: A rainfall climatology for Saipan: distribution, return periods, and inter-annual variations (PDF) (Report). United States Geological Survey. Retrieved July 9, 2016.
- ^ "3. Summary of Western North Pacific and North Indian Ocean tropical cyclones". 1991 Annual Tropical Cyclone Report (PDF). United States Joint Typhoon Warning Center. Retrieved July 9, 2016.
- ^ "Storm Events Database: Northern Mariana Islands: Tropical Storm Soulik". United States National Centers for Environmental Information. Retrieved July 9, 2016.
- ^ "Storm Events Database: Saipan: Tropical Storm Nabi". United States National Centers for Environmental Information.
- ^ "Storm Events Database: Saipan: Tropical Storm Bavi". United States National Centers for Environmental Information. Retrieved July 9, 2016.
- ^ "Storm Events Database: Northern Mariana Islands: Tropical Storm Sanvu". United States National Centers for Environmental Information. 2012. Archived from the original on August 20, 2012.
- ^ "Rota Event Report: Tropical Storm". United States National Centers for Environmental Information. 2007. Retrieved August 20, 2012.
- ^ "Northern Mariana Islands Event Report: Tropical Storm". United States National Centers for Environmental Information. Retrieved August 20, 2012.
- ^ "Northern Mariana Islands Event Report: Tropical Storm Melor". United States National Centers for Environmental Information. Retrieved August 20, 2012.
- ^ "Daily Weather Maps: September 10–16, 1979". National Weather Service. Retrieved March 6, 2008.
- ^ Jump up to: a b Breanna Zavadoff (August 20, 2021). Storm Summary Number 8 for Heavy Rainfall and Wind Associated with the Remnants of Fred (Report). Weather Prediction Center. Retrieved August 31, 2021.
- ^ Jump up to: a b Roth, David M; Hydrometeorological Prediction Center. "Hurricane Ignacio Rainfall Page". Tropical Cyclone Point Maxima. United States National Oceanic and Atmospheric Administration's National Weather Service. Retrieved June 4, 2012.
- ^ Roth, David M; Hydrometeorological Prediction Center. "Hurricane Georges". Tropical Cyclone Point Maxima. United States National Oceanic and Atmospheric Administration's National Weather Service. Retrieved June 6, 2012.
- ^ Roth, David M; Hydrometeorological Prediction Center. "Tropical Storm Isabel". Tropical Cyclone Point Maxima. United States National Oceanic and Atmospheric Administration's National Weather Service. Retrieved June 6, 2012.
- ^ "Hurricane Maria Live Updates: In Puerto Rico, the Storm 'Destroyed Us'". The New York Times. Retrieved September 22, 2017.
- ^ Roth, David M (June 27, 2007). "Tropical Storm Isabel – October 4 – 16, 1985". United States Weather Prediction Center. Retrieved May 1, 2012.
- ^ Higgs, Ralph L (1954). "Severe Floods of October 12–15, 1954 in Puerto Rico" (PDF). Monthly Weather Review. American Meteorological Society. 82 (10): 301–304. Bibcode:1954MWRv...82..301H. doi:10.1175/1520-0493(1954)082<0301:SFOOIP>2.0.CO;2. ISSN 1520-0493. Retrieved January 8, 2008.
- ^ Geddings, R M (August 1899), Climatological Data, Puerto Rico
- ^ Avila, Lixion A; Cangialosi, John P (December 14, 2011). Hurricane Irene (PDF) (Tropical Cyclone Report). United States National Hurricane Center. p. 14. Retrieved June 2, 2012.
- ^ [Elizabethtown "Hurricane Florence 2018 rainfall graphic"] Check
|url=value (help). National Oceanic and Atmospheric Administration. Weather Prediction Center. 2019. Retrieved April 12, 2019. - ^ Richard J. Pasch; Todd B. Kimberlain; Stacy R. Stewart (November 18, 1999). "Preliminary Report: Hurricane Floyd" (PDF). National Hurricane Center. Retrieved March 4, 2019.
- ^ https://www.nhc.noaa.gov/data/tcr/AL062020_Fay.pdf
- ^ Roth, David M; Hydrometeorological Prediction Center. "Tropical Storm Chris rainfall page". Tropical Cyclone Point Maxima. United States National Oceanic and Atmospheric Administration's National Weather Service. Retrieved June 7, 2012.
- ^ Jump up to: a b c Brown, Daniel P; National Hurricane Center (December 15, 2011). Tropical Storm Lee (PDF) (Tropical Cyclone Report). United States National Oceanic and Atmospheric Administration's National Weather Service. pp. 20–25. Retrieved June 1, 2012.
- ^ Roth, David M; Hydrometeorological Prediction Center. "A Brief Climatology of Tropical Cyclones in Texas" (PDF). Texas Hurricane History (Report). United States National Oceanic and Atmospheric Administration's National Weather Service. Archived (PDF) from the original on June 6, 2012. Retrieved June 6, 2012.
- ^ Jump up to: a b Lixion Avila (August 29, 2017). Tropical Storm Harvey Advisory Number 38 (Report). Miami, Florida: National Hurricane Center. Retrieved August 29, 2017.
- ^ "The previous record for total rainfall during a tropical cyclone has been broken". National Weather Service Houston/Galveston TX. Retrieved August 29, 2017.
- ^ Jump up to: a b Roth, David M; Hydrometeorological Prediction Center. "Tropical Storm Claudette". Tropical Cyclone Point Maxima. United States National Oceanic and Atmospheric Administration's National Weather Service. Retrieved June 4, 2012.
- ^ "Billion-Dollar Weather and Climate Disasters: Table of Events". U.S. Billion-Dollar Weather and Climate Disasters. Asheville, North Carolina: National Centers for Environmental Information. September 2019.
- ^ Jump up to: a b Roth, David M; Hydrometeorological Prediction Center. "Hurricane Hortense". Tropical Cyclone Point Maxima. United States National Oceanic and Atmospheric Administration's National Weather Service. Retrieved June 4, 2012.
- ^ Roth, David M; Hydrometeorological Prediction Center. "Hurricane David 1979 Rainfall Graphic for Puerto Rico". Tropical Cyclone Point Maxima. United States National Oceanic and Atmospheric Administration's National Weather Service. Retrieved June 4, 2012.
- ^ Roth, David M; Hydrometeorological Prediction Center. "Precursor to Hurricane Kendra 1978 Rainfall Graphic". Tropical Cyclone Point Maxima. United States National Oceanic and Atmospheric Administration's National Weather Service. Retrieved June 4, 2012.
- ^ Roth, David M; Cobb, Hugh. "Virginia Tropical Cyclone Climatology". Virginia Hurricane History. United States National Oceanic and Atmospheric Administration's National Weather Service. Retrieved June 6, 2012.
- ^ Precipitation Reports from Past 24 Hours (Report). Iowa Environmental Mesonet. National Weather Service Weather Forecast Office in Twin Cities/Chanhassen, Minnesota. June 10, 2020. Retrieved November 7, 2020.
!["[Tropical Storm Claudette 2021 Rainfall Map]"](https://www.wpc.ncep.noaa.gov/tropical/rain/claudette2021filledrainblk.gif)
External links[]
- Tropical cyclone meteorology
- Lists of tropical cyclones
- Lists of tropical cyclones in the United States