Longford, Greater Manchester
| Longford | |
|---|---|
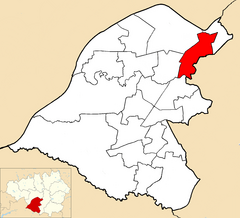 Longford within Trafford | |
| Population | 12,163 [1] |
| Metropolitan borough | |
| Metropolitan county | |
| Country | England |
| Sovereign state | United Kingdom |
| UK Parliament | |
| Councillors | |
Longford is an electoral ward of Trafford, Greater Manchester, covering the Firswood area of Stretford and a small part of the Old Trafford area. It is bordered by the Clifford ward to the northeast, the Gorse Hill ward to the northwest, the Stretford ward to the southwest and Priory to the south.
Councillors[]
As of 2021, the councillors are David Jarman (Labour),[2] Judith Lloyd (Labour),[3] and Sarah Haughey (Labour).[4]
| Election | Councillor | Councillor | Councillor | |||
|---|---|---|---|---|---|---|
| 2004 | David Jarman (Lab) | Pauleen Lane (Lab) | Judith Lloyd (Lab) | |||
| 2006 | David Jarman (Lab) | Pauleen Lane (Lab) | Judith Lloyd (Lab) | |||
| 2007 | David Jarman (Lab) | Pauleen Lane (Lab) | Judith Lloyd (Lab) | |||
| 2008 | David Jarman (Lab) | Pauleen Lane (Lab) | Judith Lloyd (Lab) | |||
| 2010 | David Jarman (Lab) | Pauleen Lane (Lab) | Judith Lloyd (Lab) | |||
| 2011 | David Jarman (Lab) | Anne Duffield (Lab) | Judith Lloyd (Lab) | |||
| 2012 | David Jarman (Lab) | Anne Duffield (Lab) | Judith Lloyd (Lab) | |||
| 2014 | David Jarman (Lab) | Anne Duffield (Lab) | Judith Lloyd (Lab) | |||
| 2015 | David Jarman (Lab) | Anne Duffield (Lab) | Judith Lloyd (Lab) | |||
| 2016 | David Jarman (Lab) | Anne Duffield (Lab) | Judith Lloyd (Lab) | |||
| 2018 | David Jarman (Lab) | Anne Duffield (Lab) | Judith Lloyd (Lab) | |||
| 2019 | David Jarman (Lab) | Anne Duffield (Lab) | Judith Lloyd (Lab) | |||
| 2020 | David Jarman (Lab) | Vacant[5] | Judith Lloyd (Lab) | |||
| 2021 | David Jarman (Lab) | Judith Lloyd (Lab) | Sarah Haughey (Lab) | |||
indicates seat up for re-election. indicates seat up for election following resignation of sitting councillor.
Elections in the 2020s[]
May 2021[]
| Party | Candidate | Votes | % | ±% | |
|---|---|---|---|---|---|
| Labour | Sarah Haughey | 2,470 | 63.1 | N/A | |
| Labour | Judith Lloyd | 2,072 | 53.0 | N/A | |
| Green | Jennie Wadsworth | 517 | 13.2 | N/A | |
| Green | Margaret Westbrook | 435 | 11.1 | N/A | |
| Conservative | Lijo John | 433 | 11.1 | N/A | |
| Conservative | Daniel May | 409 | 10.5 | N/A | |
| Liberal Democrats | Anna Fryer | 387 | 9.9 | N/A | |
| Liberal Democrats | Mark Campion | 210 | 5.4 | N/A | |
| Majority | N/A | ||||
| Rejected ballots | 15 | ||||
| Registered electors | 9,472 | ||||
| Turnout | 3,912 | 41.3 | N/A | ||
| Labour hold | Swing | N/A | |||
| Labour hold | Swing | N/A | |||
Elections in 2010s[]
May 2019[]
| Party | Candidate | Votes | % | ±% | |
|---|---|---|---|---|---|
| Labour | Anne Duffield* | 2,150 | 66.9 | ||
| Green | Margaret Westbrook | 406 | 12.6 | ||
| Conservative | Adam Miya | 336 | 10.46 | ||
| Liberal Democrats | Anna Fryer | 318 | 9.9 | ||
| Majority | 1,744 | 54.3 | |||
| Registered electors | 9,098 | ||||
| Turnout | 3,210 | 35.63 | |||
| Labour hold | Swing | ||||
May 2018[]
| Party | Candidate | Votes | % | ±% | |
|---|---|---|---|---|---|
| Labour | David Jarman* | 2,611 | 71.5 | +3.6 | |
| Conservative | Cathy Conchie | 547 | 15.0 | +0.7 | |
| Green | Margaret Westbrook | 238 | 6.5 | -2.7 | |
| Liberal Democrats | Anna Fryer | 194 | 5.3 | +3.0 | |
| UKIP | Pauline Royle | 60 | 1.6 | -4.7 | |
| Majority | 2,064 | 56.5 | |||
| Turnout | 3,650 | 40.1 | 0 | ||
| Labour hold | Swing | ||||
May 2016[]
| Party | Candidate | Votes | % | ±% | |
|---|---|---|---|---|---|
| Labour | Judith Lloyd* | 2,311 | 67.9 | +3.1 | |
| Conservative | Catherine Conchie | 487 | 14.3 | -6.6 | |
| Green | Margaret Westbrook | 314 | 9.2 | -5.1 | |
| UKIP | Valerie Bayley-Sanderson | 214 | 6.3 | +6.3 | |
| Liberal Democrats | Christopher Lovell | 78 | 2.3 | -4.0 | |
| Majority | 1,824 | 53.6 | +9.7 | ||
| Turnout | 3,404 | 40.1 | -26.7 | ||
| Labour hold | Swing | ||||
May 2015[]
| Party | Candidate | Votes | % | ±% | |
|---|---|---|---|---|---|
| Labour | Anne Duffield* | 3,763 | 64.8 | +1.8 | |
| Conservative | Edward Kelson | 1,212 | 20.9 | -0.2 | |
| Green | Margaret Westbrook | 831 | 14.3 | +3.1 | |
| Majority | 2,551 | 43.9 | +2.0 | ||
| Turnout | 5,806 | 66.8 | +26.9 | ||
| Labour hold | Swing | ||||
May 2014[]
| Party | Candidate | Votes | % | ±% | |
|---|---|---|---|---|---|
| Labour | David Jarman* | 2,003 | 60.8 | -4.5 | |
| Conservative | James Heywood | 603 | 18.3 | -0.1 | |
| Green | Margaret Westbrook | 553 | 16.8 | +3.8 | |
| Liberal Democrats | Dawn Carberry-Power | 135 | 4.1 | +0.8 | |
| Majority | 1,400 | 42.5 | -4.3 | ||
| Turnout | 3294 | 37.9 | +2.9 | ||
| Labour hold | Swing | ||||
May 2012[]
| Party | Candidate | Votes | % | ±% | |
|---|---|---|---|---|---|
| Labour | Judith Lloyd* | 1,885 | 65.3 | +2.3 | |
| Conservative | Alex Finney | 532 | 18.4 | -2.7 | |
| Green | Margaret Westbrook | 375 | 13.0 | +1.8 | |
| Liberal Democrats | Barbara Doyle | 9.6 | 3.3 | -1.4 | |
| Majority | 1,353 | 46.8 | +4.9 | ||
| Turnout | 2,888 | 35.0 | -4.9 | ||
| Labour hold | Swing | ||||
May 2011[]
| Party | Candidate | Votes | % | ±% | |
|---|---|---|---|---|---|
| Labour | Anne Duffield | 2,194 | 63.0 | +9.5 | |
| Conservative | Paul Lally | 734 | 21.1 | -0.6 | |
| Green | Margaret Westbrook | 389 | 11.2 | +2.7 | |
| Liberal Democrats | Dawn Carberry-Power | 164 | 4.7 | -11.5 | |
| Majority | 1,460 | 41.9 | +10.1 | ||
| Turnout | 3,481 | 39.9 | -22.6 | ||
| Labour hold | Swing | ||||
May 2010[]
| Party | Candidate | Votes | % | ±% | |
|---|---|---|---|---|---|
| Labour | David Jarman* | 2,908 | 53.5 | +12.2 | |
| Conservative | Paul Lally | 1,181 | 21.7 | -11.2 | |
| Liberal Democrats | David Rhodes | 881 | 16.2 | +6.2 | |
| Green | Margaret Westbrook | 463 | 8.5 | -7.3 | |
| Majority | 1,727 | 31.8 | +23.5 | ||
| Turnout | 5,433 | 62.5 | +30.0 | ||
| Labour hold | Swing | ||||
Elections in 2000s[]
May 2008[]
| Party | Candidate | Votes | % | ±% | |
|---|---|---|---|---|---|
| Labour | Judith Lloyd* | 1,167 | 41.3 | -4.2 | |
| Conservative | Rod Allan | 931 | 32.9 | +2.8 | |
| Green | Margaret Westbrook | 448 | 15.8 | +2.4 | |
| Liberal Democrats | David Rhodes | 282 | 10.0 | -1.0 | |
| Majority | 236 | 8.3 | -7.1 | ||
| Turnout | 2,828 | 32.5 | -2.6 | ||
| Labour hold | Swing | ||||
May 2007[]
| Party | Candidate | Votes | % | ±% | |
|---|---|---|---|---|---|
| Labour | Pauleen Lane* | 1,313 | 45.5 | -2.5 | |
| Conservative | Roderick Allan | 868 | 30.1 | -2.1 | |
| Green | Bernard Kelly | 388 | 13.4 | -0.9 | |
| Liberal Democrats | Simon Wright | 317 | 11.0 | +11.0 | |
| Majority | 445 | 15.4 | -0.4 | ||
| Turnout | 2,886 | 35.1 | +1.5 | ||
| Labour hold | Swing | ||||
May 2006[]
| Party | Candidate | Votes | % | ±% | |
|---|---|---|---|---|---|
| Labour | David Jarman* | 1,299 | 48.0 | +6.2 | |
| Conservative | Roderick Allan | 870 | 32.2 | +3.9 | |
| Green | Matthew Westbrook | 388 | 14.3 | +3.8 | |
| UKIP | Michael McManus | 148 | 5.5 | +5.5 | |
| Majority | 429 | 15.8 | +3.2 | ||
| Turnout | 2,705 | 33.6 | -6.5 | ||
| Labour hold | Swing | ||||
May 2004[]
| Party | Candidate | Votes | % | ±% | |
|---|---|---|---|---|---|
| Labour | Judith Lloyd* | 1,379 | 14.6 | ||
| Labour | Pauleen Lane* | 1,288 | 13.6 | ||
| Labour | David Jarman* | 1,286 | 13.6 | ||
| Conservative | Roderick Allan | 948 | 10.0 | ||
| Conservative | Edward Kelson | 889 | 9.4 | ||
| Conservative | Geoffrey Harding | 846 | 8.9 | ||
| Liberal Democrats | Waseem Akram | 654 | 6.9 | ||
| Liberal Democrats | Francis Beswick | 591 | 6.2 | ||
| Liberal Democrats | Eric Haughton | 576 | 6.1 | ||
| Green | Anne Power | 362 | 3.8 | ||
| Green | Bernard Kelly | 354 | 3.7 | ||
| Green | Stephen Parker | 287 | 3.0 | ||
| Turnout | 9,460 | 40.1 | |||
| Labour win (new seat) | |||||
| Labour win (new seat) | |||||
| Labour win (new seat) | |||||
May 2003[]
| Party | Candidate | Votes | % | ±% | |
|---|---|---|---|---|---|
| Labour | David Jarman* | 1,708 | 49.7 | -12.6 | |
| Conservative | Geoffrey Harding | 1,233 | 35.9 | -1.8 | |
| Green | Bernard Kelly | 497 | 14.5 | +14.5 | |
| Majority | 475 | 13.8 | -10.8 | ||
| Turnout | 3,438 | 48.4 | -0.1 | ||
| Labour hold | Swing | ||||
May 2002[]
| Party | Candidate | Votes | % | ±% | |
|---|---|---|---|---|---|
| Labour | Judith Lloyd* | 2,174 | 62.3 | +7.8 | |
| Conservative | John Schofield | 1,318 | 37.7 | -7.8 | |
| Majority | 856 | 24.6 | +15.6 | ||
| Turnout | 3,492 | 48.5 | +13.9 | ||
| Labour hold | Swing | ||||
May 2000[]
| Party | Candidate | Votes | % | ±% | |
|---|---|---|---|---|---|
| Labour | Margaret Barker | 1,393 | 54.5 | +0.8 | |
| Conservative | Keith Summerfield | 1,164 | 45.5 | +5.3 | |
| Majority | 229 | 9.0 | -4.5 | ||
| Turnout | 2,557 | 34.6 | +3.9 | ||
| Labour hold | Swing | ||||
Elections in 1990s[]
| Party | Candidate | Votes | % | ±% | |
|---|---|---|---|---|---|
| Labour | Jarman* | 1,215 | 53.7 | -10.6 | |
| Conservative | Kelson | 910 | 40.2 | +4.5 | |
| Liberal Democrats | Browne | 137 | 6.1 | +6.1 | |
| Majority | 305 | 13.5 | -15.1 | ||
| Turnout | 2,262 | 30.7 | -2.3 | ||
| Labour hold | Swing | ||||
| Party | Candidate | Votes | % | ±% | |
|---|---|---|---|---|---|
| Labour | J. A. Lloyd | 1,576 | 64.3 | +5.2 | |
| Conservative | A. Kelly | 875 | 35.7 | -5.2 | |
| Majority | 701 | 28.6 | +10.4 | ||
| Turnout | 2,451 | 33.0 | -2.4 | ||
| Labour hold | Swing | ||||
| Party | Candidate | Votes | % | ±% | |
|---|---|---|---|---|---|
| Labour | T. S. Faltermeyer | 1,544 | 59.1 | -2.0 | |
| Conservative | K. G. Summerfield* | 1,068 | 40.9 | +2.0 | |
| Majority | 476 | 18.2 | -3.9 | ||
| Turnout | 2,612 | 35.4 | -3.7 | ||
| Labour gain from Conservative | Swing | ||||
| Party | Candidate | Votes | % | ±% | |
|---|---|---|---|---|---|
| Labour | D. P. Jarman* | 1,760 | 61.1 | +5.0 | |
| Conservative | J. G. Graham | 1,122 | 38.9 | -3.0 | |
| Majority | 638 | 22.1 | +1.8 | ||
| Turnout | 2,882 | 39.1 | -3.8 | ||
| Labour hold | Swing | ||||
| Party | Candidate | Votes | % | ±% | |
|---|---|---|---|---|---|
| Labour | J. P. Hagan* | 1,779 | 56.1 | +12.7 | |
| Conservative | E. J. Kelson | 1,137 | 35.9 | -17.7 | |
| Liberal Democrats | C. R. Walmsley | 253 | 8.0 | +8.0 | |
| Majority | 642 | 20.3 | +10.2 | ||
| Turnout | 3,169 | 42.9 | +2.0 | ||
| Labour hold | Swing | ||||
| Party | Candidate | Votes | % | ±% | |
|---|---|---|---|---|---|
| Conservative | K. G. Summerfield | 1,615 | 53.6 | +4.8 | |
| Labour | K. Birchenough | 1,309 | 43.4 | -7.8 | |
| Green | D. Glazier | 91 | 3.0 | +3.0 | |
| Majority | 306 | 10.1 | +7.7 | ||
| Turnout | 3,015 | 40.9 | -4.7 | ||
| Conservative gain from Labour | Swing | ||||
| Party | Candidate | Votes | % | ±% | |
|---|---|---|---|---|---|
| Labour | D. P. Jarman | 1,750 | 51.2 | -3.3 | |
| Conservative | K. G. Summerfield* | 1,669 | 48.8 | +9.9 | |
| Majority | 81 | 2.4 | -13.3 | ||
| Turnout | 3,419 | 45.6 | -3.2 | ||
| Labour gain from Conservative | Swing | ||||
| Party | Candidate | Votes | % | ±% | |
|---|---|---|---|---|---|
| Labour | J. P. Hagan* | 2,015 | 54.5 | -0.2 | |
| Conservative | S. M. Dirikis | 1,436 | 38.9 | -6.4 | |
| Green | J. D. Westbrook | 245 | 6.6 | +6.6 | |
| Majority | 579 | 15.7 | +6.4 | ||
| Turnout | 3,696 | 48.8 | +1.4 | ||
| Labour hold | Swing | ||||
Elections in 1980s[]
| Party | Candidate | Votes | % | ±% | |
|---|---|---|---|---|---|
| Labour | M. B. Ryan | 1,934 | 54.7 | +11.7 | |
| Conservative | S. M. Dirikis | 1,604 | 45.3 | -0.5 | |
| Majority | 330 | 9.3 | +6.5 | ||
| Turnout | 3,538 | 47.4 | -5.3 | ||
| Labour hold | Swing | ||||
| Party | Candidate | Votes | % | ±% | |
|---|---|---|---|---|---|
| Conservative | K. G. Summerfield | 1,841 | 45.8 | +6.1 | |
| Labour | P. J. Morgan* | 1,730 | 43.0 | -11.4 | |
| SDP | M. L. Kugler | 450 | 11.2 | +6.3 | |
| Majority | 111 | 2.8 | -3.8 | ||
| Turnout | 4,021 | 52.7 | +7.0 | ||
| Conservative gain from Labour | Swing | ||||
| Party | Candidate | Votes | % | ±% | |
|---|---|---|---|---|---|
| Labour | J. P. Hagan | 1,824 | 28.6 | +2.9 | |
| Labour | P. J. Morgan | 1,711 | 26.8 | -0.7 | |
| Conservative | K. G. Summerfield* | 1,292 | 20.3 | -5.1 | |
| Conservative | E. J. Kelson | 1,235 | 19.4 | -6.9 | |
| SDP | M. L. Kugler | 313 | 4.9 | +4.9 | |
| Majority | 419 | 6.6 | -2.0 | ||
| Turnout | 6,375 | 45.7 | +1.4 | ||
| Labour gain from Conservative | Swing | ||||
| Labour gain from Conservative | Swing | ||||
| Party | Candidate | Votes | % | ±% | |
|---|---|---|---|---|---|
| Labour | M. E. Cottam* | 1,848 | 54.3 | +9.9 | |
| Conservative | I. B. Simmonds | 1,556 | 45.7 | -0.2 | |
| Majority | 292 | 8.6 | +7.1 | ||
| Turnout | 3,404 | 44.3 | -4.8 | ||
| Labour hold | Swing | ||||
| Party | Candidate | Votes | % | ±% | |
|---|---|---|---|---|---|
| Conservative | A. Kelly* | 1,724 | 45.9 | +0.5 | |
| Labour | K. Silcock | 1,666 | 44.4 | +3.2 | |
| Alliance | M. L. Kugler | 363 | 9.7 | -3.7 | |
| Majority | 58 | 1.5 | -2.7 | ||
| Turnout | 3,753 | 49.1 | +2.9 | ||
| Conservative hold | Swing | ||||
| Party | Candidate | Votes | % | ±% | |
|---|---|---|---|---|---|
| Conservative | K. G. Summerfield | 1,638 | 45.4 | +8.1 | |
| Labour | K. Silcock | 1,488 | 41.2 | -21.5 | |
| Liberal | W. A. Munden | 483 | 13.4 | +13.4 | |
| Majority | 150 | 4.2 | -21.2 | ||
| Turnout | 3,609 | 46.2 | -0.7 | ||
| Conservative hold | Swing | ||||
| Party | Candidate | Votes | % | ±% | |
|---|---|---|---|---|---|
| Labour | M. E. Cottam* | 2,252 | 62.7 | +21.6 | |
| Conservative | J. A. Schofield | 1,341 | 37.3 | -7.2 | |
| Majority | 911 | 25.4 | +22.0 | ||
| Turnout | 3,593 | 46.9 | -25.8 | ||
| Labour hold | Swing | ||||
Elections in 1970s[]
| Party | Candidate | Votes | % | ±% | |
|---|---|---|---|---|---|
| Labour | M. E. Cottam | 1,187 | 42.7 | +1.6 | |
| Conservative | J. A. Schofield | 1,127 | 40.5 | -4.0 | |
| Liberal | H. D. Locksley | 466 | 16.8 | +2.4 | |
| Majority | 60 | 2.2 | -1.2 | ||
| Turnout | 2,780 | 29.1 | -43.6 | ||
| Labour gain from Conservative | Swing | ||||
| Party | Candidate | Votes | % | ±% | |
|---|---|---|---|---|---|
| Conservative | A. Kelly* | 3,091 | 44.5 | -9.2 | |
| Labour | M. E. Cottam | 2,852 | 41.1 | +4.6 | |
| Liberal | H. D. Locksley | 1,002 | 14.4 | +4.6 | |
| Majority | 239 | 3.4 | -13.7 | ||
| Turnout | 6,945 | 72.7 | +38.3 | ||
| Conservative hold | Swing | ||||
| Party | Candidate | Votes | % | ±% | |
|---|---|---|---|---|---|
| Conservative | D. W. Homer* | 1,886 | 53.7 | +0.2 | |
| Labour | A. J. Lloyd | 1,284 | 36.5 | +1.8 | |
| Liberal | H. D. Locksley | 343 | 9.8 | -1.9 | |
| Majority | 602 | 17.1 | -1.7 | ||
| Turnout | 3,513 | 34.4 | -4.6 | ||
| Conservative hold | Swing | ||||
| Party | Candidate | Votes | % | ±% | |
|---|---|---|---|---|---|
| Conservative | O. Chandler* | 2,033 | 53.5 | +0.3 | |
| Labour | A. J. Lloyd | 1,319 | 34.7 | +4.0 | |
| Liberal | H. D. Locksley | 446 | 11.7 | -4.4 | |
| Majority | 714 | 18.8 | -3.7 | ||
| Turnout | 3,798 | 39.0 | +3.4 | ||
| Conservative hold | Swing | ||||
| Party | Candidate | Votes | % | ±% | |
|---|---|---|---|---|---|
| Conservative | A. Kelly* | 1,844 | 53.2 | ||
| Labour | K. Silcock | 1,064 | 30.7 | ||
| Liberal | J. Stockley | 557 | 16.1 | ||
| Majority | 780 | 22.5 | |||
| Turnout | 3,465 | 35.6 | |||
| Conservative hold | Swing | ||||
| Party | Candidate | Votes | % | ±% | |
|---|---|---|---|---|---|
| Conservative | D. W. Homer | 1,859 | 52.5 | ||
| Conservative | O. Chandler | 1,811 | |||
| Conservative | A. Kelly | 1,711 | |||
| Labour | J. Bailey | 1,683 | 47.5 | ||
| Labour | H. Pyper | 1,655 | |||
| Labour | K. Silcock | 1,606 | |||
| Majority | 28 | ||||
| Turnout | 3,542 | 35.4 | |||
| Conservative win (new seat) | |||||
| Conservative win (new seat) | |||||
| Conservative win (new seat) | |||||
References[]
- ^ "Area profiles: demographics". infotrafford.org.uk. Trafford Innovation and Intelligence Lab. 2013. Archived from the original on 2 June 2016. Retrieved 8 June 2016.
- ^ "Councillor David Jarman". Trafford Metropolitan Borough Council. Government of the United Kingdom. Retrieved 7 October 2017.
- ^ "Councillor Mrs. Judith Ann Lloyd". Trafford Metropolitan Borough Council. Government of the United Kingdom. Retrieved 7 October 2017.
- ^ "Councillor details - Councillor Sarah Haughey". democratic.trafford.gov.uk. 16 May 2021. Retrieved 16 May 2021.
- ^ "Councillor details - Councillor Anne Duffield". democratic.trafford.gov.uk. 16 May 2021. Retrieved 16 May 2021.
- ^ "2021 Local election results". www.trafford.gov.uk. Retrieved 16 May 2021.
- ^ Anne Duffield, re-elected in 2019, resigned from their seat, creating a second vacancy. Change unavailable due to nature of the election.
- ^ Staff writer (3 May 2019). "Local Election 2019 Results". Trafford MBC. Government of the United Kingdom. Archived from the original on 3 May 2019. Retrieved 5 May 2019.
- ^ Staff writer (4 May 2018). "Local Election 2018 Results". Trafford MBC. Government of the United Kingdom. Archived from the original on 5 May 2018. Retrieved 6 May 2018.
External links[]
Electoral wards of the Metropolitan Borough of Trafford | |||
|---|---|---|---|
 | |||
Former electoral wards (1973-2004)
| |||
Categories:
- Wards of Trafford
- 1974 establishments in England
- Stretford