Morissen
Morissen | |
|---|---|
 | |
 Coat of arms | |
show Location of Morissen | |
 Morissen | |
| Coordinates: 46°43′N 9°10′E / 46.717°N 9.167°ECoordinates: 46°43′N 9°10′E / 46.717°N 9.167°E | |
| Country | Switzerland |
| Canton | Graubünden |
| District | Surselva |
| Area | |
| • Total | 5.67 km2 (2.19 sq mi) |
| Elevation | 1,337 m (4,386 ft) |
| Population (Dec 2011) | |
| • Total | 223 |
| • Density | 39/km2 (100/sq mi) |
| Time zone | UTC+01:00 (Central European Time) |
| • Summer (DST) | UTC+02:00 (Central European Summer Time) |
| Postal code(s) | 7143 |
| SFOS number | 3596 |
| Surrounded by | Cumbel, Luven, Surcuolm, Vella |
| Website | SFSO statistics |


Morissen (Romansh: Murissen) is a former municipality in the district of Surselva in the Swiss canton of Graubünden. The municipalities of Cumbel, Degen, Lumbrein, Morissen, Suraua, Vignogn, Vella, and Vrin merged on 1 January 2013 into the new municipality of Lumnezia.[1]
History[]
Morissen is first mentioned in 1210 as Mureizens.[2]
Coat of arms[]
The municipal coat of arms is Gules three Escallops Or.[3] The scallops on the coat of arms represent St. James the Elder who is the patron saint of the village church.
Geography[]

Morissen had an area, as of 2006, of 5.7 km2 (2.2 sq mi). Of this area, 86.8% is used for agricultural purposes, while 6.2% is forested. Of the rest of the land, 3.7% is settled (buildings or roads) and the remainder (3.3%) is non-productive (rivers, glaciers or mountains).[4]
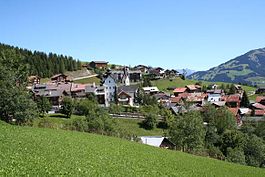
The former municipality is located in the Lugnez sub-district of the Surselva district on the southern foot of the Piz Mundaun and above the Lugnezerstrasse.
Demographics[]
Morissen has a population (as of 2011) of 223.[5] As of 2008, 2.5% of the population was made up of foreign nationals.[6] Over the last 10 years the population has decreased at a rate of -10.3%. Most of the population (as of 2000) speaks Romansh(91.5%), with German being second most common ( 6.6%) and English being third ( 0.9%).[4]
As of 2000, the gender distribution of the population was 50.0% male and 50.0% female.[7] The age distribution, as of 2000, in Morissen is; 20 children or 9.5% of the population are between 0 and 9 years old and 29 teenagers or 13.7% are between 10 and 19. Of the adult population, 17 people or 8.1% of the population are between 20 and 29 years old. 33 people or 15.6% are between 30 and 39, 30 people or 14.2% are between 40 and 49, and 37 people or 17.5% are between 50 and 59. The senior population distribution is 17 people or 8.1% of the population are between 60 and 69 years old, 15 people or 7.1% are between 70 and 79, there are 13 people or 6.2% who are between 80 and 89.[6]
In the 2007 federal election the most popular party was the CVP which received 67.3% of the vote. The next three most popular parties were the SVP (23.1%), the FDP (5.8%) and the SP (3.8%).[4]
In Morissen about 59.9% of the population (between age 25-64) have completed either non-mandatory upper secondary education or additional higher education (either university or a Fachhochschule).[4]
Morissen has an unemployment rate of 0.32%. As of 2005, there were 44 people employed in the primary economic sector and about 18 businesses involved in this sector. 5 people are employed in the secondary sector and there are 3 businesses in this sector. 8 people are employed in the tertiary sector, with 4 businesses in this sector.[4]
The historical population is given in the following table:[2]
| year | population |
|---|---|
| 1850 | 250 |
| 1900 | 163 |
| 1950 | 297 |
| 2000 | 211 |
References[]
- ^ Amtliches Gemeindeverzeichnis der Schweiz published by the Swiss Federal Statistical Office (in German) accessed 2 January 2013
- ^ Jump up to: a b Morissen in German, French and Italian in the online Historical Dictionary of Switzerland.
- ^ Flags of the World.com Archived 2011-06-05 at the Wayback Machine accessed 24-Nov-2009
- ^ Jump up to: a b c d e Swiss Federal Statistical Office accessed 24-Nov-2009
- ^ Swiss Federal Statistics Office – STAT-TAB[permanent dead link] Ständige und Nichtständige Wohnbevölkerung nach Region, Geschlecht, Nationalität und Alter (in German) accessed 3 October 2012
- ^ Jump up to: a b Graubunden Population Statistics Archived 2009-08-27 at the Wayback Machine (in German) accessed 21 September 2009
- ^ Graubunden in Numbers Archived 2009-09-24 at the Wayback Machine (in German) accessed 21 September 2009
| Wikimedia Commons has media related to Morissen. |
External links[]
- Morissen in German, French and Italian in the online Historical Dictionary of Switzerland.
| show Authority control |
|---|
- Former municipalities of Graubünden