Msukaligwa Local Municipality
Msukaligwa | |
|---|---|
 Seal | |
 Location in Mpumalanga | |
| Country | South Africa |
| Province | Mpumalanga |
| District | Gert Sibande |
| Seat | Ermelo |
| Wards | 19 |
| Government | |
| • Type | Municipal council |
| • Mayor | Joseph Sipho Bongwe |
| Area | |
| • Total | 6,016 km2 (2,323 sq mi) |
| Population (2011)[2] | |
| • Total | 149,377 |
| • Density | 25/km2 (64/sq mi) |
| Racial makeup (2011) | |
| • Black African | 88.1% |
| • Coloured | 0.6% |
| • Indian/Asian | 1.1% |
| • White | 9.8% |
| First languages (2011) | |
| • Zulu | 72.6% |
| • Afrikaans | 9.8% |
| • Swazi | 8.5% |
| • English | 3.5% |
| • Other | 5.6% |
| Time zone | UTC+2 (SAST) |
| Municipal code | MP302 |
Msukaligwa Local Municipality is a South African local municipality situated in the Gert Sibande District Municipality, of Mpumalanga. Ermelo is the seat of the municipality.
Main places[]
The 2001 census divided the municipality into the following main places:[3]
| Place | Code | Area (km2) | Population | Most spoken language |
|---|---|---|---|---|
| Breyten | 80201 | 2.75 | 4,591 | Zulu |
| 80202 | 4.78 | 752 | Zulu | |
| Davel | 80203 | 1.61 | 87 | Zulu |
| Ermelo | 80204 | 25.48 | 11,596 | Zulu |
| Kwachibikhulu | 80205 | 0.24 | 2,490 | Zulu |
| KwaDela | 80206 | 0.49 | 3,548 | Zulu |
| KwaZanele | 80207 | 1.90 | 7,493 | Zulu |
| Lothair | 80208 | 6.97 | 93 | Zulu |
| Phumula | 80210 | 2.56 | 16,295 | Zulu |
| Selindile | 80211 | 1.05 | 5,340 | Zulu |
| Sheepmoor | 80212 | 1.68 | 1,229 | Zulu |
| Wesselton | 80213 | 8.34 | 23,443 | Zulu |
| Remainder of the municipality | 80209 | 5,958.56 | 47,832 | Zulu |
Politics[]
The municipal council consists of thirty-eight members elected by mixed-member proportional representation. Nineteen councillors are elected by first-past-the-post voting in nineteen wards, while the remaining nineteen are chosen from party lists so that the total number of party representatives is proportional to the number of votes received. In the election of 3 August 2016 the African National Congress (ANC) won a majority of twenty-nine seats on the council.
The following table shows the results of the election.[4][5]
| Party | Votes | Seats | ||||||
|---|---|---|---|---|---|---|---|---|
| Ward | List | Total | % | Ward | List | Total | ||
| ANC | 30,071 | 30,249 | 60,320 | 74.8 | 18 | 11 | 29 | |
| Democratic Alliance | 5,452 | 5,421 | 10,873 | 13.5 | 1 | 4 | 5 | |
| EFF | 3,165 | 3,087 | 6,252 | 7.8 | 0 | 3 | 3 | |
| Freedom Front Plus | 761 | 707 | 1,468 | 1.8 | 0 | 1 | 1 | |
| IFP | 190 | 228 | 418 | 0.5 | 0 | 0 | 0 | |
| African People's Convention | 172 | 228 | 400 | 0.4 | 0 | 0 | 0 | |
| ACDP | 172 | 165 | 337 | 0.4 | 0 | 0 | 0 | |
| COPE | 164 | 135 | 299 | 0.4 | 0 | 0 | 0 | |
| Sindawonye Progressive Party | 48 | 126 | 174 | 0.2 | 0 | 0 | 0 | |
| Pan Africanist Socialist Movement of Azania | 52 | 41 | 93 | 0.1 | 0 | 0 | 0 | |
| Total | 40,247 | 40,387 | 80,634 | 100.0 | 19 | 19 | 38 | |
| Spoilt votes | 566 | 540 | 1,106 | |||||
References[]
- ^ "Contact list: Executive Mayors". Government Communication & Information System. Archived from the original on 14 July 2010. Retrieved 22 February 2012.
- ^ a b c "Statistics by place". Statistics South Africa. Retrieved 27 September 2015.
- ^ Lookup Tables - Statistics South Africa
- ^ "Results Summary – All Ballots: Msukaligwa" (PDF). Independent Electoral Commission. Retrieved 27 January 2017.
- ^ "Seat Calculation Detail: Msukaligwa" (PDF). Independent Electoral Commission. Retrieved 27 January 2017.
External links[]
| District and local |
|  | ||||||
|---|---|---|---|---|---|---|---|---|
List of municipalities in Mpumalanga | ||||||||
Municipalities and communities of Gert Sibande District Municipality, Mpumalanga | ||
|---|---|---|
District seat: Ermelo | ||
| Govan Mbeki | 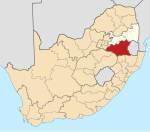 | |
| Albert Luthuli |
| |
| Mkhondo |
| |
| Msukaligwa |
| |
| Lekwa | ||
| Pixley ka Seme |
| |
| Dipaleseng | ||

- Local municipalities of the Gert Sibande District Municipality