Opportunity cost
In microeconomic theory, the opportunity cost of an activity or option is the loss of value or benefit that would be incurred (the cost) by engaging in that activity or choosing that option, versus/relative to engaging in the alternative activity or choosing the alternative option that would offer the highest return in value or benefit (the best forgone opportunity).
In basic equation form, opportunity cost can be defined as:
- Opportunity Cost = FO (returns on best forgone option) − CO (returns on chosen option)[1]
Directly or indirectly, opportunity cost underpins the majority of day-to-day economic decisions that are made in society.[2] For example, the opportunity cost of mowing one’s own lawn for a doctor or a lawyer (who might otherwise make $100 an hour if they elected to work overtime during that time instead) would be higher than for a minimum-wage employee (who in the United States might earn $7.25 an hour), which would make the former more likely to hire someone else to mow their lawn for them.
As a representation of the relationship between scarcity and choice,[3] the objective of opportunity cost is to ensure efficient use of scarce resources.[4] It incorporates all associated costs of a decision, both explicit and implicit.[5] Opportunity cost also includes the utility or economic benefit an individual lost, if it is indeed more than the monetary payment or actions taken. As an example, to go for a walk may not have any financial costs imbedded in to it. Yet, the opportunity forgone is the time spent walking which could have been used instead for other purposes such as earning an income.[4]
| Part of a series on |
| Economics |
|---|
|
However time spent chasing after an income might have health problems like in presenteeism where instead of taking a sick day one avoids it for a salary or to be seen as being active.
A production possibility frontier shows the maximum combination of factors that can be produced. For example if services were on the x axis of a graph and there were to be an increase in services from 20 to 25, this would lead to an opportunity cost for the goods that are on the y axis, as they would drop from 21 to 16. This means that as a result of the increase in consumption of services, the opportunity cost would be those 5 goods that have decreased.[6]
Regardless of the time of occurrence of an activity, if scarcity was non-existent then all demands of a person are satiated. It’s only through scarcity that choice becomes essential, since the use of scarce resources in one way prevents its use in another way, resulting in the need to make a selection and/or decision.[3]
Sacrifice is a given measurement in opportunity cost of which the decision maker forgoes the opportunity of the next best alternative.[7] In other words, to disregard the equivalent utility of the best alternative choice to gain the utility of the best perceived option.[8] If there were decisions to be made that require no sacrifice then these would be cost free decisions with zero opportunity cost.[9] Only through the analysis of opportunity cost, the company can choose the most beneficial project, based on when the actual benefits are greater than the opportunity cost, so that the limited resources can be optimally allocated to achieve maximum efficiency.
Types of opportunity costs[]
Explicit costs[]
Explicit costs are the direct costs of an action (business operating costs or expenses), executed either through a cash transaction or a physical transfer of resources.[5] In other words, explicit opportunity costs are the out-of-pocket costs of a firm, that are easily identifiable.[10] This means explicit costs will always have a dollar value and involve a transfer of money, e.g. paying employees.[11] With this said, these particular costs can easily be identified under the expenses of a firm's income statement and balance sheet to represent all the cash outflows of a firm.[12][11]
Examples are as follows:[10][13]
- Land and infrastructure costs
- Operation and maintenance costs—wages, rent, overhead, materials
Scenarios are as follows:[12]
- If a person leaves work for an hour and spends $200 on office supplies, then the explicit costs for the individual equates to the total expenses for the office supplies of $200.
- If a printer of a company malfunctions, then the explicit costs for the company equates to the total amount to be paid to the repair technician.
Implicit costs[]
Implicit costs (also referred to as implied, imputed or notional costs) are the opportunity costs of utilising resources owned by the firm that could be used for other purposes. These costs are often hidden to the naked eye and aren’t made known.[13] Unlike explicit costs, implicit opportunity costs correspond to intangibles. Hence, they cannot be clearly identified, defined or reported.[12] This means that they are costs that have already occurred within a project, without exchanging cash.[14] This could include a small business owner not taking any salary in the beginning of their tenure as a way for the business to be more profitable. As implicit costs are the result of assets, they are also not recorded for the use of accounting purposes because they do not represent any monetary losses or gains.[14] In terms of factors of production, implicit opportunity costs allow for depreciation of goods, materials and equipment that ensure the operations of a company.[15]
Examples of implicit costs regarding production are mainly resources contributed by a business owner which includes:[10][15]
- Human labour
- Infrastructure
- Time
Scenarios are as follows:[12]
- If a person leaves work for an hour to spend $200 on office supplies, and has an hourly rate of $25, then the implicit costs for the individual equates to the $25 that he/she could have earned instead.
- If a printer of a company malfunctions, the implicit cost equates to the total production time that could have been utilized if the machine did not break down.
Excluded from opportunity cost[]
Sunk costs[]
Sunk costs (also referred to as historical costs) are costs that have been incurred already and cannot be recovered. As sunk costs have already incurred, they remain unchanged and should not influence present or future actions or decisions regarding benefits and costs.[16] Decision makers who recognise the insignificance of sunk costs then understand that the "consequences of choices cannot influence choice itself".[3]
From the traceability source of costs, sunk costs can be direct costs or indirect costs. If the sunk cost can be summarized as a single component, it is a direct cost; if it is caused by several products or departments, it is an indirect cost.
Analyzing from the composition of costs, sunk costs can be either fixed costs or variable costs. When a company abandons a certain component or stops processing a certain product, the sunk cost usually includes fixed costs such as rent for equipment and wages, but it also includes variable costs due to changes in time or materials. Usually, fixed costs are more likely to constitute sunk costs.
Generally speaking, the stronger the liquidity, versatility, and compatibility of the asset, the less its sunk cost will be.
A scenario is given below:[17]
A company used $5,000 for marketing and advertising on its music streaming service to increase exposure to target market and potential consumers. In the end, the campaign proved unsuccessful. The sunk cost for the company equates to the $5,000 that was spent on the market and advertising means. This expense is to be ignored by the company in its future decisions, and highlights that no additional investment should be made.
Despite the fact that sunk costs should be ignored when making future decisions, people sometimes make the mistake of thinking sunk cost matters. This is sunk cost fallacy.
Non-monetary cost[]
This section needs additional citations for verification. (June 2021) |
Seeking a certain profit might have implicit costs such as health, ecological, or other costs. Many of those costs may not be paid directly or immediately after; they may also not be paid by those responsible for the costs. For example, if a company pollutes, the company's accountants may not be responsible for the costs, but the costs may be externalized onto other people in the case of local pollution, or the entire population, in the case of global warming.
Smoking may personally have higher direct costs, such as health costs; it may also generate direct losses economically or increase the prevalence of health problems which could harm the economy. The tobacco industry generates losses for many sectors, however, for the tobacco industry no cost may be paid. Quitting smoking may reduce hidden costs—choosing to take a walk instead of smoking could be beneficial to one's health, for example. Choosing to work half-time may allow for more rest for a sick person.
Externalities are a kind of cost generated from one economic agent to another. For example, the restaurant sector may be growing but obesity may generate a cost, monetary or otherwise in many domains, such as an increased difficulty in recruiting fit firefighters. Some sectors are growing extensively from such costs, private or not. Dentists are needed partly because both sugary foods and tobacco generate work and demand.
Plane travel may generate externalities by contributing to global warming and air pollution, which harms many sectors such as agriculture and nature tourism. Short-term profit may lead to high costs later. Refusing to invest in infrastructure or maintenance for a company may lead to a loss of customers.
The development of tourism has driven the local consumption industry and a series of related economic growths. At the same time, it can lead to excessive development and utilization of tourism resources, serious environmental damage, and a large number of negative impacts affecting the lives of local people. Overcrowding on holidays may lead to a poor experience and a loss of tourists.
Use in economics[]
Economic profit vs. accounting profit[]
Opportunity costs are typically associated with ‘economic profit’ as opposed to 'accounting profit', in which it is seldom considered. Although being quite similar, both types of profit have different principles and objectives in mind, the key difference being the opportunity cost.
Accounting profits are the ‘real costs’ (in terms of real monetary value) of businesses which are included on balance sheets, cash flow statements, and income statements but do not include implicit costs which opportunity costs take into account.[18] The main objective of accounting profits is to give an account of a company’s fiscal performance, typically reported on in quarters and annually. As such, accounting principles focus on tangible and measurable factors associated with operating a business such as wages and rent, and thus, do not “…infer anything about relative economic profitability.”[19] Opportunity costs are not considered in accounting profits as they have no purpose in this regard.
The purpose of calculating economic profits (and thus, opportunity costs) is to aid in better business decision-making through the inclusion of opportunity costs. In this way, a business can evaluate whether its decision and the allocation of its resources is cost-effective or not, and whether resources should be reallocated.[20] However, economic profits are not used to explicitly report real monetary gain. As such, it is more aligned with cost-benefit analysis and its applications in determining business decisions and weighing potential investments (e.g. Why a firm would choose to invest in Project A over Project B). When making a cost-benefit analysis, business should make its decision based on if it makes a positive economic profit, which suggests that the payoff of the chosen option is better than the opportunity cost (the next best alternative).

The calculation behind both economic and accounting profits can be distinguished in a highly simplified fashion as follows:
Opportunity cost = Explicit Cost + Implicit Cost
Economic profit = Income - Opportunity Cost
Accounting profit = Income - Explicit Costs[18]
It is important to note that economic profit does not indicate whether or not a business decision will make money. It signifies if it is prudent to undertake a specific decision against the opportunity of undertaking a different decision. As shown in the simplified example in the image, choosing to start a business would provide $10,000 in terms of accounting profits. However, the decision to start a business would provide -$30,000 in terms of economic profits, indicating that the decision to start a business may not be prudent as the opportunity costs outweigh the profit from starting a business. In this case, where the revenue is not enough to cover the opportunity costs, the chosen option may not be the best course of action.[21] When economic profit is zero, all the explicit and implicit costs (opportunity costs) are covered by the total revenue and there is no incentive for reallocation of the resources. This condition is known as normal profit.
Several performance measures of economic profit have been derived to further improve business decision-making such as risk-adjusted return on capital (RAROC) and economic value added (EVA), which directly include a quantified opportunity cost to aid businesses in risk management and optimal allocation of resources.[22] Opportunity cost, as such, is an economic concept in economic theory which is used to maximise value through better decision-making.
Comparative advantage vs absolute advantage[]
When a nation, organisation or individual can produce a product or service at a relatively lower opportunity cost compared to its competitors, it is said to have a comparative advantage. In other words, a country has comparative advantage if it gives up less of a resource to make the same number of products as the other country that has to give up more.[23]
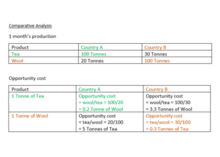
Using the simple example in the image, to make 100 tonnes of tea, Country A has to give up the production of 20 tonnes of wool which means for every 1 tonne of tea produced, 0.2 tonne of wool has to be forgone. Meanwhile, to make 30 tonnes of tea, Country B needs to sacrifice the production of 100 tonnes of wool, so for each tonne of tea, 3.3 tonnes of wool is forgone. In this case, Country A has comparative advantage over Country B for the production of tea because it has a lower opportunity cost. On the other hand, to make 1 tonne of wool, Country A has to give up 5 tonnes of tea, while Country B would need to give up 0.3 tonnes of tea, so Country B has comparative advantage over the production of wool.
Absolute advantage on the other hand refers to how efficiently a party can use its resources to produce goods and services compared to others, regardless of its opportunity costs. For example, if Country A can produce 1 tonne of wool using less manpower compared to Country B, then it is more efficient and has an absolute advantage over wool production, even if it does not have comparative advantage because it has a higher opportunity cost (5 tonnes of tea).[23]
Absolute advantage refers to how efficiently resources are used whereas comparative advantage refers to how little is sacrificed in terms of opportunity cost. When a country produces what it has comparative advantage of, even if it does not have absolute advantage, and trades for those products it does not have comparative advantage over, it maximises its output since the opportunity cost of its production is lower than its competitors. By focusing on specialising this way, it also maximises its level of consumption.[23]
Opportunity cost at governmental level[]
Much like individual decisions, it is often the case that governments must consider opportunity cost when enacting legislation. Taking universal basic healthcare as an example, the opportunity cost at government level is quite clear. Assume that implementing basic healthcare would cost a government $1 billion: the explicit opportunity cost to implement such legislation would be a combined $1 billion that could have been spent on education, housing, transport infrastructure, environmental protection, or military defence, for example. For this particular scenario, the implicit cost is quite minimal. Only the cost on producing such legislation through human labour and the time of production would need to be accounted for.
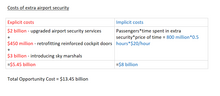
While the previous situation’s implicit cost may have been somewhat negligible at a government level, this is not true for all scenarios. Using hijacking prevention methods following the September 11 attacks as an example, the additional burden of implicit costs is evident. To implement more sophisticated airport security systems, the United States government estimated the cost to be around $2 billion. An additional $450 million would be spent to reinforce plane doors, along with an extra $3 billion spent on sky marshals for all American flights to help further prevent future hijackings from taking place. Under this scenario, the explicit cost would be $5.45 billion. Implicit costs, however, would far outweigh this. The US government has calculated that by waiting an additional 30 minutes due to extra airport security, multiplied by an average of 800 million passengers per year with the average cost of time at $20 per hour, the total implicit cost to the US economy from such prevention methods would be upwards of $8 billion.[24] Thus the importance of recognising the opportunity cost at a governmental level is crucial in efficiently allocating government funds.
See also[]
- Austrian School
- Best alternative to a negotiated agreement
- Budget constraint
- Economic value added
- Fear of missing out
- Lucrum cessans
- Opportunity cost of capital
- Production-possibility frontier
- Reduced cost aka 'opportunity cost' in linear programming
- There ain't no such thing as a free lunch
- Time management
- Trade-off
- You can't have your cake and eat it
- Perverse subsidies
References[]
- ^ Fernando, Jason. "Opportunity Cost". Investopedia. Retrieved 23 April 2021.
- ^ Fernando, Jason. "Opportunity Cost". Investopedia. Retrieved 23 April 2021.
- ^ Jump up to: a b c Buchanan, James M. (1991). "Opportunity Cost". The World of Economics: 520–525. doi:10.1007/978-1-349-21315-3_69 – via SpringerLink.
- ^ Jump up to: a b "Economics A-Z terms beginning with O". The Economist. Retrieved 1 November 2020.
- ^ Jump up to: a b Hutchison, Emma (2017). Principles of Microeconomics. University of Victoria.
- ^ Pettinger, Tejvan. "Opportunity Cost Definition". Economics Help. Retrieved 30 April 2021.
- ^ Parkin, Michael (2016). "Opportunity Cost: A reexamination". The Journal of Economic Education. 47 (1): 12–22 – via Taylor & Francis Online.
- ^ "(PDF) A HISTORICAL VIEW OVER THE OPPORTUNITY COST -ACCOUNTING DIMENSION". ResearchGate. Retrieved 1 November 2020.
- ^ Burch, Earl E.; Henry, William (1974). "Opportunity and Incremental Cost: Attempt to Define in Systems Terms: A Comment. The Accounting Review". The Accounting Review. 49: 118–123 – via JSTOR.
- ^ Jump up to: a b c "Explicit and implicit costs and accounting and economic profit". Khan Academy. 2016. Retrieved 1 November 2020.
- ^ Jump up to: a b "Explicit Costs - Overview, Types of Profit, Examples". Corporate Finance Institute. Retrieved 30 April 2021.
- ^ Jump up to: a b c d "Explicit Costs: Definition and Examples". Indeed. 5 February 2020. Retrieved 1 November 2020.
- ^ Jump up to: a b Crompton, John L.; Howard, Dennis R. (2013). "Costs: The Rest of the Economic Impact Story" (PDF). Journal of Sport Management. 27 (5): 379–392. Archived from the original (PDF) on 4 March 2019.
- ^ Jump up to: a b Kenton, Will. "How Implicit Costs Work". Investopedia. Retrieved 30 April 2021.
- ^ Jump up to: a b "Reading: Explicit and Implicit Costs". Lumen Learning. Retrieved 1 November 2020.
- ^ Devine, Kevin; O Clock, Priscilla (March 1995). "The effect on sunk costs and opportunity costs on a subjective capital allocation decision". The Mid-Atlantic Journal of Business. 31 (1): 25–38.
- ^ "Four Examples of Sunk Cost". Indeed. 6 October 2020. Retrieved 1 November 2020.
- ^ Jump up to: a b Navid, Vahid; Dehghanpour, Mohammed; Nasirizadeh, Hamidreza (2013). "Comparison between accounting profit and economic profit and its effect on optimal point of production". European Online Journal of Natural and Social Sciences. 2 (3): 493–499. ISSN 1805-3602. Retrieved 10 March 2021.
- ^ Holian, Matthew; Reza, Ali (19 July 2010). "Firm and industry effects in accounting versus economic profit data". Applied Economics Letters. 18 (6): 527–529.
- ^ Goolsbee, Austan; Levitt, Steven; Syverson, Chad (2019). Microeconomics (3rd ed.). Macmillan Learning. pp. 8a–8j. ISBN 9781319306793.
- ^ Layton, Allan; Robinson, Tim; B. Tucker III, Irvin (2015). Economics for Today (5th ed.). Cengage Australia. pp. 131–132, 479–486. ISBN 9780170276313.
- ^ Kimball, Ralph (1998). "Economic Profit and Performance Measurement in Banking". New England Economic Review. Federal Reserve Bank of Boston: 35–39. ISSN 0028-4726. Retrieved 13 March 2021.
- ^ Jump up to: a b c Layton, Allan; Robinson, Tim; B. Tucker III; Irvin (2015). Economics for Today (5th ed.). Cengage Australia. pp. 131–132, 479–486. ISBN 9780170276313.
- ^ Jones, Peter. "The Concept of Opportunity Cost". ER services. Retrieved 25 April 2021.
External links[]
| Wikiquote has quotations related to: Opportunity cost |
| show Authority control |
|---|
- Costs
- Economics and time