Potter Valley, California
Potter Valley | |
|---|---|
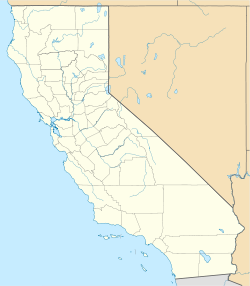 Potter Valley Location in California | |
| Coordinates: 39°19′20″N 123°06′47″W / 39.32222°N 123.11306°WCoordinates: 39°19′20″N 123°06′47″W / 39.32222°N 123.11306°W | |
| Country | |
| State | |
| County | Mendocino |
| Area | |
| • Total | 4.058 sq mi (10.511 km2) |
| • Land | 4.030 sq mi (10.437 km2) |
| • Water | 0.028 sq mi (0.074 km2) 0.70% |
| Elevation | 948 ft (289 m) |
| Population (2010) | |
| • Total | 646 |
| • Density | 160/sq mi (61/km2) |
| Time zone | UTC−8 (Pacific) |
| • Summer (DST) | UTC−7 (PDT) |
| ZIP code | 95469 |
| Area code(s) | 707 |
| FIPS code | 06-58506 |
| GNIS feature IDs | 265005; 2628779 |
| U.S. Geological Survey Geographic Names Information System: Potter Valley, California; U.S. Geological Survey Geographic Names Information System: Potter Valley, California | |

Potter Valley is a census-designated place[3] in Mendocino County, California, United States.[1] It is located 18 miles (29 km) north-northeast of Ukiah,[4] at an elevation of 948 feet (289 m).[1] It is located at the headwaters of the East Fork Russian River. The CDP population was 646 at the 2010 census.
History[]
In 1852, when William and Thomas Potter and Mose Briggs first entered what would become known as Potter Valley, they were searching for the headwaters of the Russian River from their base in Sonoma County. The Pomo people called it Ba-lo Kai. They found three Pomo villages (each about 500 people strong), the Russian headwaters, and a lush valley with wild oats "stirrup high". Eventually the Potters returned to settle there, and the valley became known by the American ranchers' name.[5]
The post office opened in 1870.[4]
Painter Grace Hudson was born in Potter Valley in 1865.[6]
In addition to his famous Ridgewood Ranch, Charles S. Howard, the owner of the racehorse Seabiscuit, owned a ranch in Potter Valley where he ran cattle and occasionally secluded Seabiscuit when visitors became bothersome.[7]
Geography[]
According to the United States Census Bureau, the Census Designated Place (CDP) covers an area of 4.1 square miles (10.5 km2), 99.30% of it land, and 0.70% of it water.
However, the CDP does not cover the full area of the geographic Potter Valley floor. The actual size of the valley is closer to 12 square miles and the area served by the Potter Valley Community Unified School District is 157.21 square miles.
Climate[]
Potter Valley has a hot-summer mediterranean climate (Csa)typical of the interior of Northern California with hot, dry summers and cool, wet winters, along with great diurnal temperature variation.
| hideClimate data for Potter Valley Powerhouse, California (normals 1981-2010)(extremes 1937-2020) | |||||||||||||
|---|---|---|---|---|---|---|---|---|---|---|---|---|---|
| Month | Jan | Feb | Mar | Apr | May | Jun | Jul | Aug | Sep | Oct | Nov | Dec | Year |
| Record high °F (°C) | 82.0 (27.8) |
87.0 (30.6) |
90.0 (32.2) |
95.0 (35.0) |
102.0 (38.9) |
110.0 (43.3) |
113.0 (45.0) |
116.0 (46.7) |
111.0 (43.9) |
103.0 (39.4) |
93.0 (33.9) |
83.0 (28.3) |
116.0 (46.7) |
| Mean maximum °F (°C) | 68.1 (20.1) |
73.1 (22.8) |
79.1 (26.2) |
86.4 (30.2) |
93.4 (34.1) |
99.7 (37.6) |
103.4 (39.7) |
102.9 (39.4) |
100.4 (38.0) |
91.2 (32.9) |
75.2 (24.0) |
65.7 (18.7) |
105.6 (40.9) |
| Average high °F (°C) | 56.2 (13.4) |
60.2 (15.7) |
65.0 (18.3) |
69.7 (20.9) |
77.3 (25.2) |
85.2 (29.6) |
93.5 (34.2) |
92.5 (33.6) |
88.1 (31.2) |
77.0 (25.0) |
62.2 (16.8) |
54.8 (12.7) |
73.5 (23.1) |
| Daily mean °F (°C) | 45.4 (7.4) |
48.3 (9.1) |
54.8 (12.7) |
55.0 (12.8) |
61.0 (16.1) |
67.5 (19.7) |
73.7 (23.2) |
72.4 (22.4) |
68.2 (20.1) |
60.0 (15.6) |
50.1 (10.1) |
44.6 (7.0) |
58.2 (14.6) |
| Average low °F (°C) | 34.6 (1.4) |
36.4 (2.4) |
38.6 (3.7) |
40.4 (4.7) |
44.6 (7.0) |
49.8 (9.9) |
53.9 (12.2) |
52.2 (11.2) |
48.4 (9.1) |
43.0 (6.1) |
38.1 (3.4) |
34.3 (1.3) |
42.9 (6.1) |
| Mean minimum °F (°C) | 24.2 (−4.3) |
26.1 (−3.3) |
28.8 (−1.8) |
31.3 (−0.4) |
35.3 (1.8) |
40.3 (4.6) |
46.4 (8.0) |
45.2 (7.3) |
40.4 (4.7) |
33.3 (0.7) |
26.3 (−3.2) |
23.3 (−4.8) |
21.4 (−5.9) |
| Record low °F (°C) | 14.0 (−10.0) |
15.0 (−9.4) |
20.0 (−6.7) |
22.0 (−5.6) |
28.0 (−2.2) |
32.0 (0.0) |
38.0 (3.3) |
39.0 (3.9) |
33.0 (0.6) |
21.0 (−6.1) |
19.0 (−7.2) |
12.0 (−11.1) |
12.0 (−11.1) |
| Average precipitation inches (mm) | 8.41 (214) |
7.55 (192) |
6.49 (165) |
3.31 (84) |
1.98 (50) |
0.45 (11) |
0.04 (1.0) |
0.08 (2.0) |
0.59 (15) |
2.51 (64) |
6.27 (159) |
9.06 (230) |
46.74 (1,187) |
| Average precipitation days (≥ 0.01 in) | 13.0 | 12.7 | 12.1 | 8.2 | 5.9 | 1.7 | 0.2 | 0.4 | 2.0 | 5.0 | 12.2 | 14.3 | 87.7 |
| Source: NOAA[8] | |||||||||||||
Demographics[]
The 2010 United States Census[9] reported that the Potter Valley CDP had a population of 646. The population density was 159.2 people per square mile (61.5/km2). The racial makeup of Potter Valley was 516 (79.9%) White, 2 (0.3%) African American, 13 (2.0%) Native American, 2 (0.3%) Asian, 0 (0.0%) Pacific Islander, 97 (15.0%) from other races, and 16 (2.5%) from two or more races. Hispanic or Latino of any race were 154 persons (23.8%).
The Census reported that 636 people (98.5% of the population) lived in households, 10 (1.5%) lived in non-institutionalized group quarters, and 0 (0%) were institutionalized.
There were 241 households, out of which 73 (30.3%) had children under the age of 18 living in them, 125 (51.9%) were opposite-sex married couples living together, 20 (8.3%) had a female householder with no husband present, 16 (6.6%) had a male householder with no wife present. There were 20 (8.3%) unmarried opposite-sex partnerships, and 0 (0%) same-sex married couples or partnerships. 61 households (25.3%) were made up of individuals, and 22 (9.1%) had someone living alone who was 65 years of age or older. The average household size was 2.64. There were 161 families (66.8% of all households); the average family size was 3.19.
The population was spread out, with 142 people (22.0%) under the age of 18, 56 people (8.7%) aged 18 to 24, 156 people (24.1%) aged 25 to 44, 206 people (31.9%) aged 45 to 64, and 86 people (13.3%) who were 65 years of age or older. The median age was 41.6 years. For every 100 females, there were 105.1 males. For every 100 females age 18 and over, there were 101.6 males.
There were 267 housing units at an average density of 65.8 per square mile (25.4/km2), of which 152 (63.1%) were owner-occupied, and 89 (36.9%) were occupied by renters. The homeowner vacancy rate was 0%; the rental vacancy rate was 10.0%. 382 people (59.1% of the population) lived in owner-occupied housing units and 254 people (39.3%) lived in rental housing units.
Politics[]
In the state legislature, Potter Valley is in the 2nd Senate District, represented by Democrat Mike McGuire,[10] and the 2nd Assembly District, represented by Democrat Jim Wood.[11]
Federally, Potter Valley is in California's 2nd congressional district, represented by Democrat Jared Huffman.[12]
Geography[]
Potter Valley is located just northeast of Ukiah and Lake Mendocino in Mendocino County, with the valley floor at roughly 1,000 ft (300 m) elevation. The headwaters of the East Fork of the Russian River originate in the valley. The Potter Valley Project delivers additional water from the Eel River, which flows into the Russian River here via a controversial hydroelectric plant that tunnels through the mountains to take advantage of the relative proximity of these two waterways. This diversion supplies a significant amount of water to inland Mendocino and Sonoma Counties. Potter Valley is a rich agricultural region, with excellent soils, planted mostly in irrigated pasture, wine grapes, and pears, but supporting a wide variety of farms and ranches.
Climate[]
| showClimate data for Potter Valley, California (1981–2010 normals, extremes 1937–present) |
|---|
| Monthly Climate Averages for Potter Valley (1961–1990)[13] | ||||||||||||
| Month | Jan | Feb | Mar | Apr | May | Jun | Jul | Aug | Sep | Oct | Nov | Dec |
|---|---|---|---|---|---|---|---|---|---|---|---|---|
| Average High (°F) | 57 | 61 | 64 | 69 | 78 | 86 | 94 | 92 | 88 | 77 | 63 | 56 |
| Average Low (°F) | 33 | 37 | 38 | 39 | 43 | 49 | 53 | 52 | 48 | 43 | 37 | 34 |
| Average Precipitation (inches) | 9 | 6.96 | 5.89 | 2.7 | 0.93 | 0.14 | 0.07 | 0.31 | 0.9 | 2.79 | 6.9 | 7.75 |
References[]
- ^ Jump up to: a b c U.S. Geological Survey Geographic Names Information System: Potter Valley
- ^ U.S. Census Archived 2012-07-02 at the Wayback Machine
- ^ U.S. Geological Survey Geographic Names Information System: Potter Valley, California
- ^ Jump up to: a b Durham, David L. (1998). California's Geographic Names: A Gazetteer of Historic and Modern Names of the State. Clovis, Calif.: Word Dancer Press. p. 125. ISBN 1-884995-14-4.
- ^ Mendocino County Historical Society, The Potter Valley Story 1972
- ^ Grace Hudson Museum & Sun House, 2012, accessed 21 March 2013
- ^ Historic Restoration... The Ultimate Recycling Archived 2010-04-05 at the Wayback Machine, Victorian Homes Magazine 2012, accessed 21 March 2013
- ^ Jump up to: a b "Potter Valley Powerhouse - Eureka, CA NOAA Online Weather Data". National Oceanic and Atmospheric Administration. Retrieved February 14, 2021.
- ^ "2010 Census Interactive Population Search: CA - Potter Valley CDP". U.S. Census Bureau. Archived from the original on July 15, 2014. Retrieved July 12, 2014.
- ^ "Senators". State of California. Retrieved March 10, 2013.
- ^ "Members Assembly". State of California. Retrieved March 2, 2013.
- ^ "California's 2nd Congressional District - Representatives & District Map". Civic Impulse, LLC. Retrieved March 1, 2013.
- ^ Forrey, Rip. "Climate data for various locations in Sonoma, Napa, Mendocino, Lake and Marin counties, California" (PDF). University of California Cooperative Extension Sonoma County. Archived from the original (PDF) on 2007-06-30. Retrieved 2007-11-30.
External links[]
- Potter Valley Bird Sightings
- Potter Valley American Viticultural Area
- Potter Valley Websites
- Potter Valley Community Unified School District
- Historical weather data from the Potter Valley Pumping Station
- Potter Valley Community Parks & Recreation
- Potter Valley Youth & Community Center
- Potter Valley Irrigation District
- Potter Valley Tribe of Pomo Indians
| show Municipalities and communities of Mendocino County, California, United States |
|---|

| show Authority control |
|---|
- Census-designated places in Mendocino County, California
- Populated places established in 1852
- Census-designated places in California
- 1852 establishments in California