SAT
| Type | Paper-based standardized test |
|---|---|
| Developer / administrator | College Board, Educational Testing Service |
| Knowledge / skills tested | Writing, critical reading, mathematics |
| Purpose | Admission to undergraduate programs of universities or colleges |
| Year started | 1926 |
| Duration | 3 hours (without the essay) or 3 hours 50 minutes (with the essay until June 2021) |
| Score / grade range | Test scored on scale of 200–800, (in 10-point increments), on each of two sections (total 400–1600). Essay scored on scale of 2–8, in 1-point increments, on each of three criteria |
| Offered | 7 times annually[a] |
| Countries / regions | Worldwide |
| Languages | English |
| Annual number of test takers | |
| Prerequisites / eligibility criteria | No official prerequisite. Intended for high school students. Fluency in English assumed. |
| Fee | US$55.00 to US$108.00, depending on country.[3] |
| Scores / grades used by | Most universities and colleges offering undergraduate programs in the U.S. |
| Website | sat |
| This article is part of a series on |
| Education in the United States |
|---|
| Summary |
|
| Issues |
|
| Levels of Education |
|
|
|
The SAT (/ˌɛsˌeɪˈtiː/ ess-ay-TEE) is a standardized test widely used for college admissions in the United States. Since its debut in 1926, its name and scoring have changed several times; originally called the Scholastic Aptitude Test, it was later called the Scholastic Assessment Test, then the SAT I: Reasoning Test, then the SAT Reasoning Test, then simply the SAT.
The SAT is wholly owned, developed, and published by the College Board, a private, not-for-profit organization in the United States. It is administered on behalf of the College Board by the Educational Testing Service,[4] which until recently developed the SAT as well.[5] The test is intended to assess students' readiness for college. The SAT was originally designed not to be aligned with high school curricula,[6] but several adjustments were made for the version of the SAT introduced in 2016, and College Board president, David Coleman, has said that he also wanted to make the test reflect more closely what students learn in high school with the new Common Core standards.[7]
The SAT takes three hours to finish and as of 2021 costs US$55.00, excluding late fees, with additional processing fees if the SAT is taken outside the United States.[8] Scores on the SAT range from 400 to 1600, combining test results from two 200-to-800-point sections: the Mathematics section and the Evidence-Based Reading and Writing section. Although taking the SAT, or its competitor the ACT, is required for freshman entry to many colleges and universities in the United States,[9] during the 2010s, many institutions made these entrance exams optional,[10][11][12] but this did not stop the students from attempting to achieve high scores[13] as they and their parents are skeptical of what "optional" means in this context.[14] In fact, the test-taking population was increasing steadily.[15] And while this may have resulted in a long-term decline in scores,[15][16][17] experts cautioned against using this to gauge the scholastic levels of the entire U.S. population.[17]
Starting with the 2015–16 school year, the College Board began working with Khan Academy to provide free SAT preparation.[18] On January 19, 2021, the College Board announced the discontinuation of the optional essay section, as well as its SAT Subject Tests, after June 2021.[19][20]
While a considerable amount of research has been done on the SAT, many questions and misconceptions remain.[21] Outside of college admissions, the SAT is also used by psychologists and neuroscientists studying human intelligence in general and intellectual precociousness in particular,[22][23][24] and by some employers in the recruitment process.[25][26][27]
Function[]


The SAT is typically taken by high school juniors and seniors.[28] The College Board states that the SAT is intended to measure literacy, numeracy and writing skills that are needed for academic success in college. They state that the SAT assesses how well the test-takers analyze and solve problems—skills they learned in school that they will need in college. However, the test is administered under a tight time limit (speeded) to help produce a range of scores.[29]
The College Board also states that use of the SAT in combination with high school grade point average (GPA) provides a better indicator of success in college than high school grades alone, as measured by college freshman GPA. Various studies conducted over the lifetime of the SAT show a statistically significant increase in correlation of high school grades and college freshman grades when the SAT is factored in.[30] The predictive validity and powers of the SAT are topics of active research in psychometrics.[21]
There are substantial differences in funding, curricula, grading, and difficulty among U.S. secondary schools due to U.S. federalism, local control, and the prevalence of private, distance, and home schooled students. SAT (and ACT) scores are intended to supplement the secondary school record and help admission officers put local data—such as course work, grades, and class rank—in a national perspective.[31]
Historically, the SAT was more widely used by students living in coastal states and the ACT was more widely used by students in the Midwest and South; in recent years, however, an increasing number of students on the East and West coasts have been taking the ACT.[32][33] Since 2007, all four-year colleges and universities in the United States that require a test as part of an application for admission will accept either the SAT or ACT, and as of Fall 2022, over 1400 four-year colleges and universities do not require any standardized test scores at all for admission, though some of them are applying this policy only temporarily due to the coronavirus pandemic.[34][35]
Structure[]
The SAT two main sections, namely Evidence-Based Reading and Writing (EBRW, normally known as the "English" portion of the test) and the Math section. These are both further broken down into four sections: Reading, Writing and Language, Math (no calculator), and Math (calculator allowed). The test taker was also optionally able to write an essay which, in that case, is the fifth test section. The total time for the scored portion of the SAT is three hours (or three hours and fifty minutes if the optional essay section was taken). Some test takers who are not taking the essay may also have a fifth section, which is used, at least in part, for the pretesting of questions that may appear on future administrations of the SAT. (These questions are not included in the computation of the SAT score.)
Two section scores result from taking the SAT: Evidence-Based Reading and Writing, and Math. Section scores are reported on a scale of 200 to 800, and each section score is a multiple of ten. A total score for the SAT is calculated by adding the two section scores, resulting in total scores that range from 400 to 1600. In addition to the two section scores, three "test" scores on a scale of 10 to 40 are reported, one for each of Reading, Writing and Language, and Math, with increment of 1 for Reading / Writing and Language, and 0.5 for Math. There are also two cross-test scores that each range from 10 to 40 points: Analysis in History/Social Studies and Analysis in Science.[36] The essay, if taken, was scored separately from the two section scores.[37] Two people score each essay by each awarding 1 to 4 points in each of three categories: Reading, Analysis, and Writing.[38] These two scores from the different examiners are then combined to give a total score from 2 to 8 points per category. Though sometimes people quote their essay score out of 24, the College Board themselves do not combine the different categories to give one essay score, instead giving a score for each category.
There is no penalty or negative marking for guessing on the SAT: scores are based on the number of questions answered correctly. The optional essay will not be offered after the June 2021 administration.[19][20] College Board said it would discontinue the essay section because "there are other ways for students to demonstrate their mastery of essay writing," including the test's reading and writing portion.[19][20] It also acknowledged that the COVID-19 pandemic had played a role in the change, accelerating 'a process already underway'.[20]
Reading Test[]
The Reading Test of the SAT contains one section of 52 questions and a time limit of 65 minutes.[37] All questions are multiple-choice and based on reading passages. Tables, graphs, and charts may accompany some passages, but no math is required to correctly answer the corresponding questions. There are five passages (up to two of which may be a pair of smaller passages) on the Reading Test and 10-11 questions per passage or passage pair. SAT Reading passages draw from three main fields: history, social studies, and science. Each SAT Reading Test always includes: one passage from U.S. or world literature; one passage from either a U.S. founding document or a related text; one passage about economics, psychology, sociology, or another social science; and, two science passages. Answers to all of the questions are based only on the content stated in or implied by the passage or passage pair.[39]
The Reading Test contributes (with the Writing and Language Test) to two subscores, each ranging from 1 to 15 points:[36]
- Command of Evidence
- Words in Context
Writing and Language Test[]
The Writing and Language Test of the SAT is made up of one section with 44 multiple-choice questions and a time limit of 35 minutes.[37] As with the Reading Test, all questions are based on reading passages which may be accompanied by tables, graphs, and charts. The test taker will be asked to read the passages, suggest corrections or improvements for the contents underlined. Reading passages on this test range in content from topic arguments to nonfiction narratives in a variety of subjects. The skills being evaluated include: increasing the clarity of argument; improving word choice; improving analysis of topics in social studies and science; changing sentence or word structure to increase organizational quality and impact of writing; and, fixing or improving sentence structure, word usage, and punctuation.[40]
The Writing and Language Test reports two subscores, each ranging from 1 to 15 points:[36]
- Expression of Ideas
- Standard English Conventions
Mathematics[]

The mathematics portion of the SAT is divided into two sections: Math Test – No Calculator and Math Test – Calculator. In total, the SAT math test is 80 minutes long and includes 58 questions: 45 multiple choice questions and 13 grid-in questions.[41] The multiple choice questions have four possible answers; the grid-in questions are free response and require the test taker to provide an answer.
- The Math Test – No Calculator section has 20 questions (15 multiple choice and 5 grid-in) and lasts 25 minutes.
- The Math Test – Calculator section has 38 questions (30 multiple choice and 8 grid-in) and lasts 55 minutes.
Several scores are provided to the test taker for the math test. A subscore (on a scale of 1 to 15) is reported for each of three categories of math content:
- "Heart of Algebra" (linear equations, systems of linear equations, and linear functions)
- "Problem Solving and Data Analysis" (statistics, modeling, and problem-solving skills)
- "Passport to Advanced Math" (non-linear expressions, radicals, exponentials and other topics that form the basis of more advanced math).
A test score for the math test is reported on a scale of 10 to 40, with an increment of 0.5, and a section score (equal to the test score multiplied by 20) is reported on a scale of 200 to 800.[42][43][44]
Calculator use[]
All scientific and most graphing calculators, including Computer Algebra System (CAS) calculators, are permitted on the SAT Math – Calculator section only. All four-function calculators are allowed as well; however, these devices are not recommended. All mobile phone and smartphone calculators, calculators with typewriter-like (QWERTY) keyboards, laptops and other portable computers, and calculators capable of accessing the Internet are not permitted.[45]
Research was conducted by the College Board to study the effect of calculator use on SAT I: Reasoning Test math scores. The study found that performance on the math section was associated with the extent of calculator use: those using calculators on about one third to one half of the items averaged higher scores than those using calculators more or less frequently. However, the effect was "more likely to have been the result of able students using calculators differently than less able students rather than calculator use per se."[46] There is some evidence that the frequent use of a calculator in school outside of the testing situation has a positive effect on test performance compared to those who do not use calculators in school.[47]
Style of questions[]
Most of the questions on the SAT, except for the optional essay and the grid-in math responses, are multiple choice; all multiple-choice questions have four answer choices, one of which is correct. Thirteen of the questions on the math portion of the SAT (about 22% of all the math questions) are not multiple choice.[48] They instead require the test taker to bubble in a number in a four-column grid.
All questions on each section of the SAT are weighted equally. For each correct answer, one raw point is added.[49] No points are deducted for incorrect answers. The final score is derived from the raw score; the precise conversion chart varies between test administrations.
| Section | Average Score 2020 (200 - 800)[2] | Time (Minutes) | Content |
|---|---|---|---|
| Mathematics | 523 | 25+55=80 | Number and operations; algebra and functions; geometry; statistics, probability, and data analysis |
| Evidence-Based Reading and Writing | 528 | 65+35=100 | Vocabulary, Critical reading, sentence-level reading, Grammar, usage, and diction. |
Logistics[]
Frequency[]
The SAT is offered seven times a year in the United States: in August, October, November, December, March, May, and June. For international students SAT is offered four times a year: in October, December, March and May (2020 exception: To cover worldwide May cancelation, an additional September exam was introduced, and August was made available to international test-takers as well). The test is typically offered on the first Saturday of the month for the October, November, December, May, and June administrations.[50][51] The test was taken by 2,198,460 high school graduates in the class of 2020.[2]
Candidates wishing to take the test may register online at the College Board's website or by mail at least three weeks before the test date.
Fees[]
The SAT costs US$49.50 (£39.50, €43.50) (US$64.50 with the optional essay), plus additional fees of over US$45 if testing outside the United States as of 2019.[8] The College Board makes fee waivers available for low income students. Additional fees apply for late registration, standby testing, registration changes, scores by telephone, and extra score reports (beyond the four provided for free).
Accommodation for candidates with disabilities[]
Students with verifiable disabilities, including physical and learning disabilities, are eligible to take the SAT with accommodations. The standard time increase for students requiring additional time due to learning disabilities or physical handicaps is time + 50%; time + 100% is also offered.
Scaled scores and percentiles[]
Students receive their online score reports approximately two to three weeks after test administration (longer for mailed, paper scores).[52] Included in the report is the total score (the sum of the two section scores, with each section graded on a scale of 200–800) and three subscores (in reading, writing, and analysis, each on a scale of 2–8) for the optional essay.[53] Students may also receive, for an additional fee, various score verification services, including (for select test administrations) the Question and Answer Service, which provides the test questions, the student's answers, the correct answers, and the type and difficulty of each question.[54]
In addition, students receive two percentile scores, each of which is defined by the College Board as the percentage of students in a comparison group with equal or lower test scores. One of the percentiles, called the "Nationally Representative Sample Percentile", uses as a comparison group all 11th and 12th graders in the United States, regardless of whether or not they took the SAT. This percentile is theoretical and is derived using methods of statistical inference. The second percentile, called the "SAT User Percentile", uses actual scores from a comparison group of recent United States students that took the SAT. For example, for the school year 2019–2020, the SAT User Percentile was based on the test scores of students in the graduating classes of 2018 and 2019 who took the SAT (specifically, the 2016 revision) during high school. Students receive both types of percentiles for their total score as well as their section scores.[53]
Percentiles for total scores (2019)[]
| Score, 400–1600 scale | SAT User | Nationally representative sample |
|---|---|---|
| 1600 | 99+ | 99+ |
| 1550 | 99+ | 99+ |
| 1500 | 98 | 99 |
| 1450 | 96 | 99 |
| 1400 | 94 | 97 |
| 1350 | 91 | 94 |
| 1300 | 86 | 91 |
| 1250 | 81 | 86 |
| 1200 | 74 | 81 |
| 1150 | 67 | 74 |
| 1100 | 58 | 67 |
| 1050 | 49 | 58 |
| 1000 | 40 | 48 |
| 950 | 31 | 38 |
| 900 | 23 | 29 |
| 850 | 16 | 21 |
| 800 | 10 | 14 |
| 750 | 5 | 8 |
| 700 | 2 | 4 |
| 650 | 1 | 1 |
| 640–400 | <1 | <1 |
Percentiles for total scores (2006)[]
The following chart summarizes the original percentiles used for the version of the SAT administered in March 2005 through January 2016. These percentiles used students in the graduating class of 2006 as the comparison group.[55][56]
| Percentile | Score 400–1600 scale, (official, 2006) |
Score, 600–2400 scale (official, 2006) |
|---|---|---|
| 99.93/99.98* | 1600 | 2400 |
| 99.5 | ≥1540 | ≥2280 |
| 99 | ≥1480 | ≥2200 |
| 98 | ≥1450 | ≥2140 |
| 97 | ≥1420 | ≥2100 |
| 93 | ≥1340 | ≥1990 |
| 88 | ≥1280 | ≥1900 |
| 81 | ≥1220 | ≥1800 |
| 72 | ≥1150 | ≥1700 |
| 61 | ≥1090 | ≥1600 |
| 48 | ≥1010 | ≥1500 |
| 36 | ≥950 | ≥1400 |
| 24 | ≥870 | ≥1300 |
| 15 | ≥810 | ≥1200 |
| 8 | ≥730 | ≥1090 |
| 4 | ≥650 | ≥990 |
| 2 | ≥590 | ≥890 |
| * The percentile of the perfect score was 99.98 on the 2400 scale and 99.93 on the 1600 scale. | ||
Percentiles for total scores (1984)[]
| Score (1984) | Percentile |
|---|---|
| 1600 | 99.9995 |
| 1550 | 99.983 |
| 1500 | 99.89 |
| 1450 | 99.64 |
| 1400 | 99.10 |
| 1350 | 98.14 |
| 1300 | 96.55 |
| 1250 | 94.28 |
| 1200 | 91.05 |
| 1150 | 86.93 |
| 1100 | 81.62 |
| 1050 | 75.31 |
| 1000 | 67.81 |
| 950 | 59.64 |
| 900 | 50.88 |
| 850 | 41.98 |
| 800 | 33.34 |
| 750 | 25.35 |
| 700 | 18.26 |
| 650 | 12.37 |
| 600 | 7.58 |
| 550 | 3.97 |
| 500 | 1.53 |
| 450 | 0.29 |
| 400 | 0.002 |
The version of the SAT administered before April 1995 had a very high ceiling. In any given year, only seven of the million test-takers scored above 1580. A score above 1580 was equivalent to the 99.9995 percentile.[58]
In 2015 the average score for the Class of 2015 was 1490 out of a maximum 2400. That was down 7 points from the previous class's mark and was the lowest composite score of the past decade.[16]
SAT–ACT score comparisons[]
The College Board and ACT, Inc., conducted a joint study of students who took both the SAT and the ACT between September 2004 (for the ACT) or March 2005 (for the SAT) and June 2006. Tables were provided to concord scores for students taking the SAT after January 2005 and before March 2016.[59][60] In May 2016, the College Board released concordance tables to concord scores on the SAT used from March 2005 through January 2016 to the SAT used since March 2016, as well as tables to concord scores on the SAT used since March 2016 to the ACT.[61]
In 2018, the College Board, in partnership with the ACT, introduced a new concordance table to better compare how a student would fare one test to another.[62] This is now considered the official concordance to be used by college professionals and is replacing the one from 2016. The new concordance no longer features the old SAT (out of 2,400), just the new SAT (out of 1,600) and the ACT (out of 36).
Elucidation[]
Preparation[]
Pioneered by Stanley Kaplan in 1946 with a 64-hour course,[63] SAT preparation has become a highly lucrative field.[64] Many companies and organizations offer test preparation in the form of books, classes, online courses, and tutoring.[65] The test preparation industry began almost simultaneously with the introduction of university entrance exams in the U.S. and flourished from the start.[66] Test-preparation scams are a genuine problem for parents and students.[67]
Nevertheless, the College Board maintains that the SAT is essentially uncoachable and research by the College Board and the National Association of College Admission Counseling suggests that tutoring courses result in an average increase of about 20 points on the math section and 10 points on the verbal section.[68] Like IQ scores, which are a strong correlate, SAT scores tend to be stable over time, meaning SAT preparation courses offer only a limited advantage.[69] An early meta-analysis (from 1983) found similar results and noted "the size of the coaching effect estimated from the matched or randomized studies (10 points) seems too small to be practically important."[70] Statisticians Ben Domingue and Derek C. Briggs examined data from the Education Longitudinal Survey of 2002 and found that the effects of coaching were only statistically significant for mathematics; moreover, coaching had a greater effect on certain students than others, especially those who have taken rigorous courses and those of high socioeconomic status.[71] A 2012 systematic literature review estimated a coaching effect of 23 and 32 points for the math and verbal tests, respectively.[66] A 2016 meta-analysis estimated the effect size to be 0.09 and 0.16 for the verbal and math sections respectively, although there was a large degree of heterogeneity.[72] Public misunderstanding of how to prepare for the SAT continues to be exploited by the preparation industry.[21]
The College Board announced a partnership with the non-profit organization Khan Academy to offer free test-preparation materials starting in the 2015–16 academic year to help level the playing field for students from low-income families.[18][16] Students may also bypass costly preparation programs using the more affordable official guide from the College Board and with solid studying habits.[73]
There is some evidence that taking the PSAT at least once can help students do better on the SAT.[74] According to cognitive scientist Sian Beilock, 'choking', or substandard performance on important occasions, such as taking the SAT, can be prevented by doing plenty of practice questions and proctored exams to improve procedural memory, making use of the booklet to write down intermediate steps to avoid overloading working memory, and writing a diary entry about one's anxieties on the day of the exam to enhance self-empathy and positive self-image.[75]
Predictive validity and powers[]
In 2009, education researchers Richard C. Atkinson and Saul Geiser from the University of California (UC) system argued that high school GPA is better than the SAT at predicting college grades regardless of high school type or quality.[76] It is the hope of some UC officials to increase the number of African- and Latino-American students attending and they plan to do so by casting doubt on the SAT and by decreasing the number of Asian-American students, who are heavily represented in the UC student body (29.5%) relative to their share of the population of California (13.6%).[77] However, their assertions on the predictive validity of the SAT has been contested by the UC academic senate.[77] In its 2020 report, the UC academic senate found that the SAT was better than high school GPA at predicting first year GPA, and just as good as high school GPA at predicting undergraduate GPA, first year retention, and graduation. This predictive validity was found to hold across demographic groups.[78] A series of College Board reports point to similar predictive validity across demographic groups.[79][80]
The SAT is correlated with intelligence and as such estimates individual differences. It does not, however, have anything to say about "effective cognitive performance," or what intelligent people do.[21] Nor does it measure non-cognitive traits associated with academic success such positive attitudes or conscientiousness.[21][81] Psychometricians Thomas R. Coyle and David R. Pillow showed in 2008 that the SAT predicts college GPA even after removing the general factor of intelligence (g), with which it is highly correlated.[82] A 2010 meta-analysis by researchers from the University of Minnesota offered evidence that standardized admissions tests such as the SAT predicted not only freshman GPA but also overall collegiate GPA.[81][69] A 2012 study from the same university using a multi-institutional data set revealed that even after controlling for socioeconomic status and high-school GPA, SAT scores were still as capable of predicting freshman GPA among university or college students.[83] A 2019 study with a sample size of around a quarter of a million students suggests that together, SAT scores and high-school GPA offer an excellent predictor of freshman collegiate GPA and second-year retention.[21] In 2018, psychologists Oren R. Shewach, Kyle D. McNeal, Nathan R. Kuncel, and Paul R. Sackett showed that both high-school GPA and SAT scores predict enrollment in advanced collegiate courses, even after controlling for Advanced Placement credits.[84][21]
Education economist Jesse M. Rothstein indicated in 2005 that high-school average SAT scores were better at predicting freshman university GPAs compared to individual SAT scores. In other words, a student's SAT scores were not as informative with regards to future academic success as his or her high school's average. In contrast, individual high-school GPAs were a better predictor of collegiate success than average high-school GPAs.[85][86] Furthermore, an admissions officer who failed to take average SAT scores into account would risk overestimating the future performance of a student from a low-scoring school and underestimating that of a student from a high-scoring school.[86]
Like other standardized tests like the ACT or the GRE, the SAT is a traditional method for assessing the academic aptitude of students who have had vastly different educational experiences and as such is focused on the common materials that the students could reasonably be expected to have encountered throughout the course of study. As such the mathematics section contains no materials above the precalculus level, for instance. Psychologist Raymond Cattell referred to this as testing for "historical" rather than "current" crystallized intelligence.[87] Psychologist Scott Barry Kaufman further noted that the SAT can only measure a snapshot of a person's performance at a particular moment in time.[88] Educational psychologists Jonathan Wai, David Lubinski, and Camilla Benbow observed that one way to increase the predictive validity of the SAT is by assessing the student's spatial reasoning ability, as the SAT at present does not contain any questions to that effect. Spatial reasoning skills are important for success in STEM.[89] A 2006 study led by psychometrician Robert Sternberg found that the ability of SAT scores and high-school GPAs to predict collegiate performance could further be enhanced by additional assessments of analytical, creative, and practical thinking.[90][91]
Experimental psychologist Meredith Frey noted that while advances in education research and neuroscience can help improve the ability to predict scholastic achievement in the future, the SAT remains a valuable tool in the meantime.[21]
Difficulty and relative weight[]
The SAT rigorously assesses students' mental stamina, memory, speed, accuracy, and capacity for abstract and analytical reasoning.[73] For American universities and colleges, standardized test scores are the most important factor in admissions, second only to high-school GPAs.[91] By international standards, however, the SAT is not that difficult.[92] For example, South Korea's College Scholastic Ability Test (CSAT) and Finland's Matriculation Examination are both longer, tougher, and count for more towards the admissibility of a student to university.[93] In many countries around the world, exams, including university entrance exams, are the sole deciding factor of admission; school grades are simply irrelevant.[92] In China and India, doing well on the Gaokao or the IIT-JEE, respectively, enhances the social status of the students and their families.[94]
In an article from 2012, educational psychologist Jonathan Wai argued that the SAT was too easy to be useful to the most competitive of colleges and universities, whose applicants typically had brilliant high-school GPAs and standardized test scores. Admissions officers therefore had the burden of differentiating the top scorers from one another, not knowing whether or not the students' perfect or near-perfect scores truly reflected their scholastic aptitudes. He suggested that the College Board make the SAT more difficult, which would raise the measurement ceiling of the test, allowing the top schools to identify the best and brightest among the applicants.[95] At that time, the College Board was already working on making the SAT tougher.[95] The changes were announced in 2014 and implemented in 2016.[96]
After realizing the June 2018 test was easier than usual, the College Board made adjustments resulting in lower-than-expected scores, prompting complaints from the students, though some understood this was to ensure fairness.[97] In its analysis of the incident, the Princeton Review supported the idea of curving grades, but pointed out that the test was incapable of distinguishing students in the 86th percentile (650 points) or higher in mathematics. The Princeton Review also noted that this particular curve was unusual in that it offered no cushion against careless or last-minute mistakes for high-achieving students.[98] The Review posted a similar blog post for the SAT of August 2019, when a similar incident happened and the College Board responded in the same manner, noting, "A student who misses two questions on an easier test should not get as good a score as a student who misses two questions on a hard test. Equating takes care of that issue." It also cautioned students against retaking the SAT immediately, for they might be disappointed again, and recommended that instead, they give themselves some "leeway" before trying again.[99]
Association with general cognitive ability[]
In a 2000 study, psychometrician Ann M. Gallagher and her colleagues found that only the top students made use of intuitive reasoning in solving problems encountered on the mathematics section of the SAT.[100] Cognitive psychologists Brenda Hannon and Mary McNaughton-Cassill discovered that having a good working memory, the ability of knowledge integration, and low levels of test anxiety predicts high performance on the SAT.[101]
Frey and Detterman (2004) investigated associations of SAT scores with intelligence test scores. Using an estimate of general mental ability, or g, based on the Armed Services Vocational Aptitude Battery, they found SAT scores to be highly correlated with g (r=.82 in their sample, .857 when adjusted for non-linearity) in their sample taken from a 1979 national probability survey. Additionally, they investigated the correlation between SAT results, using the revised and recentered form of the test, and scores on the Raven's Advanced Progressive Matrices, a test of fluid intelligence (reasoning), this time using a non-random sample. They found that the correlation of SAT results with scores on the Raven's Advanced Progressive Matrices was .483, they estimated that this correlation would have been about 0.72 were it not for the restriction of ability range in the sample. They also noted that there appeared to be a ceiling effect on the Raven's scores which may have suppressed the correlation.[102] Beaujean and colleagues (2006) have reached similar conclusions to those reached by Frey and Detterman.[103] Because the SAT is strongly correlated with general intelligence, it can be used as a proxy to measure intelligence, especially when the time-consuming traditional methods of assessment are unavailable.[21]
Psychometrician Linda Gottfredson noted that the SAT is effective at identifying intellectually gifted college-bound students.[104]
For decades many critics have accused designers of the verbal SAT of cultural bias as an explanation for the disparity in scores between poorer and wealthier test-takers,[105] with the biggest critics coming from the University of California system.[106][107] A famous example of this perceived bias in the SAT I was the oarsman–regatta analogy question, which is no longer part of the exam. The object of the question was to find the pair of terms that had the relationship most similar to the relationship between "runner" and "marathon". The correct answer was "oarsman" and "regatta". The choice of the correct answer was thought to have presupposed students' familiarity with rowing, a sport popular with the wealthy.[108] However, for psychometricians, analogy questions are a useful tool to gauge the mental abilities of students, for, even if the meaning of two words are unclear, a student with sufficiently strong analytical thinking skills should still be able to identify their relationships.[106] Analogy questions were removed in 2005.[109] In their place are questions that provide more contextual information should the students be ignorant of the relevant definition of a word, making it easier for them to guess the correct answer.[110]
Association with college or university majors and rankings[]
In 2010, physicists Stephen Hsu and James Schombert of the University of Oregon examined five years of student records at their school and discovered that the academic standing of students majoring in mathematics or physics (but not biology, English, sociology, or history) was strongly dependent on SAT mathematics scores. Students with an SAT mathematics scores below 600 were highly unlikely to excel as a mathematics or physics major. Nevertheless, they found no such patterns between the SAT verbal, or combined SAT verbal and mathematics and the other aforementioned subjects.[111][112]
In 2015, educational psychologist Jonathan Wai of Duke University analyzed average test scores from the Army General Classification Test in 1946 (10,000 students), the Selective Service College Qualification Test in 1952 (38,420), Project Talent in the early 1970s (400,000), the Graduate Record Examination between 2002 and 2005 (over 1.2 million), and the SAT Math and Verbal in 2014 (1.6 million). Wai identified one consistent pattern: those with the highest test scores tended to pick the physical sciences and engineering as their majors while those with the lowest were more likely to choose education and agriculture. (See figure below.)[112][113]

A 2020 paper by Laura H. Gunn and her colleagues examining data from 1389 institutions across the United States unveiled strong positive correlations between the average SAT percentiles of incoming students and the shares of graduates majoring in STEM and the social sciences. On the other hand, they found negative correlations between the former and the shares of graduates in psychology, theology, law enforcement, recreation and fitness.[114]
Various researchers have established that average SAT or ACT scores and college ranking in the U.S. News & World Report are highly correlated, almost 0.9.[21][115][116][b] Between the 1980s and the 2010s, the U.S. population grew while universities and colleges did not expand their capacities as substantially. As a result, admissions rates fell considerably, meaning it has become more difficult to get admitted to a school whose alumni include one's parents. On top of that, high-scoring students nowadays are much more likely to leave their hometowns in pursuit of higher education at prestigious institutions. Consequently, standardized tests, such as the SAT, are a more reliable measure of selectivity than admissions rates. Still, when Michael J. Petrilli and Pedro Enamorado analyzed the SAT composite scores (math and verbal) of incoming freshman classes of 1985 and 2016 of the top universities and liberal arts colleges in the United States, they found that the median scores of new students increased by 93 points for their sample, from 1216 to 1309. In particular, fourteen institutions saw an increase of at least 150 points, including the University of Notre-Dame (from 1290 to 1440, or 150 points) and Elon College (from 952 to 1192, or 240 points).[117]
Association with types of schooling[]
While there seems to be evidence that private schools tend to produce students who do better on standardized tests such as the ACT or the SAT, Keven Duncan and Jonathan Sandy showed, using data from the National Longitudinal Surveys of Youth, that when student characteristics, such as age, race, and sex (7%), family background (45%), school quality (26%), and other factors were taken into account, the advantage of private schools diminished by 78%. The researchers concluded that students attending private schools already had the attributes associated with high scores on their own.[118]
Association with educational and societal standings and outcomes[]

Research from the University of California system published in 2001 analyzing data of their undergraduates between Fall 1996 through Fall 1999, inclusive, found that the SAT II[c] was the single best predictor of collegiate success in the sense of freshman GPA, followed by high-school GPA, and finally the SAT I. After controlling for family income and parental education, the already low ability of the SAT to measure aptitude and college readiness fell sharply while the more substantial aptitude and college readiness measuring abilities of high school GPA and the SAT II each remained undiminished (and even slightly increased). The University of California system required both the SAT I and the SAT II from applicants to the UC system during the four academic years of the study.[119] This analysis is heavily publicized but is contradicted by many studies.[81]
There is evidence that the SAT is correlated with societal and educational outcomes,[88] including finishing a four-year university program.[120] A 2012 paper from psychologists at the University of Minnesota analyzing multi-institutional data sets suggested that the SAT maintained its ability to predict collegiate performance even after controlling for socioeconomic status (as measured by the combination of parental educational attainment and income) and high-school GPA. This means that SAT scores were not merely a proxy for measuring socioeconomic status, the researchers concluded.[83][121] This finding has been replicated and shown to hold across racial or ethnic groups and for both sexes.[21] Moreover, the Minnesota researchers found that the socioeconomic status distributions of the student bodies of the schools examined reflected those of their respective applicant pools.[83] Because of what it measures, a person's SAT scores cannot be separated from his or her socioeconomic background.[88]
In 2007, Rebecca Zwick and Jennifer Greif Green observed that a typical analysis did not take into account that heterogeneity of the high schools attended by the students in terms of not just the socioeconomic statuses of the student bodies but also the standards of grading. Zwick and Greif Green proceeded to show that when these were accounted for, the correlation between family socioeconomic status and classroom grades and rank increased whereas that between socioeconomic status and SAT scores fell. They concluded that school grades and SAT scores were similarly associated with family income.[85]
According to the College Board, in 2019, 56% of the test takers had parents with a university degree, 27% parents with no more than a high-school diploma, and about 9% who did not graduate from high school. (8% did not respond to the question.)[15]
Association with family structures[]
One of the proposed partial explanations for the gap between Asian- and European-American students in educational achievement, as measured for example by the SAT, is the general tendency of Asians to come from stable two-parent households.[122] In their 2018 analysis of data from the National Longitudinal Surveys of the Bureau of Labor Statistics, economists Adam Blandin, Christopher Herrington, and Aaron Steelman concluded that family structure played an important role in determining educational outcomes in general and SAT scores in particular. Families with only one parent who has no degrees were designated 1L, with two parents but no degrees 2L, and two parents with at least one degree between them 2H. Children from 2H families held a significant advantage of those from 1L families, and this gap grew between 1990 and 2010. Because the median SAT composite scores (verbal and mathematics) for 2H families grew by 20 points while those of 1L families fell by one point, the gap between them increased by 21 points, or a fifth of one standard deviation.[120]
Speaking to The Wall Street Journal, family sociologist W. Bradford Wilcox stated, "In the absence of SAT scores, which can pinpoint kids from difficult family backgrounds with great academic potential, family stability is likely to loom even larger in determining who makes it past the college finish line in California [whose public university system decided to stop requiring SAT and ACT scores for admissions in 2020]."[77]
Sex differences[]
In performance[]
In 2013, the American College Testing Board released a report stating that boys outperformed girls on the mathematics section of the test.[123] As of 2015, boys on average earned 32 points more than girls on the SAT mathematics section. Among those scoring in the 700-800 range, the male-to-female ratio was 1.6:1.[124] In 2014, psychologist Stephen Ceci and his collaborators found boys did better than girls across the percentiles. For example, a girl scoring in the top 10% of her sex would only be in the top 20% among the boys.[125][126] In 2010, psychologist Jonathan Wai and his colleagues showed, by analyzing data from three decades involving 1.6 million intellectually gifted seventh graders from the Duke University Talent Identification Program (TIP), that in the 1980s the gender gap in the mathematics section of the SAT among students scoring in the top 0.01% was 13.5:1 in favor of boys but dropped to 3.8:1 by the 1990s.[127][126] The dramatic sex ratio from the 1980s replicates a different study using a sample from Johns Hopkins University.[128] This ratio is similar to that observed for the ACT mathematics and science scores between the early 1990s and the late 2000s.[127] It remained largely unaltered at the end of the 2000s.[127][129] Sex differences in SAT mathematics scores began making themselves apparent at the level of 400 points and above.[127]
Some researchers point to evidence in support of greater male variability in spatial ability and mathematics. Greater male variability has been found in body weight, height, and cognitive abilities across cultures, leading to a larger number of males in the lowest and highest distributions of testing.[130] Consequently, a higher number of males are found in both the upper and lower extremes of the performance distributions of the mathematics sections of standardized tests such as the SAT, resulting in the observed gender discrepancy.[131][126][132] Paradoxically, this is at odds with the tendency of girls to have higher classroom scores than boys.[126]
On the other hand, Wai and his colleagues found that both sexes in the top 5% appeared to be more or less at parity when it comes to the verbal section of the SAT, though girls have gained a slight but noticeable edge over boys starting in the mid-1980s.[128] Psychologist David Lubinski, who conducted longitudinal studies of seventh grader who scored exceptionally high on the SAT, found a similar result. Girls generally had better verbal reasoning skills and boys mathematical skills.[132] This reflects other research on the cognitive ability of the general population rather than just the 95th percentile and up.[128][132]
Although aspects of testing such as stereotype are a concern, research on the predictive validity of the SAT has demonstrated that it tends to be a more accurate predictor of female GPA in university as compared to male GPA.[133]
In strategizing[]

Mathematical problems on the SAT can be broadly categorized into two groups: conventional and unconventional. Conventional problems can be handled routinely via familiar formulas or algorithms while unconventional ones require more creative thought in order to make unusual use of familiar methods of solution or to come up with the specific insights necessary for solving those problems. In 2000, ETS psychometrician Ann M. Gallagher and her colleagues analyzed how students handled disclosed SAT mathematics questions in self-reports. They found that for both sexes, the most favored approach was to use formulas or algorithms learned in class. When that failed, however, males were more likely than females to identify the suitable methods of solution. Previous research suggested that males were more likely to explore unusual paths to solution whereas females tended to stick to what they had learned in class and that females were more likely to identify the appropriate approaches if such required nothing more than mastery of classroom materials.[100]
In confidence[]
Older versions of the SAT did ask students how confident they were in their mathematical aptitude and verbal reasoning ability, specifically, whether or not they believed they were in the top 10%. Devin G. Pope analyzed data of over four million test takers from the late 1990s to the early 2000s and found that high scorers were more likely to be confident they were in the top 10%, with the top scorers reporting the highest levels of confidence. But there were some noticeable gaps between the sexes. Men tended to be much more confident in their mathematical aptitude then women. For example, among those who scored 700 on the mathematics section, 67% of men answered they believed they were in the top 10% whereas only 56% of women did the same. Women, on the other hand, were slightly more confident in their verbal reasoning ability then men.[134]
In glucose metabolism[]
Cognitive neuroscientists Richard Haier and Camilla Persson Benbow employed positron emission tomography (PET) scans to investigate the rate of glucose metabolism among students who have taken the SAT. They found that among men, those with higher SAT mathematics scores exhibited higher rates of glucose metabolism in the temporal lobes than those with lower scores, contradicting the brain-efficiency hypothesis. This trend, however, was not found among women, for whom the researchers could not find any cortical regions associated with mathematical reasoning. Both sexes scored the same on average in their sample and had the same rates of cortical glucose metabolism overall. According to Haier and Benbow, this is evidence for the structural differences of the brain between the sexes.[135][23]
Association with race and ethnicity[]


On average, black, Hispanic, and Native American students perform on the order of one standard deviation lower on the SAT than white and Asian students.[136][137][138][139] Mathematics appears to be the more difficult part of the exam.[15] In 1996, the black-white gap in the mathematics section was 0.91 standard deviations, but by 2020, it fell to 0.79.[140] In 2013, Asian Americans as a group scored 0.38 standard deviations higher than whites in the mathematics section.[122]

Some researchers believe that the difference in scores is closely related to the overall achievement gap in American society between students of different racial groups. This gap may be explainable in part by the fact that students of disadvantaged racial groups tend to go to schools that provide lower educational quality. This view is supported by evidence that the black-white gap is higher in cities and neighborhoods that are more racially segregated.[141] Other research cites poorer minority proficiency in key coursework relevant to the SAT (English and math), as well as peer pressure against students who try to focus on their schoolwork ("acting white").[142] Cultural issues are also evident among black students in wealthier households, with high achieving parents. John Ogbu, a Nigerian-American professor of anthropology, concluded that instead of looking to their parents as role models, black youth chose other models like rappers and did not make an effort to be good students.[143]
One set of studies has reported differential item functioning, namely, that some test questions function differently based on the racial group of the test taker, reflecting differences in ability to understand certain test questions or to acquire the knowledge required to answer them between groups. In 2003, Freedle published data showing that black students have had a slight advantage on the verbal questions that are labeled as difficult on the SAT, whereas white and Asian students tended to have a slight advantage on questions labeled as easy. Freedle argued that these findings suggest that "easy" test items use vocabulary that is easier to understand for white middle class students than for minorities, who often use a different language in the home environment, whereas the difficult items use complex language learned only through lectures and textbooks, giving both student groups equal opportunities to acquiring it.[144][145][146] The study was severely criticized by the ETS board, but the findings were replicated in a subsequent study by Santelices and Wilson in 2010.[147][148]
There is no evidence that SAT scores systematically underestimate future performance of minority students. However, the predictive validity of the SAT has been shown to depend on the dominant ethnic and racial composition of the college.[149] Some studies have also shown that African-American students under-perform in college relative to their white peers with the same SAT scores; researchers have argued that this is likely because white students tend to benefit from social advantages outside of the educational environment (for example, high parental involvement in their education, inclusion in campus academic activities, positive bias from same-race teachers and peers) which result in better grades.[150]
Christopher Jencks concludes that as a group, African Americans have been harmed by the introduction of standardized entrance exams such as the SAT. This, according to him, is not because the tests themselves are flawed, but because of labeling bias and selection bias; the tests measure the skills that African Americans are less likely to develop in their socialization, rather than the skills they are more likely to develop. Furthermore, standardized entrance exams are often labeled as tests of general ability, rather than of certain aspects of ability. Thus, a situation is produced in which African-American ability is consistently underestimated within the education and workplace environments, contributing in turn to selection bias against them which exacerbates underachievement.[150]

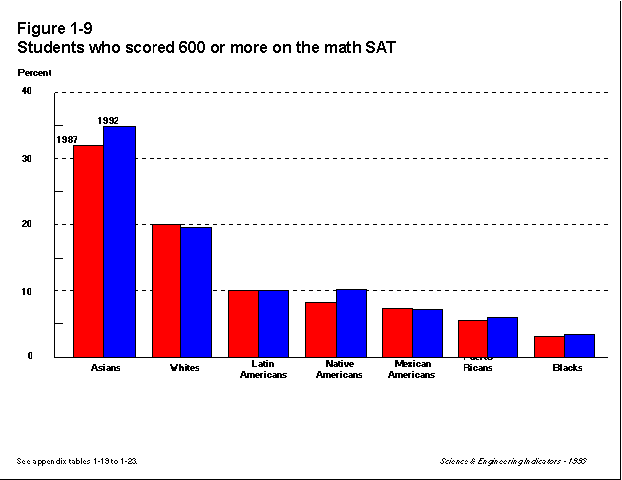
Among the major racial or ethnic groups of the United States, gaps in SAT mathematics scores are the greatest at the tails, with Hispanic and Latino Americans being the most likely to score at the lowest range and Asian Americans the highest. In addition, there is some evidence suggesting that if the test contains more questions of both the easy and difficult varieties, which would increase the variability of the scores, the gaps would be even wider. Given the distribution for Asians, for example, many could score higher than 800 if the test allowed them to. (See figure below.)[151]

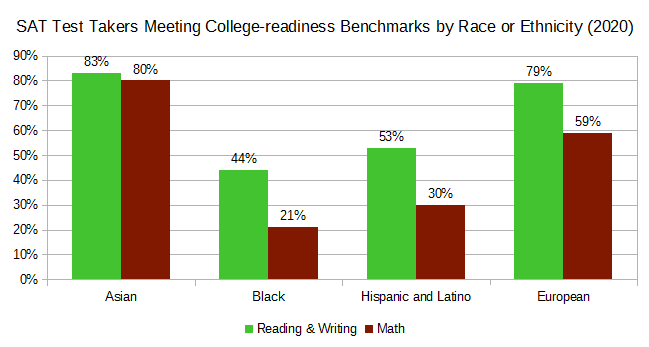
2020 was the year in which education worldwide was disrupted by the COVID-19 pandemic and indeed, the performance of students in the United States on standardized tests, such as the SAT, suffered. Yet the gaps persisted.[152] According to the College Board, in 2020, while 83% of Asian students met the benchmark of college readiness in reading and writing and 80% in mathematics, only 44% and 21% of black students did those respective categories. Among whites, 79% met the benchmark for reading and writing and 59% did mathematics. For Hispanics and Latinos, the numbers were 53% and 30%, respectively. (See figure below.)[140]
Test-taking population[]

By analyzing data from the National Center for Education Statistics, economists Ember Smith and Richard Reeves of the Brookings Institution deduced that the number of students taking the SAT increased at a rate faster than population and high-school graduation growth rates between 2000 and 2020. The increase was especially pronounced among Hispanics and Latinos. Even among whites, whose number of high-school graduates was shrinking, the number of SAT takers rose.[140] In 2015, for example, 1.7 million students took the SAT,[13] up from 1.6 million in 2013.[96] But in 2019, a record-breaking 2.2 million students took the exam, compared to 2.1 million in 2018, another record-breaking year.[15] The rise in the number of students taking the SAT was due in part to many school districts offering to administer the SAT during school days often at no further costs to the students.[15]
Psychologists Jean Twenge, W. Keith Campbell, and Ryne A. Sherman analyzed vocabulary test scores on the U.S. General Social Survey () and found that after correcting for education, the use of sophisticated vocabulary has declined between the mid-1970s and the mid-2010s across all levels of education, from below high school to graduate school. However, they cautioned against the use of SAT verbal scores to track the decline for while the College Board reported that SAT verbal scores had been decreasing, these scores were an imperfect measure of the vocabulary level of the nation as a whole because the test-taking demographic has changed and because more students took the SAT in the 2010s than in the 1970s, meaning there were more with limited ability who took it.[17]

Use in non-collegiate contexts[]
By high-IQ societies[]
Certain high IQ societies, like Mensa, Intertel, the Prometheus Society and the Triple Nine Society, use scores from certain years as one of their admission tests. For instance, Intertel accepts scores (verbal and math combined) of at least 1300 on tests taken through January 1994;[153] the Triple Nine Society accepts scores of 1450 or greater on SAT tests taken before April 1995, and scores of at least 1520 on tests taken between April 1995 and February 2005.[154]
By researchers[]
Because it is strongly correlated with general intelligence, the SAT has often been used as a proxy to measure intelligence by researchers, especially since 2004.[21] In particular, scientists studying mathematically gifted individuals have been using mathematics section of the SAT to identify subjects for their research.[22]
A growing body of research indicates that SAT scores can predict individual success decades into the future, for example in terms of income and occupational achievements.[21][27][69] A longitudinal study published in 2005 by educational psychologists Jonathan Wai, David Lubinski, and Camilla Benbow suggests that among the intellectually precocious (the top 1%), those with higher scores in the mathematics section of the SAT at the age of 12 were more likely to earn a PhD in the STEM fields, to have a publication, to register a patent, to secure university tenure.[155][112] Wai further showed that an individual's academic ability, as measured by the average SAT or ACT scores of the institution attended, predicted individual differences in income, even among the richest people of all, and being a member of the 'American elite', namely Fortune 500 CEOs, billionaires, federal judges, and members of Congress.[156][21] Wai concluded that the American elite was also the cognitive elite.[156] Gregory Park, Lubinski, and Benbow gave statistical evidence that intellectually gifted adolescents, as identified by SAT scores, could be expected to accomplish great feats of creativity in the future, both in the arts and in STEM.[157][21]
The SAT is sometimes given to students at age 12 or 13 by organizations such as the Study of Mathematically Precocious Youth (SMPY), Johns Hopkins Center for Talented Youth, and the Duke University Talent Identification Program (TIP) to select, study, and mentor students of exceptional ability, that is, those in the top one percent.[23] Among SMPY participants, those within the top quartile, as indicated by the SAT composite score (mathematics and verbal), were markedly more likely to have a doctoral degree, to have at least one publication in STEM, to earn income in the 95th percentile, to have at least one literary publication, or to register at least one patent than those in the bottom quartile. Duke TIP participants generally picked career tracks in STEM should they be stronger in mathematics, as indicated by SAT mathematics scores, or the humanities if they possessed greater verbal ability, as indicated by SAT verbal scores. For comparison, the bottom SMPY quartile is five times more likely than the average American to have a patent. Meanwhile, as of 2016, the shares doctorates among SMPY participants was 44% and Duke TIP 37%, compared to two percent among the general U.S. population.[24] Consequently, the notion that beyond a certain point, differences in cognitive ability as measured by standardized tests such as the SAT cease to matter is gainsaid by the evidence.[158]
In the 2010 paper which showed that the sex gap in SAT mathematics scores had dropped dramatically between the early 1980s and the early 1990s but had persisted for the next two decades or so, Wai and his colleagues argued that "sex differences in abilities in the extreme right tail should not be dismissed as no longer part of the explanation for the dearth of women in math-intensive fields of science."[127][159]
By employers[]
Cognitive ability is correlated with job training outcomes and job performance.[81][26] As such, some employers rely on SAT scores to assess the suitability of a prospective recruit,[27] especially if the person has limited work experience.[26] There is nothing new about this practice.[25] Major companies and corporations have spent princely sums on learning how to avoid hiring errors and have decided that standardized test scores are a valuable tool in deciding whether or not a person is fit for the job. In some cases, a company might need to hire someone to handle proprietary materials of its own making, such as computer software. But since the ability to work with such materials cannot be assessed via external certification, it makes sense for such a firm to rely on something that is a proxy of measuring general intelligence.[27] In other cases, a company—on Wall Street, for instance—does not care about academic background but needs to assess a prospective recruit's quantitative reasoning ability, and what makes standardized test scores necessary.[25]
Nevertheless, some top employers, such as Google, have eschewed the use of SAT or other standardized test scores unless the potential employee is a recent graduate because for their purposes, these scores "don't predict anything." Educational psychologist Jonathan Wai suggested this might be due to the inability of the SAT to differentiate the intellectual capacities of those at the extreme right end of the distribution of intelligence. Wai told The New York Times, "Today the SAT is actually too easy, and that's why Google doesn't see a correlation. Every single person they get through the door is a super-high scorer."[27]
Perception[]
Math–verbal achievement gap[]
In 2002, New York Times columnist Richard Rothstein argued that the U.S. math averages on the SAT and ACT continued their decade-long rise over national verbal averages on the tests while the averages verbal portions on the same tests were floundering.[160]
Optional SAT[]
In the 1960s and 1970s there was a movement to drop achievement scores. After a period of time, the countries, states and provinces that reintroduced them agreed that academic standards had dropped, students had studied less, and had taken their studying less seriously. They reintroduced the tests after studies and research concluded that the high-stakes tests produced benefits that outweighed the costs.[161]
In a 2001 speech to the American Council on Education, Richard C. Atkinson, the president of the University of California, urged the dropping admissions tests such as the SAT I but not achievement tests such as the SAT II[c] as a college admissions requirement.[162] Atkinson's critique of the predictive validity and powers of the SAT has been contested by the University of California academic senate.[77][78] In April 2020, the academic senate, which consisted of faculty members, voted 51-0 to restore the requirement of standardized test scores. However, the governing board overruled the senate. Because of the size of the Californian population, this decision might have an impact on U.S. higher education at large; schools looking to admit Californian students could have harder time.[91]
During the 2010s, over 1,230 American universities and colleges opted to stop requiring the SAT and the ACT for admissions, according to FairTest, an activist group opposing standardized entrance exams. Most, however, were small colleges, with the notable exceptions of the University of California system and the University of Chicago.[163] Also on the list are institutions catering to niche students, such as religious colleges, arts music conservatories, or nursing schools, and the majority of institutions in the Northeastern United States.[12] On one hand, making the SAT and the ACT optional for admissions enables schools to attract a larger pool of applicants of a variety of socioeconomic backgrounds.[11] On the other hand, letters of recommendation are not a good indicator of collegiate performance,[11] and grade inflation is a genuine problem.[11][91] If standardized tests were taken out of the picture, school grades would become more important, thereby incentivizing grade inflation.[164] In fact, grades in American high schools have been inflating by noticeable amounts due to pressure from parents, creating an apparent oversupply of high achievers that makes actual high-performing students struggle to stand out, especially if they are from low-income families.[165] Schools that made the SAT optional therefore lose an objective measure of academic aptitude and readiness,[21] and they will have to formulate a new methodology for admissions or to develop their own entrance exams.[163] Given that the selectivity of a school a student applies to is correlated with the resources of his or her high school—measured in terms of the availability of rigorous courses, such as AP classes, and the socioeconomic statuses of the student body—, making the SAT optional might exacerbate social inequities. Furthermore, since the costs of attending institutions of higher learning in the United States are high, eliminating the SAT requirement could make said institutions more likely to admit under-performing students, who might have to be removed for their low academic standing and who might be saddled with debt after attending.[21] Another criticism of making the SAT optional is that subjective measures of an applicant's suitability, such as application essays, could become more important, making it easier for the rich to gain admissions at the expense of the poor because their school counselors are more capable of writing good letters of recommendation and they could afford hire external help to boost their applications.[164]
Many parents and college-bound teenagers are skeptical of the process of "holistic admissions" because they think is rather vague and uncertain, as schools try to access characteristics not easily discerned via a number, hence the growth in the number of test takers attempting to make themselves more competitive even if this parallels an increase in the number of schools declaring it optional.[13][14] Holistic admissions notwithstanding, when merit-based scholarships are considered, standardized test scores might be the tiebreakers, as these are highly competitive.[14] Moreover, the most selective of schools have might have no better options than using standardized test scores in order to quickly prune the number of applications worth considering, for holistic admissions consume valuable time and other resources.[91]
In the wake of the COVID-19 pandemic, around 1,600 institutions decided to waive the requirement of the SAT or the ACT for admissions because it was challenging both to administer and to take these tests, resulting in many cancellations.[166] Some schools chose to make them optional on a temporary basis only, either for just one year, as in the case of Princeton University, or three, like the College of William & Mary. Others dropped the requirement completely.[13] Some schools extended their moratorium on standardized entrance exams in 2021.[91] This did not stop highly ambitious students from taking them, however,[13][14] as many parents and teenagers were skeptical of the "optional" status of university entrance exams,[14] leading to complaints of registration sites crashing in the summer of 2020.[166] On the other hand, the number of students applying to the more competitive of schools that had made SAT and ACT scores optional increased dramatically because the students thought they stood a chance.[91][167][168] At the same time, interest in lower-status schools that did the same thing dropped precipitously.[168] In all, 44% of students who used the Common Application—accepted by over 900 colleges and universities as of 2021—submitted SAT or ACT scores in 2020–21, down from 77% in 2019–20. Those who did submit their test scores tended to hail from high-income families, to have at least one university-educated parent, and to be white or Asian.[164]
Writing section[]
In 2005, MIT Writing Director Pavan Sreekireddy plotted essay length versus essay score on the new SAT from released essays and found a high correlation between them. After studying over 50 graded essays, he found that longer essays consistently produced higher scores. In fact, he argues that by simply gauging the length of an essay without reading it, the given score of an essay could likely be determined correctly over 90% of the time. He also discovered that several of these essays were full of factual errors; the College Board does not claim to grade for factual accuracy.
Perelman, along with the National Council of Teachers of English, also criticized the 25-minute writing section of the test for damaging standards of writing teaching in the classroom. They say that writing teachers training their students for the SAT will not focus on revision, depth, accuracy, but will instead produce long, formulaic, and wordy pieces.[169] "You're getting teachers to train students to be bad writers", concluded Perelman.[170]
On January 19, 2021, the College Board announced that the SAT would no longer offer the optional essay section after the June 2021 administration.[19][20]
History[]
| Year of exam |
Reading /Verbal Score |
Math Score |
| 1972 | 530 | 509 |
| 1973 | 523 | 506 |
| 1974 | 521 | 505 |
| 1975 | 512 | 498 |
| 1976 | 509 | 497 |
| 1977 | 507 | 496 |
| 1978 | 507 | 494 |
| 1979 | 505 | 493 |
| 1980 | 502 | 492 |
| 1981 | 502 | 492 |
| 1982 | 504 | 493 |
| 1983 | 503 | 494 |
| 1984 | 504 | 497 |
| 1985 | 509 | 500 |
| 1986 | 509 | 500 |
| 1987 | 507 | 501 |
| 1988 | 505 | 501 |
| 1989 | 504 | 502 |
| 1990 | 500 | 501 |
| 1991 | 499 | 500 |
| 1992 | 500 | 501 |
| 1993 | 500 | 503 |
| 1994 | 499 | 504 |
| 1995 | 504 | 506 |
| 1996 | 505 | 508 |
| 1997 | 505 | 511 |
| 1998 | 505 | 512 |
| 1999 | 505 | 511 |
| 2000 | 505 | 514 |
| 2001 | 506 | 514 |
| 2002 | 504 | 516 |
| 2003 | 507 | 519 |
| 2004 | 508 | 518 |
| 2005 | 508 | 520 |
| 2006 | 503 | 518 |
| 2007 | 502 | 515 |
| 2008 | 502 | 515 |
| 2009 | 501 | 515 |
| 2010 | 501 | 516 |
| 2011 | 497 | 514 |
| 2012 | 496 | 514 |
| 2013 | 496 | 514 |
| 2014 | 497 | 513 |
| 2015 | 495 | 511 |
| 2016 | 494 | 508 |
| 2017 | 533 | 527 |
| 2018 | 536 | 531 |
| 2019 | 531 | 528 |
| 2020 | 528 | 523 |
In the late nineteenth century, elite colleges and universities had their own entrance exams and they required candidates to travel to the school to take the tests.[91] To better organize matters, the College Board, a consortium of colleges in the northeastern United States, was formed in 1900 to establish a nationally administered, uniform set of essay tests based on the curricula of the boarding schools that typically provided graduates to the colleges of the Ivy League and Seven Sisters, among others.[173][174] The first College Board exam—covering mathematics, the physical sciences, history, languages, and other subjects—was administered in 1901 to no more than 1,000 candidates.[91]
In the same time period, Lewis Terman and others began to promote the use of tests such as Alfred Binet's in American schools. Terman in particular thought that such tests could identify an innate "intelligence quotient" (IQ) in a person. The results of an IQ test could then be used to find an elite group of students who would be given the chance to finish high school and go on to college.[173] By the mid-1920s, the increasing use of IQ tests, such as the Army Alpha test administered to recruits in World War I, led the College Board to commission the development of the SAT. The commission, headed by eugenicist Carl Brigham, argued that the test predicted success in higher education by identifying candidates primarily on the basis of intellectual promise rather than on specific accomplishment in high school subjects.[174] Brigham "created the test to uphold a racial caste system. He advanced this theory of standardized testing as a means of upholding racial purity in his book A Study of American Intelligence. The tests, he wrote, would prove the racial superiority of white Americans and prevent 'the continued propagation of defective strains in the present population'—chiefly, the 'infiltration of white blood into the Negro.'"[175] By 1930, however, Brigham would repudiate his own conclusions, writing that "comparative studies of various national and racial groups may not be made with existing tests"[176] and that SAT scores couldn't reflect some innate, genetically-based ability, but instead would be "a composite including schooling, family background, familiarity with English and everything else, relevant and irrelevant."[175] In 1934, James Conant and Henry Chauncey used the SAT as a means to identify recipients for scholarships to Harvard University. Specifically, Conant wanted to find students, other than those from the traditional northeastern private schools, that could do well at Harvard. The success of the scholarship program and the advent of World War II led to the end of the College Board essay exams and to the SAT being used as the only admissions test for College Board member colleges.[173]
The SAT rose in prominence after World War II due to several factors. Machine-based scoring of multiple-choice tests taken by pencil had made it possible to rapidly process the exams.[176] The G.I. Bill produced an influx of millions of veterans into higher education.[176][177] The formation of the Educational Testing Service (ETS) also played a significant role in the expansion of the SAT beyond the roughly fifty colleges that made up the College Board at the time.[178] The ETS was formed in 1947 by the College Board, Carnegie Foundation for the Advancement of Teaching, and the American Council on Education, to consolidate respectively the operations of the SAT, the GRE, and the achievement tests developed by Ben Wood for use with Conant's scholarship exams.[176] The new organization was to be philosophically grounded in the concepts of open-minded, scientific research in testing with no doctrine to sell and with an eye toward public service.[179] The ETS was chartered after the death of Brigham, who had opposed the creation of such an entity. Brigham felt that the interests of a consolidated testing agency would be more aligned with sales or marketing than with research into the science of testing.[176] It has been argued that the interest of the ETS in expanding the SAT in order to support its operations aligned with the desire of public college and university faculties to have smaller, diversified, and more academic student bodies as a means to increase research activities.[173] In 1951, about 80,000 SATs were taken; in 1961, about 800,000; and by 1971, about 1.5 million SATs were being taken each year.[180]
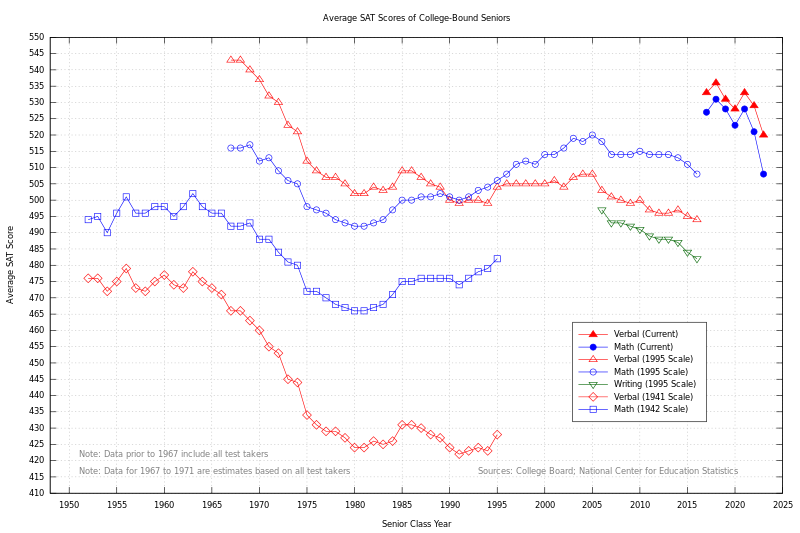
During the 2010s, there was concern over the continued decline of SAT scores,[16][15] which might be due to the expansion of the test-taking population.[15][17] (See graph below.)
A timeline of notable events in the history of the SAT follows.
1901 essay exams[]
On June 17, 1901, the first exams of the College Board were administered to 973 students across 67 locations in the United States, and two in Europe. Although those taking the test came from a variety of backgrounds, approximately one third were from New York, New Jersey, or Pennsylvania. The majority of those taking the test were from private schools, academies, or endowed schools. About 60% of those taking the test applied to Columbia University. The test contained sections on English, French, German, Latin, Greek, history, geography, political science, biology, mathematics, chemistry, and physics. The test was not multiple choice, but instead was evaluated based on essay responses as "excellent", "good", "doubtful", "poor" or "very poor".[181]
1926 test[]
The first administration of the SAT occurred on June 23, 1926, when it was known as the Scholastic Aptitude Test.[107][182] This test, prepared by a committee headed by eugenicist and Princeton psychologist Carl Campbell Brigham, had sections of definitions, arithmetic, classification, artificial language, antonyms, number series, analogies, logical inference, and paragraph reading. It was administered to over 8,000 students at over 300 test centers. Men composed 60% of the test-takers. Slightly over a quarter of males and females applied to Yale University and Smith College.[182] The test was paced rather quickly, test-takers being given only a little over 90 minutes to answer 315 questions.[107] The raw score of each participating student was converted to a score scale with a mean of 500 and a standard deviation of 100. This scale was effectively equivalent to a 200 to 800 scale, although students could score more than 800 and less than 200.[176]
1928 and 1929 tests[]
In 1928, the number of sections on the SAT was reduced to seven, and the time limit was increased to slightly under two hours. In 1929, the number of sections was again reduced, this time to six. These changes were designed in part to give test-takers more time per question. For these two years, all of the sections tested verbal ability: math was eliminated entirely from the SAT.[107]
1930 test and 1936 changes[]
In 1930 the SAT was first split into the verbal and math sections, a structure that would continue through 2004. The verbal section of the 1930 test covered a more narrow range of content than its predecessors, examining only antonyms, double definitions (somewhat similar to sentence completions), and paragraph reading. In 1936, analogies were re-added. Between 1936 and 1946, students had between 80 and 115 minutes to answer 250 verbal questions (over a third of which were on antonyms). The mathematics test introduced in 1930 contained 100 free response questions to be answered in 80 minutes and focused primarily on speed. From 1936 to 1941, like the 1928 and 1929 tests, the mathematics section was eliminated entirely. When the mathematics portion of the test was re-added in 1942, it consisted of multiple-choice questions.[107]
1941 and 1942 score scales[]
Until 1941, the scores on all SATs had been scaled to a mean of 500 with a standard deviation of 100. Although one test-taker could be compared to another for a given test date, comparisons from one year to another could not be made. For example, a score of 500 achieved on an SAT taken in one year could reflect a different ability level than a score of 500 achieved in another year. By 1940, it had become clear that setting the mean SAT score to 500 every year was unfair to those students who happened to take the SAT with a group of higher average ability.[183]
In order to make cross-year score comparisons possible, in April 1941 the SAT verbal section was scaled to a mean of 500, and a standard deviation of 100, and the June 1941 SAT verbal section was equated (linked) to the April 1941 test. All SAT verbal sections after 1941 were equated to previous tests so that the same scores on different SATs would be comparable. Similarly, in June 1942 the SAT math section was equated to the April 1942 math section, which itself was linked to the 1942 SAT verbal section, and all SAT math sections after 1942 would be equated to previous tests. From this point forward, SAT mean scores could change over time, depending on the average ability of the group taking the test compared to the roughly 10,600 students taking the SAT in April 1941. The 1941 and 1942 score scales would remain in use until 1995.[183][184]
1946 test and associated changes[]
Paragraph reading was eliminated from the verbal portion of the SAT in 1946, and replaced with reading comprehension, and "double definition" questions were replaced with sentence completions. Between 1946 and 1957, students were given 90 to 100 minutes to complete 107 to 170 verbal questions. Starting in 1958, time limits became more stable, and for 17 years, until 1975, students had 75 minutes to answer 90 questions. In 1959, questions on data sufficiency were introduced to the mathematics section and then replaced with quantitative comparisons in 1974. In 1974, both verbal and math sections were reduced from 75 minutes to 60 minutes each, with changes in test composition compensating for the decreased time.[107]
1960s and 1970s score declines[]
From 1926 to 1941, scores on the SAT were scaled to make 500 the mean score on each section. In 1941 and 1942, SAT scores were standardized via test equating, and as a consequence, average verbal and math scores could vary from that time forward.[183] In 1952, mean verbal and math scores were 476 and 494, respectively, and scores were generally stable in the 1950s and early 1960s. However, starting in the mid-1960s and continuing until the early 1980s, SAT scores declined: the average verbal score dropped by about 50 points, and the average math score fell by about 30 points. By the late 1970s, only the upper third of test takers were doing as well as the upper half of those taking the SAT in 1963. From 1961 to 1977, the number of SATs taken per year doubled, suggesting that the decline could be explained by demographic changes in the group of students taking the SAT. Commissioned by the College Board, an independent study of the decline found that most (up to about 75%) of the test decline in the 1960s could be explained by compositional changes in the group of students taking the test; however, only about 25 percent of the 1970s decrease in test scores could similarly be explained.[180] Later analyses suggested that up to 40 percent of the 1970s decline in scores could be explained by demographic changes, leaving unknown at least some of the reasons for the decline.[185]
1994 changes[]
In early 1994, substantial changes were made to the SAT.[186] Antonyms were removed from the verbal section in order to make rote memorization of vocabulary less useful. Also, the fraction of verbal questions devoted to passage-based reading material was increased from about 30% to about 50%, and the passages were chosen to be more like typical college-level reading material, compared to previous SAT reading passages. The changes for increased emphasis on analytical reading were made in response to a 1990 report issued by a commission established by the College Board. The commission recommended that the SAT should, among other things, "approximate more closely the skills used in college and high school work".[107] A mandatory essay had been considered as well for the new version of the SAT; however, criticism from minority groups, as well as a concomitant increase in the cost of the test necessary to grade the essay, led the College Board to drop it from the planned changes.[187]
Major changes were also made to the SAT mathematics section at this time, due in part to the influence of suggestions made by the National Council of Teachers of Mathematics. Test-takers were now permitted to use calculators on the math sections of the SAT. Also, for the first time since 1935, the SAT would now include some math questions that were not multiple choice, and would require students to supply the answers for those questions. Additionally, some of these "student-produced response" questions could have more than one correct answer. The tested mathematics content on the SAT was expanded to include concepts of slope of a line, probability, elementary statistics including median and mode, and problems involving counting.[107]
1995 recentering (raising mean score back to 500)[]
By the early 1990s, average combined SAT scores were around 900 (typically, 425 on the verbal and 475 on the math). The average scores on the 1994 modification of the SAT I were similar: 428 on the verbal and 482 on the math.[188] SAT scores for admitted applicants to highly selective colleges in the United States were typically much higher. For example, the score ranges of the middle 50% of admitted applicants to Princeton University in 1985 were 600 to 720 (verbal) and 660 to 750 (math).[189] Similarly, median scores on the modified 1994 SAT for freshmen entering Yale University in the fall of 1995 were 670 (verbal) and 720 (math).[190] For the majority of SAT takers, however, verbal and math scores were below 500: In 1992, half of the college-bound seniors taking the SAT were scoring between 340 and 500 on the verbal section and between 380 and 560 on the math section, with corresponding median scores of 420 and 470, respectively.[191]
The drop in SAT verbal scores, in particular, meant that the usefulness of the SAT score scale (200 to 800) had become degraded. At the top end of the verbal scale, significant gaps were occurring between raw scores and uncorrected scaled scores: a perfect raw score no longer corresponded to an 800, and a single omission out of 85 questions could lead to a drop of 30 or 40 points in the scaled score. Corrections to scores above 700 had been necessary to reduce the size of the gaps and to make a perfect raw score result in an 800. At the other end of the scale, about 1.5 percent of test-takers would have scored below 200 on the verbal section if that had not been the reported minimum score. Although the math score averages were closer to the center of the scale (500) than the verbal scores, the distribution of math scores was no longer well approximated by a normal distribution. These problems, among others, suggested that the original score scale and its reference group of about 10,000 students taking the SAT in 1941 needed to be replaced.[183]
Beginning with the test administered in April 1995, the SAT score scale was recentered to return the average math and verbal scores close to 500. Although only 25 students had received perfect scores of 1600 in all of 1994, 137 students taking the April test scored 1600.[192] The new scale used a reference group of about one million seniors in the class of 1990: the scale was designed so that the SAT scores of this cohort would have a mean of 500 and a standard deviation of 110. Because the new scale would not be directly comparable to the old scale, scores awarded in April 1995 and later were officially reported with an "R" (for example, "560R") to reflect the change in scale, a practice that was continued until 2001.[183] Scores awarded before April 1995 may be compared to those on the recentered scale by using official College Board tables. For example, verbal and math scores of 500 received before 1995 correspond to scores of 580 and 520, respectively, on the 1995 scale.[193]
1995 re-centering controversy[]
Certain educational organizations viewed the SAT re-centering initiative as an attempt to stave off international embarrassment in regards to continuously declining test scores, even among top students. As evidence, it was presented that the number of pupils who scored above 600 on the verbal portion of the test had fallen from a peak of 112,530 in 1972 to 73,080 in 1993, a 36% backslide, despite the fact that the total number of test-takers had risen by over 500,000.[194]
2002 changes – Score Choice[]
Since 1993, using a policy referred to as "Score Choice", students taking the SAT-II subject exams were able to choose whether or not to report the resulting scores to a college to which the student was applying. In October 2002, the College Board dropped the Score Choice option for SAT-II exams, matching the score policy for the traditional SAT tests that required students to release all scores to colleges.[195] The College Board said that, under the old score policy, many students who waited to release scores would forget to do so and miss admissions deadlines. It was also suggested that the old policy of allowing students the option of which scores to report favored students who could afford to retake the tests.[196]
2005 changes, including a new 2400-point score[]
In 2005, the test was changed again, largely in response to criticism by the University of California system.[109] In order to have the SAT more closely reflect high school curricula, certain types of questions were eliminated, including analogies from the verbal section and quantitative comparison items from the math section.[107] A new writing section, with an essay, based on the former SAT II Writing Subject Test, was added,[197] in part to increase the chances of closing the opening gap between the highest and midrange scores. The writing section reported a multiple-choice subscore that ranged from 20 to 80 points.[198] Other factors included the desire to test the writing ability of each student; hence the essay. The essay section added an additional maximum 800 points to the score, which increased the new maximum score to 2400.[199] The "New SAT" was first offered on March 12, 2005, after the last administration of the "old" SAT in January 2005. The mathematics section was expanded to cover three years of high school mathematics. To emphasize the importance of reading, the verbal section's name was changed to the Critical Reading section.[107]
Scoring problems of October 2005 tests[]
In March 2006, it was announced that a small percentage of the SATs taken in October 2005 had been scored incorrectly due to the test papers' being moist and not scanning properly and that some students had received erroneous scores.[200] The College Board announced they would change the scores for the students who were given a lower score than they earned, but at this point many of those students had already applied to colleges using their original scores. The College Board decided not to change the scores for the students who were given a higher score than they earned. A lawsuit was filed in 2006 on behalf of the 4,411 students who received an incorrect score on the SAT.[201] The class-action suit was settled in August 2007, when the College Board and Pearson Educational Measurement, the company that scored the SATs, announced they would pay $2.85 million into a settlement fund. Under the agreement, each student could either elect to receive $275 or submit a claim for more money if he or she felt the damage was greater.[202] A similar scoring error occurred on a secondary school admission test in 2010–2011, when the ERB (Educational Records Bureau) announced, after the admission process was over, that an error had been made in the scoring of the tests of 2010 students (17%), who had taken the Independent School Entrance Examination for admission to private secondary schools for 2011. Commenting on the effect of the error on students' school applications in The New York Times, David Clune, President of the ERB stated "It is a lesson we all learn at some point—that life isn't fair."[203]
2008 changes[]
As part of an effort to “reduce student stress and improve the test-day experience", in late 2008 the College Board announced that the Score Choice option, recently dropped for SAT subject exams, would be available for both the SAT subject tests and the SAT starting in March 2009. At the time, some college admissions officials agreed that the new policy would help to alleviate student test anxiety, while others questioned whether the change was primarily an attempt to make the SAT more competitive with the ACT, which had long had a comparable score choice policy.[204] Recognizing that some colleges would want to see the scores from all tests taken by a student, under this new policy, the College Board would encourage but not force students to follow the requirements of each college to which scores would be sent.[205] A number of highly selective colleges and universities, including Yale, the University of Pennsylvania, Cornell, and Stanford, rejected the Score Choice option at the time.[206] Since then, Cornell,[207] University of Pennsylvania,[208] and Stanford[209] have all adopted Score Choice, but Yale[210] continues to require applicants to submit all scores. Others, such as MIT and Harvard, allow students to choose which scores they submit, and use only the highest score from each section when making admission decisions. Still others, such as Oregon State University and University of Iowa, allow students to choose which scores they submit, considering only the test date with the highest combined score when making admission decisions.[211]
2012 changes[]
Beginning in the fall of 2012, test takers were required to submit a current, recognizable photo during registration. In order to be admitted to their designated test center, students were required to present their photo admission ticket—or another acceptable form of photo ID—for comparison to the one submitted by the student at the time of registration. The changes were made in response to a series of cheating incidents, primarily at high schools in Long Island, New York, in which high-scoring test takers were using fake photo IDs to take the SAT for other students.[212] In addition to the registration photo stipulation, test takers were required to identify their high school, to which their scores, as well as the submitted photos, would be sent. In the event of an investigation involving the validity of a student's test scores, their photo may be made available to institutions to which they have sent scores. Any college that is granted access to a student's photo is first required to certify that the student has been admitted to the college requesting the photo.[213]
2016 changes, including the return to a 1600-point score[]
On March 5, 2014, the College Board announced its plan to redesign the SAT in order to link the exam more closely to the work high school students encounter in the classroom.[214] The new exam was administered for the first time in March 2016.[215] Some of the major changes were: an emphasis on the use of evidence to support answers, a shift away from obscure vocabulary to words that students are more likely to encounter in college and career, an optional essay, questions having four rather than five answer options, and the removal of penalty for wrong answers (rights-only scoring).[216][217] The Critical Reading section was replaced with the new Evidence-Based Reading and Writing section (the Reading Test and the Writing and Language Test).[218] The scope of mathematics content was narrowed to include fewer topics, including linear equations, ratios, and other precalculus topics. The essay score was separated from the final score, and institutions could choose whether or not to consider it. As a result of these changes, the highest score was returned to 1600. These modifications were the first major redesign to the structure of the test since 2005.[96] As the test no longer deducts points for wrong answers, the numerical scores and the percentiles appeared to have increased after the new SAT was unveiled in 2016. However, this does not necessarily mean students came better prepared.[217]
To combat the perceived advantage of costly test preparation courses, the College Board announced a new partnership with Khan Academy to offer free online practice problems and instructional videos.[214]
2019 introduction and abandonment of the 'Adversity Score' and launching of 'Landscape'[]
In May 2019, the College Board announced that it would calculate each SAT taker's "Adversity Score" using factors such as the proportion of students in a school district receiving free or subsidized lunch or the level of crime in that neighborhood. The higher the score, the more adversity the student faced.[219] However, this triggered a strong backlash from the general public as people were skeptical of how complex information can be conveyed with a single number[219] and were concerned that it might be politically weaponized.[220] The College Board thus abandoned the Adversity Score and instead created a new tool called 'Landscape' to provide the same sort of details to admissions officers using government information but without calculating a score.[219]
2021 changes[]
In the wake of the COVID-19 pandemic, which made administering and taking the tests difficult, on January 19, 2021, the College Board announced plans to discontinue the optional SAT essay following the June 2021 administration.[221][166] While some administrations were canceled,[166] others continued with precautionary measures such as requirements of temperature checks, enhanced ventilation, higher ceilings, physical distancing, and face masks.[222] The College Board also announced the immediate discontinuation of the SAT Subject Tests in the United States, and the same internationally after the June 2021 administration.[166]
Name changes[]
The SAT has been renamed several times since its introduction in 1926. It was originally known as the Scholastic Aptitude Test.[223][107] In 1990, a commission set up by the College Board to review the proposed changes to the SAT program recommended that the meaning of the initialism SAT be changed to "Scholastic Assessment Test" because a "test that integrates measures of achievement as well as developed ability can no longer be accurately described as a test of aptitude".[224][225] In 1993, the College Board changed the name of the test to SAT I: Reasoning Test; at the same time, the name of the Achievement Tests was changed to SAT II: Subject Tests.[223] The Reasoning Test and Subject Tests were to be collectively known as the Scholastic Assessment Tests. According to the president of the College Board at the time, the name change was meant "to correct the impression among some people that the SAT measures something that is innate and impervious to change regardless of effort or instruction."[226] The new SAT debuted in March 1994, and was referred to as the Scholastic Assessment Test by major news organizations.[186][227] However, in 1997, the College Board announced that the SAT could not properly be called the Scholastic Assessment Test, and that the letters SAT did not stand for anything.[228] In 2004, the Roman numeral in SAT I: Reasoning Test was dropped, making SAT Reasoning Test the name of the SAT.[223] The "Reasoning Test" portion of the name was eliminated following the exam's 2016 redesign; it is now simply called the SAT.[229]
Reuse of old SAT exams[]
The College Board has been accused of completely reusing old SAT papers previously given in the United States.[230] The recycling of questions from previous exams has been exploited to allow for cheating on exams and impugned the validity of some students' test scores, according to college officials. Test preparation companies in Asia have been found to provide test questions to students within hours of a new SAT exam's administration.[231][232]
On August 25, 2018, the SAT test given in America was discovered to be a recycled October 2017 international SAT test given in China. The leaked PDF file was on the internet before the August 25, 2018 exam.[233]
See also[]
- ACT (test), a college entrance exam, competitor to the SAT
- College admissions in the United States
- List of admissions tests
- PSAT/NMSQT
- SAT Subject Tests
Notes[]
- ^ In 2020, the SAT was also offered on an additional September date due to the COVID-19 pandemic.[1]
- ^ Depending on the author, there might be a negative sign. This comes from the fact that the higher the rank, the smaller the number of that rank.
- ^ Jump up to: a b Known as the SAT Subject Tests since 2005, discontinued in 2021.
References[]
- ^ Goldberg, Emma (2020-09-27). "Put Down Your No. 2 Pencils. But Not Your Face Mask". The New York Times. ISSN 0362-4331. Retrieved 2020-12-04.
- ^ Jump up to: a b c "2020 SAT Suite of Assessments Annual Report" (PDF). College Board.
- ^ "Fees And Costs". The College Board. Archived from the original on October 10, 2014. Retrieved October 13, 2014.
- ^ "Frequently Asked Questions About ETS". ETS. Archived from the original on July 15, 2014. Retrieved June 6, 2014.
- ^ "'Massive' breach exposes hundreds of questions for upcoming SAT exams". Reuters. Archived from the original on 19 July 2017. Retrieved 20 July 2017.
- ^ Baird, Katherine (2012). Trapped in Mediocrity: Why Our Schools Aren't World-Class and What We Can Do About It. Lanham: Rowman and Littlefield Publishers. "And a separate process that began in 1926 was complete by 1942: the much easier SAT—a test not aligned to any particular curriculum and thus better suited to a nation where high school students did not take a common curriculum—replaced the old college boards as the nations's college entrance exam. This broke the once tight link between academic coursework and college admission, a break that remains to this day."
- ^ Lewin, Tamar (March 5, 2014). "A New SAT Aims to Realign With Schoolwork". The New York Times. Archived from the original on May 13, 2014. Retrieved May 14, 2014.
He said he also wanted to make the test reflect more closely what students did in high school
- ^ Jump up to: a b "SAT Registration Fees". College Board. 15 May 2015. Archived from the original on September 6, 2015. Retrieved January 7, 2017.
- ^ O'Shaughnessy, Lynn (July 26, 2009). "The Other Side of 'Test Optional'". The New York Times. p. 6. Archived from the original on November 19, 2018. Retrieved June 22, 2011.
- ^ Capuzzi Simon, Cecilia (November 1, 2015). "The Test-Optional Surge". The New York Times. Archived from the original on August 12, 2019. Retrieved August 12, 2019.
- ^ Jump up to: a b c d Farmer, Angela; Wai, Jonathan (September 21, 2020). "Many colleges have gone test-optional – here's how that could change the way students are admitted". The Conversation. Retrieved February 2, 2020.
- ^ Jump up to: a b Strauss, Valerie. "A record number of colleges drop SAT/ACT admissions requirement amid growing disenchantment with standardized tests". The Washington Post. Retrieved February 2, 2021.
- ^ Jump up to: a b c d e Selingo, Jeffrey (September 16, 2020). "The SAT and the ACT Will Probably Survive the Pandemic—Thanks to Students". The Atlantic. Archived from the original on February 3, 2021. Retrieved February 2, 2021.
- ^ Jump up to: a b c d e Quintana, Chris (December 29, 2020). "Colleges say SAT, ACT score is optional for application during COVID-19, but families don't believe them". USA Today. Retrieved February 5, 2021.
- ^ Jump up to: a b c d e f g h Hobbs, Tawnell D. (September 24, 2019). "SAT Scores Fall as More Students Take the Test". The Wall Street Journal. Archived from the original on November 28, 2020. Retrieved February 2, 2021.
- ^ Jump up to: a b c d Anderson, Nick (September 3, 2015). "SAT scores at lowest level in 10 years, fueling worries about high schools". The Washington Post. Retrieved September 17, 2020.
- ^ Jump up to: a b c d Twenge, Jean; Campbell, W. Keith; Sherman, Ryne A. (2019). "Declines in vocabulary among American adults within levels of educational attainment, 1974–2016". Intelligence. 76 (101377): 101377. doi:10.1016/j.intell.2019.101377.
- ^ Jump up to: a b Balf, Todd (March 5, 2014). "The Story Behind the SAT Overhaul". The New York Times. ISSN 0362-4331. Archived from the original on June 16, 2017. Retrieved June 21, 2017.
- ^ Jump up to: a b c d "College Board Will No Longer Offer SAT Subject Tests or SAT with Essay – College Board Blog". College Board. Retrieved February 14, 2021.
- ^ Jump up to: a b c d e Hartocollis, Anemona; Taylor, Kate; Saul, Stephanie (January 20, 2021). "Retooling During Pandemic, the SAT Will Drop Essay and Subject Tests". The New York Times. ISSN 0362-4331. Retrieved February 14, 2021.
- ^ Jump up to: a b c d e f g h i j k l m n o p q Frey, Meredith C. (December 2019). "What We Know, Are Still Getting Wrong, and Have Yet to Learn about the Relationships among the SAT, Intelligence and Achievement". Journal of Intelligence. 7 (4): 26. doi:10.3390/jintelligence7040026. PMC 6963451. PMID 31810191.
- ^ Jump up to: a b O'Boyle, Michael W. (2005). "Some current findings on brain characteristics of the mathematically gifted adolescent" (PDF). International Education Journal. Shannon Research Press. 6 (2): 247–251. ISSN 1443-1475.
- ^ Jump up to: a b c Haier, Richard (2018). "Chapter 11: A View from the Brain". In Sternberg, Robert (ed.). The Nature of Human Intelligence. Cambridge University Press. ISBN 978-1-107-17657-7.
- ^ Jump up to: a b Lubinsky, David (2018). "Chapter 15: Individual Differences at the Top". In Sternberg, Robert (ed.). The Nature of Human Intelligence. Cambridge University Press. ISBN 978-1-107-17657-7.
- ^ Jump up to: a b c Weber, Rebecca L. (May 18, 2004). "Want a job? Hand over your SAT results". Christian Science Monitor. Archived from the original on August 26, 2021. Retrieved August 26, 2021.
- ^ Jump up to: a b c Treu, Zachary (February 26, 2014). "Your SAT and ACT scores could make a difference in your job future". Nation. PBS Newshour. Retrieved August 26, 2021.
- ^ Jump up to: a b c d e Dewan, Shaila (March 29, 2014). "How Businesses Use Your SATs". The New York Times. Archived from the original on February 12, 2021. Retrieved February 14, 2021.
- ^ "SAT Registration". College Board. 2 December 2015. Archived from the original on August 28, 2016. Retrieved August 16, 2016. "Most students take the SAT spring of junior year or fall of senior year."
- ^ Atkinson, Richard; Geiser, Saul (May 4, 2015). "The Big Problem With the New SAT". The New York Times. Archived from the original on November 1, 2015. Retrieved January 29, 2016.
- ^ "01-249.RD.ResNoteRN-10 collegeboard.com" (PDF). The College Board. Archived from the original (PDF) on January 6, 2009. Retrieved October 13, 2014.
- ^ Korbin, L. (2006). SAT Program Handbook. A Comprehensive Guide to the SAT Program for School Counselors and Admissions Officers, 1, 33+. Retrieved January 24, 2006, from College Board Preparation Database.
- ^ Honawar, Vaishali; Klein, Alyson (August 30, 2006). "ACT Scores Improve; More on East Coast Taking the SAT's Rival". Education Week. Archived from the original on May 30, 2015. Retrieved May 29, 2015.
- ^ Slatalla, Michelle (November 4, 2007). "ACT vs. SAT". The New York Times. Archived from the original on September 27, 2017. Retrieved February 18, 2017.
- ^ "Colleges and Universities That Do Not Use SAT/ACT Scores for Admitting Substantial Numbers of Students Into Bachelor Degree Programs". fairtest.org. The National Center for Fair & Open Testing. Archived from the original on September 28, 2017. Retrieved September 26, 2017.
- ^ Marklein, Mary Beth (March 18, 2007). "All four-year U.S. colleges now accept ACT test". USA Today. Archived from the original on May 30, 2015. Retrieved May 29, 2015.
- ^ Jump up to: a b c "Score Structure". CollegeBoard. 14 May 2015. Retrieved March 25, 2021.
- ^ Jump up to: a b c "The SAT and SAT Subject Tests Educator Guide" (PDF). College Board. Archived (PDF) from the original on 18 October 2017. Retrieved 20 July 2017.
- ^ "SAT Essay". CollegeBoard. 3 December 2014. Retrieved March 25, 2021.
- ^ "SAT Reading Test". College Board. 12 May 2015. Archived from the original on 16 August 2017. Retrieved 16 August 2017.
- ^ "SAT Writing and Language Test". College Board. 12 May 2015. Archived from the original on 20 August 2017. Retrieved 19 August 2017.
- ^ "SAT Math Test". The College Board. 12 May 2015. Archived from the original on March 18, 2016. Retrieved April 5, 2016.
- ^ "Score Structure – SAT Suite of Assessments". The College Board. 14 May 2015. Archived from the original on March 18, 2016. Retrieved April 5, 2016.
- ^ "PSAT/NMSQT Understanding Scores 2015 – SAT Suite of Assessments" (PDF). The College Board. Archived (PDF) from the original on April 7, 2016. Retrieved April 6, 2016.
- ^ "SAT Study Guide for Students – SAT Suite of Assessments". The College Board. 15 July 2015. Archived from the original on April 23, 2016. Retrieved April 7, 2016.
- ^ "SAT Calculator Policy". The College Board. 13 January 2016. Archived from the original on March 18, 2016. Retrieved April 2, 2016.
- ^ Scheuneman, Janice; Camara, Wayne. "Calculator Use and the SAT I Math". The College Board. Archived from the original on April 3, 2016. Retrieved April 3, 2016.
- ^ "Should graphing calculators be allowed on important tests?" (PDF). Texas Instruments. Archived (PDF) from the original on April 22, 2016. Retrieved April 2, 2016.
- ^ "About The SAT Math Test" (PDF). College Board. Archived (PDF) from the original on August 25, 2017. Retrieved August 24, 2017.
- ^ "College Board Test Tips". College Board. Archived from the original on November 24, 2009. Retrieved September 9, 2008.
- ^ "SAT Dates And Deadlines". College Board. 15 May 2015. Archived from the original on July 23, 2017. Retrieved July 22, 2017.
- ^ "SAT International Registration". College Board. 15 May 2015. Archived from the original on July 21, 2017. Retrieved July 22, 2017.
- ^ "Getting SAT Scores". The College Board. 11 January 2016. Archived from the original on April 24, 2019. Retrieved April 28, 2019.
- ^ Jump up to: a b c "Understanding SAT Scores" (PDF). The College Board. Archived (PDF) from the original on April 17, 2019. Retrieved April 28, 2019.
- ^ "Verifying SAT Scores". The College Board. 11 January 2016. Archived from the original on April 24, 2019. Retrieved April 28, 2019.
- ^ "SAT Percentile Ranks for Males, Females, and Total Group:2006 College-Bound Seniors – Critical Reading + Mathematics" (PDF). College Board. Archived from the original (PDF) on June 14, 2007. Retrieved May 29, 2007.
- ^ "SAT Percentile Ranks for Males, Females, and Total Group:2006 College-Bound Seniors – Critical Reading + Mathematics + Writing" (PDF). College Board. Archived from the original (PDF) on June 14, 2007. Retrieved May 29, 2007.
- ^ "The Fifth Norming of the Mega Test". Archived from the original on 2019-05-16. Retrieved 2019-05-25.
- ^ Membership Committee (1999). "1998/99 Membership Committee Report". Prometheus Society. Archived from the original on June 24, 2013. Retrieved June 19, 2013. Cite journal requires
|journal=(help) - ^ ACT and SAT® Concordance Tables (PDF). Research Note 40. College Board. 30 September 2009. Archived (PDF) from the original on 26 April 2017. Retrieved 18 Mar 2017.
- ^ "ACT-SAT Concordance Tables" (PDF). ACT, Inc. Archived (PDF) from the original on 21 November 2016. Retrieved 18 Mar 2017.
- ^ "Higher Education Concordance Information". College Board. 15 May 2015. Archived from the original on 19 March 2017. Retrieved 18 Mar 2017.
- ^ "Archived copy" (PDF). Archived (PDF) from the original on 2019-05-09. Retrieved 2019-06-02.CS1 maint: archived copy as title (link)
- ^ Kaplan, Stanley (2001). Test Pilot: How I Broke Testing Barriers for Millions of Students and Caused a Sonic Boom in the Business of Education. New York: Simon & Schuster. pp. 30–33. ISBN 978-0743201681.
- ^ Research and Markets ltd. "2009 Worldwide Exam Preparation & Tutoring Industry Report". researchandmarkets.com. Archived from the original on 2010-07-02. Retrieved 2009-06-12.
- ^ Gross, Natalie (November 10, 2016). "Can a free SAT prep class ever be as good as pricey in-person ones?". The Washington Post. Retrieved August 25, 2021.
- ^ Jump up to: a b Montgomery, Paul; Lilly, Jane (2012). "Systematic Reviews of the Effects of Preparatory Courses on University Entrance Examinations in High School-Age Students". International Journal of Social Welfare. 21 (1): 3–12. doi:10.1111/j.1468-2397.2011.00812.x.
- ^ Carlton, Sue (March 31, 2021). "Make sure that SAT test-prep service for your high-schooler isn't a scam". Crime. Tampa Bay Times. Archived from the original on August 27, 2021. Retrieved August 26, 2021.
- ^ Allen Grove. "SAT Prep – Are SAT Prep Courses Worth the Cost?". About.com Education. Archived from the original on 2011-07-07. Retrieved 2010-11-27.
- ^ Jump up to: a b c Hambrick, David Z. (December 16, 2011). "The SAT Is a Good Intelligence Test". The New York Times. Archived from the original on February 26, 2021. Retrieved March 1, 2021.
- ^ DerSimonian, Rebecca; Laird, Nan (April 1983). "Evaluating the Effect of Coaching on SAT Scores: A Meta-Analysis". Harvard Educational Review. 53 (1): 1–15. doi:10.17763/haer.53.1.n06j5h5356217648.
- ^ Domigue, Ben; Briggs, Derek C. (2009). "Using Linear Regression and Propensity Score Matching to Estimate the Effect of Coaching on the SAT". Multiple Linear Regression Viewpoints. 35 (1): 12–29.
- ^ Becker, Betsy Jane (30 June 2016). "Coaching for the Scholastic Aptitude Test: Further Synthesis and Appraisal". Review of Educational Research. 60 (3): 373–417. doi:10.3102/00346543060003373. S2CID 146476197.
- ^ Jump up to: a b Shellenbarger, Sue (May 27, 2009). "High-School Senior: I Took the SAT Again After 41 Years". The Wall Street Journal. Archived from the original on January 25, 2021. Retrieved February 22, 2021.
- ^ Goldfarb, Zachary A. (March 5, 2014). "These four charts show how the SAT favors rich, educated families". The Washington Post. Archived from the original on February 16, 2021. Retrieved February 16, 2021.
- ^ Steiner, Matty (August 22, 2014). "Neuroscience and College Admission Tests". Compass. Retrieved August 26, 2021.
- ^ Atkinson, R.C.; Geiser, S. (2009). "Reflections on a Century of College Admissions Tests". Educational Researcher. 38 (9): 665–76. doi:10.3102/0013189x09351981. S2CID 15661086.
- ^ Jump up to: a b c d McGurn, William (May 25, 2020). "Is the SAT Really the Problem?". The Wall Street Journal. Archived from the original on August 1, 2020. Retrieved March 3, 2021.
- ^ Jump up to: a b "Report of the UC Academic Council Standardized Testing Task Force (STTF)" (PDF). Jan 2020.
At UC, test scores are currently better predictors of first-year GPA than high school grade point average (HSGPA), and about as good at predicting first-year retention, UGPA, and graduation.3 For students within any given (HSGPA) band, higher standardized test scores correlate with a higher freshman UGPA, a higher graduation UGPA, 4 and higher likelihood of graduating within either four years (for transfers) or seven years (for freshmen). Further, the amount of variance in student outcomes explained by test scores has increased since 2007, while variance explained by high school grades has decreased, although altogether does not exceed 26%. Test scores are predictive for all demographic groups and disciplines, even after controlling for HSGPA.
- ^ Kobrin, Jennifer L.; Patterson, Brian F.; Shaw, Emily J.; Mattern, Krista D.; Barbuti, Sandra M. (2008). Validity of the SAT® for Predicting First-Year College Grade Point Average. Research Report No. 2008-5. College Board.
- ^ Burton, Nancy W.; Ramist, Leonard (2001). Predicting Success in College: SAT® Studies of Classes Graduating since 1980. Research Report No. 2001-2. College Entrance Examination Board.
- ^ Jump up to: a b c d Kuncel, Nathan R.; Hezlett, Sarah A. (December 14, 2010). "Fact and Fiction in Cognitive Ability Testing for Admissions and Hiring Decisions". Current Directions in Psychological Science. Association for Psychological Science. 19 (6): 339–345. doi:10.1177/0963721410389459. S2CID 33313110.
- ^ Coyle, Thomas R.; Pillow, David R. (2008). "SAT and ACT predict college GPA after removing g". Intelligence. 26 (6): 719–729. doi:10.1016/j.intell.2008.05.001.
- ^ Jump up to: a b c Sackett, Paul R.; Kuncel, Nathan R.; Beatty, Adam S.; Rigdon, Jana L.; Shen, Winny; Kiger, Thomas B. (August 2, 2012). "The Role of Socioeconomic Status in SAT-Grade Relationships and in College Admissions Decisions". Psychological Science. Association for Psychological Science. 23 (9): 1000–1007. doi:10.1177/0956797612438732. PMID 22858524. S2CID 22703783.
- ^ Shewach, Oren R.; McNeal, Kyle D.; Kuncel, Nathan R.; Sackett, Paul R. (2019). "Bunny Hill or Black Diamond: Differences in Advanced Course‐Taking in College as a Function of Cognitive Ability and High School GPA". Educational Measurement: Issues and Practice. National Council on Measurement in Education. 38 (1): 25–35. doi:10.1111/emip.12212.
- ^ Jump up to: a b Zwick, Rebecca; Greif Green, Jennifer (Spring 2007). "New Perspectives on the Correlation of SAT Scores, High School Grades, and Socioeconomic Factors". Journal of Educational Measurement. National Council on Measurement in Education. 44 (1): 23–45. doi:10.1111/j.1745-3984.2007.00025.x. JSTOR 20461841.
- ^ Jump up to: a b Rothstein, Jesse (April 2005). "SAT Scores, High Schools, and Collegiate Performance Predictions" (PDF). Presented at the annual meeting of the National Council on Measurement in Education, Montreal. Cite journal requires
|journal=(help) - ^ Ackerman, Philip L. (2018). "Chapter 1: Intelligence as Potentiality and Actuality". In Sternberg, Robert (ed.). The Nature of Human Intelligence. Cambridge University Press. ISBN 978-1-107-17657-7.
- ^ Jump up to: a b c Kaufman, Scott Barry (September 4, 2018). "IQ and Society". Scientific American. Archived from the original on September 30, 2020. Retrieved March 1, 2021.
- ^ Wai, Jonathan; Lubinski, David; Benbow, Camilla (2009). "Spatial Ability for STEM Domains: Aligning Over 50 Years of Cumulative Psychological Knowledge Solidifies Its Importance" (PDF). Journal of Educational Psychology. American Psychological Association. 101 (4): 817–835. doi:10.1037/a0016127.
- ^ Sternberg, Robert; The Rainbow Project Collaborators (July–August 2006). "The Rainbow Project: Enhancing the SAT through assessments of analytical, practical, and creative skills". Intelligence. 34 (4): 321–350. doi:10.1016/j.intell.2006.01.002.
- ^ Jump up to: a b c d e f g h i Dance, Amber (July 15, 2021). "Has the Pandemic Put an End to the SAT and ACT?". Smithsonian Magazine. Retrieved August 26, 2021.
- ^ Jump up to: a b Turner, Cory (April 30, 2014). "U.S. Tests Teens A Lot, But Worldwide, Exam Stakes Are Higher". Education. NPR. Retrieved August 26, 2021.
- ^ Ripley, Amanda (March 12, 2014). "The New SAT Doesn't Come Close to the World's Best Tests". Time Magazine. Archived from the original on September 18, 2020. Retrieved August 26, 2021.
- ^ Salaky, Kristin (September 5, 2018). "What standardized tests look like in 10 places around the world". Insider. Retrieved August 26, 2021.
- ^ Jump up to: a b Wai, Jonathan (July 24, 2012). "The SAT Needs to Be Harder". Commentary. Education Week. Archived from the original on February 18, 2021. Retrieved February 18, 2021.
- ^ Jump up to: a b c Zoroya, Gregg (March 6, 2014). "Sharpen those pencils: The SAT test is getting harder". USA Today. Retrieved February 18, 2021.
- ^ Popken, Ben (July 13, 2018). "Easy SAT has students crying over 'shocking' low scores". NBC News. Retrieved February 18, 2021.
- ^ Jaschik, Scott (July 12, 2018). "An 'Easy' SAT and Terrible Scores". Inside Higher Education. Retrieved February 18, 2021.
- ^ The Staff of the Princeton Review (2019). "Why You Shouldn't Want an "Easy" SAT". Princeton Review. Archived from the original on October 28, 2020. Retrieved February 19, 2021.
- ^ Jump up to: a b Gallagher, Ann M.; De Lisi, Richard; Holst, Patricia C.; McGillicuddy-De Lisi, Ann V.; Morely, Mary; Cahalan, Cara (2000). "Gender Differences in Advanced Mathematical Problem Solving". Journal of Experimental Child Psychology. Academic Press. 75 (3): 165–190. CiteSeerX 10.1.1.536.2454. doi:10.1006/jecp.1999.2532. PMID 10666324.
- ^ Hannon, Brenda; McNaughton-Cassill, Mary (July 27, 2011). "SAT Performance: Understanding the Contributions of Cognitive/Learning and Social/Personality Factors". Applied Cognitive Psychology. 25 (4): 528–535. doi:10.1002/acp.1725. PMC 3144549.
- ^ Frey, M.C.; Detterman, D.K. (2004). "Scholastic Assessment or g? The Relationship Between the Scholastic Assessment Test and General Cognitive Ability" (PDF). Psychological Science. 15 (6): 373–78. doi:10.1111/j.0956-7976.2004.00687.x. PMID 15147489. S2CID 12724085. Archived (PDF) from the original on 2019-08-05. Retrieved 2019-09-10.
- ^ Beaujean, A.A.; Firmin, M.W.; Knoop, A.; Michonski, D.; Berry, T.B.; Lowrie, R.E. (2006). "Validation of the Frey and Detterman (2004) IQ prediction equations using the Reynolds Intellectual Assessment Scales" (PDF). Personality and Individual Differences. 41 (2): 353–57. doi:10.1016/j.paid.2006.01.014. Archived from the original (PDF) on 2011-07-13.
- ^ Gottfredson, Linda (2018). "Chapter 9: g Theory - How Recurring Variation in Human Intelligence and the Complexity of Everyday Tasks Create Social Structure and the Democratic Dilemma". In Sternberg, Robert J. (ed.). The Nature of Human Intelligence. Cambridge University Press. ISBN 978-1-107-17657-7.
- ^ Zwick, Rebecca (2004). Rethinking the SAT: The Future of Standardized Testing in University Admissions. New York: RoutledgeFalmer. pp. 203–04. ISBN 978-0-415-94835-7.
- ^ Jump up to: a b "Ditching dreaded SAT analogies". Chicago Tribune. August 11, 2003. Retrieved March 1, 2021.
- ^ Jump up to: a b c d e f g h i j k Lawrence, Ida; Rigol, Gretchen W.; Van Essen, Thomas; Jackson, Carol A. (2003). "Research Report No. 2003-3: A Historical Perspective on the Content of the SAT" (PDF). College Entrance Examination Board. Archived (PDF) from the original on June 5, 2014. Retrieved June 1, 2014.
- ^ Garfield, Leslie (2006-09-01). "The Cost of Good Intentions: Why the Supreme Court's Decision Upholding Affirmative Action Admission Programs Is Detrimental to the Cause". Pace Law Review. 27 (1): 15. ISSN 0272-2410. Archived from the original on 2019-09-04. Retrieved 2019-09-04.
- ^ Jump up to: a b "College Board To Alter SAT I for 2005–06". Daily Nexus. 20 September 2002. Archived from the original on 9 October 2007. Retrieved July 3, 2016.
- ^ Lindsay, Samantha (January 6, 2019). "SAT Analogies and Comparisons: Why Were They Removed, and What Replaced Them?". PrepScholar. Retrieved March 1, 2021.
- ^ Hsu, Stephen; Shombert, James (November 2010). "Nonlinear Psychometric Thresholds for Physics and Mathematics". arXiv:1011.0663 [physics.ed-ph].
- ^ Jump up to: a b c Wai, Jonathan (February 3, 2015). "Your college major is a pretty good indication of how smart you are". Quartz. Archived from the original on January 16, 2020. Retrieved January 30, 2021.
- ^ Crew, Bec (February 16, 2015). "Your College Major Can Be a Pretty Good Indication of How Smart You Are". Humans. Science Magazine. Retrieved January 30, 2021.
- ^ Gunn, Laura H.; ter Horst, Enrique; Markossian, Talar; Molina, German (May 13, 2020). "Associations between majors of graduating seniors and average SATs of incoming students within higher education in the U.S." Heliyon. 6 (5): e03956. doi:10.1016/j.heliyon.2020.e03956. PMC 7266786. PMID 32514476.
- ^ Wai, Jonathan; Brown, Matt I.; Chabris, Christopher F. (2018). "Using Standardized Test Scores to Include General Cognitive Ability in Education Research and Policy". Journal of Intelligence. 6 (3): 37. doi:10.3390/jintelligence6030037. PMC 6480800. PMID 31162464.
- ^ Wai, Jonathan; Brown, Matt; Chabris, Christopher (2019). "No one likes the SAT. It's still the fairest thing about admissions". The Washington Post. Archived from the original on November 17, 2020. Retrieved February 15, 2021.
- ^ Petrilli, Michael J.; Enamorado, Pedro (March 24, 2020). "Yes, It Really Is Harder to Get into Highly Selective Colleges Today". Education Next. Archived from the original on October 24, 2020. Retrieved February 19, 2021.
- ^ Duncan, Keven C.; Sandy, Jonathan (Spring 2007). "Explaining the Performance Gap between Public and Private School Students" (PDF). Eastern Economic Journal. Palgrave Macmillan Journals. 33 (2): 177–191. doi:10.1057/eej.2007.16. JSTOR 20642346. S2CID 55272711.
- ^ Geiser, Saul; Studley, Roger (October 29, 2001), UC and the SAT: Predictive Validity and Differential Impact of the SAT I ad SAT II at the University of California (PDF), University of California, Office of the President., archived (PDF) from the original on March 5, 2016, retrieved September 30, 2014
- ^ Jump up to: a b Blandin, Adam; Herrington, Christopher; Steelman, Aaron (February 2018). "How Does Family Structure during Childhood Affect College Preparedness and Completion?". Economic Brief. Federal Reserve Bank of Richmond. 18 (2).
- ^ Novotney, Amy (December 2012). "Psychologists debate the meaning of students' falling SAT scores". APA Monitor. Retrieved February 2, 2021.
- ^ Jump up to: a b Hsin, Amy; Xie, Yu (June 10, 2014). "Explaining Asian Americans' academic advantage over whites". Proceedings of the National Academy of Sciences of the United States of America. 111 (23): 8416–8421. Bibcode:2014PNAS..111.8416H. doi:10.1073/pnas.1406402111. PMC 4060715. PMID 24799702.
- ^ Cummins, Denise (March 17, 2014). "Boys outperform girls on mathematic portion". Psychology Today. Retrieved November 6, 2016.
- ^ Cummins, Denise (April 17, 2015). "Column: Why the STEM gender gap is overblown". PBS Newshour. Retrieved March 4, 2021.
- ^ Ceci, Stephen; Ginther, Donna K.; Kahn, Shulamit; Williams, Wendy M. (November 3, 2014). "Women in Academic Science: A Changing Landscape". Psychological Science in the Public Interest. Association for Psychological Science (APS). 15 (3): 75–141. doi:10.1177/1529100614541236. PMID 26172066. S2CID 12701313.
- ^ Jump up to: a b c d Ceci, Stephen J.; Ginther, Donna K.; Kahn, Shulamit; Williams, Wendy M. (2018). "Chapter 3: Culture, Sex, and Intelligence". In Sternberg, Robert (ed.). The Nature of Human Intelligence. Cambridge University Press. ISBN 978-1-107-17657-7.
- ^ Jump up to: a b c d e Wai, Jonathan; Cacchio, Megan; Putallaz, Martha; Makel, Matthew C. (July–August 2010). "Sex differences in the right tail of cognitive abilities: A 30 year examination". Intelligence. 38 (4): 412–423. doi:10.1016/j.intell.2010.04.006.
- ^ Jump up to: a b c Wai, Jonathan; Putallaz, Martha; Makel, Matthew C. (2012). "Studying Intellectual Outliers: Are There Sex Differences, and Are the Smart Getting Smarter?" (PDF). Current Directions in Psychological Science. 21 (6): 382–390. doi:10.1177/0963721412455052. S2CID 145155911.
- ^ "Cleverer still". The Economist. December 22, 2012. Archived from the original on November 12, 2020. Retrieved February 15, 2021.
- ^ Lehre, Anne-Catherine; Lehre, Knut P.; Laake, Petter; Danbolt, Niels C. (2009). "Greater intrasex phenotype variability in males than in females is a fundamental aspect of the gender differences in humans". Developmental Psychobiology. 51 (2): 198–206. doi:10.1002/dev.20358. ISSN 0012-1630. PMID 19031491.
- ^ Wai, Jonathan; Hodges, Jaret; Makel, Matthew C. (March–April 2018). "Sex differences in ability tilt in the right tail of cognitive abilities: A 35-year examination". Intelligence. 67: 76–83. doi:10.1016/j.intell.2018.02.003. ISSN 0160-2896. Retrieved January 31, 2021.
- ^ Jump up to: a b c Schrager, Allison (July 9, 2015). "Men are both dumber and smarter than women". Quartz. Archived from the original on January 13, 2021. Retrieved February 15, 2021.
- ^ "Validity of the SAT for Predicting First-Year Grades: 2013 SAT Validity Sample" (PDF). files.eric.ed.gov. 2013. Archived (PDF) from the original on 2019-04-11. Retrieved 2019-05-14.
- ^ Pope, Devin G. (August 8, 2017). "Women who are elite mathematicians are less likely than men to believe they're elite mathematicians". The Washington Post. Archived from the original on February 16, 2021. Retrieved February 16, 2021.
- ^ Haier, Richard; Benbow, Camilla Persson (1995). "Sex differences and lateralization in temporal lobe glucose metabolism during mathematical reasoning". Developmental Neuropsychology. 11 (4): 405–414. doi:10.1080/87565649509540629.
- ^ Status and Trends in the Education of Racial and Ethnic Minorities: Average SAT scores for 12th-grade SAT-taking population, by race/ethnicity: 2006
- ^ "Average SAT scores for 12th-grade SAT-taking population, by race/ethnicity: 2006". Institute of Educational Sciences. The College Board, College Bound Seniors, 2006. 2006. Archived from the original on 2015-06-27.
- ^ Abigail Thernstrom & Stephan Thernstrom. 2004. No Excuses: Closing the Racial Gap in Learning. Simon and Schuster
- ^ Jaschik, S (21 June 2010). "New Evidence of Racial Bias on the SAT". Inside Higher ED. Archived from the original on 1 January 2015.
- ^ Jump up to: a b c Smith, Ember; Reeves, Richard V. (December 1, 2020). "SAT math scores mirror and maintain racial inequity". Brookings Institution. Retrieved January 30, 2021.
- ^ Card, D.; Rothstein, Ol (2007). "Racial segregation and the black–white test score gap". Journal of Public Economics (Submitted manuscript). 91 (11): 2158–84. doi:10.1016/j.jpubeco.2007.03.006. S2CID 13468169. Archived from the original on 2019-01-03. Retrieved 2018-09-10.
- ^ "The Widening Racial Scoring Gap on the SAT College Admissions Test". The Journal of Blacks in Higher Education. Archived from the original on 16 December 2015. Retrieved 14 December 2015.
- ^ Ogbu, John U. (3 January 2003). Black American Students in An Affluent Suburb: A Study of Academic Disengagement (Sociocultural, Political, and Historical Studies in Education). New York: Routledge. pp. 16, 164. ISBN 978-0-8058-4516-7.
- ^ Freedle, R.O. (2003). "Correcting the SAT's ethnic and social-class bias: A method for reestimating SAT Scores". Harvard Educational Review. 73: 1–38. doi:10.17763/haer.73.1.8465k88616hn4757.
- ^ Crain, W (2004). "Biased test". ENCOUNTER: Education for Meaning and Social Justice. 17 (3): 2–4.
- ^ "Editorial Biased Tests" (PDF). files.campus.edublogs.org. 2011. Archived (PDF) from the original on 2019-04-11. Retrieved 2019-05-14.
- ^ "New Evidence of Racial Bias on SAT". insidehighered.com. Archived from the original on 2015-09-28. Retrieved 2015-09-10.
- ^ Santelices, M.V.; Wilson, M. (2010). "Unfair treatment? The case of Freedle, the SAT, and the standardization approach to differential item functioning". Harvard Educational Review. 80 (1): 106–34. doi:10.17763/haer.80.1.j94675w001329270.
- ^ Fleming, Ol (2002). Who will succeed in college? When the SAT predicts Black students' performance. The Review of Higher Education, 25(3), 281–96.
- ^ Jump up to: a b Jencks, C. (1998). Racial bias in testing. The Black-White test score gap, 55, 84.
- ^ Reeves, Richard V.; Halikias, Dimitrios (February 1, 2017). "Race gaps in SAT scores highlight inequality and hinder upward mobility". Brookings Institution. Retrieved February 16, 2021.
- ^ Jaschik, Scott (October 19, 2020). "ACT and SAT Scores Drop". Inside Higher Education. Retrieved January 30, 2021.
- ^ "Intertel - Join us". www.intertel-iq.org. Retrieved 2021-03-15.
- ^ "Qualifying Scores for the Triple Nine Society". Archived from the original on 2018-03-06. Retrieved 2018-03-10.
- ^ Wai, Jonathan; Lubinski, David; Benbow, Camilla (2005). "Creativity and Occupational Accomplishments Among Intellectually Precocious Youths: An Age 13 to Age 33 Longitudinal Study" (PDF). Journal of Educational Psychology. American Psychological Association. 97 (3): 484–492. doi:10.1037/0022-0663.97.3.484.
- ^ Jump up to: a b Wai, Jonathan (July–August 2013). "Investigating America's elite: Cognitive ability, education, and sex differences". Journal of Intelligence. 41 (4): 203–211. doi:10.1016/j.intell.2013.03.005 – via Elsevier Science Direct.
- ^ Park, Gregory; Lubinski, David; Benbow, Camilla (November 2007). "Contrasting intellectual patterns predict creativity in the arts and sciences: tracking intellectually precocious youth over 25 years". Psychological Science. 18 (11): 948–52. doi:10.1111/j.1467-9280.2007.02007.x. PMID 17958707. S2CID 11576778.
- ^ Robertson, Kimberley Ferriman; Smeets, Stijn; Lubinski, David; Benbow, Camilla P. (December 14, 2010). "Beyond the Threshold Hypothesis: Even Among the Gifted and Top Math/Science Graduate Students, Cognitive Abilities, Vocational Interests, and Lifestyle Preferences Matter for Career Choice, Performance, and Persistence". Current Directions in Psychological Science. Association for Psychological Science. 19 (6): 346–351. doi:10.1177/0963721410391442. S2CID 46218795.
- ^ Tierney, John (June 7, 2012). "Daring to Discuss Women in Science". Science. The New York Times. Archived from the original on April 12, 2017. Retrieved February 15, 2021.
- ^ Rothstein, Richard (August 28, 2002). "Sums vs. Summarizing: SAT's Math-Verbal Gap". The New York Times. Archived from the original on June 30, 2012. Retrieved February 18, 2017.
- ^ Phelps, Richard (2003). Kill the Messenger. New Brunswick, NJ: Transaction Publishers. p. 220. ISBN 978-0-7658-0178-4.
- ^ Atkinson, Richard C. (December 2001). "Achievement Versus Aptitude Tests in College Admissions". University of California Office of the President. Archived from the original on May 4, 2006.
- ^ Jump up to: a b Hubler, Shawn (May 23, 2020). "Why Is the SAT Falling Out of Favor?". The New York Times. Retrieved February 2, 2021.
- ^ Jump up to: a b c Lorin, Janet (February 17, 2021). "SATs, Once Hailed as Ivy League Equalizers, Fall From Favor". Bloomberg. Archived from the original on February 18, 2021. Retrieved March 4, 2021.
- ^ "Exams are grim, but most alternatives are worse". The Economist. November 28, 2020. Retrieved February 17, 2021.
- ^ Jump up to: a b c d e Aspegren, Elinor (January 19, 2021). "Adjusting to 'new realities' in admissions process, College Board eliminates SAT's optional essay and subject tests". USA TODAY. Archived from the original on February 4, 2021. Retrieved February 5, 2021.
- ^ Anderson, Nick (January 29, 2021). "Applications surge after big-name colleges halt SAT and ACT testing rules". Education. The Washington Post. Retrieved February 9, 2021.
- ^ Jump up to: a b Nierenberg, Amelia (February 20, 2021). "Interest Surges in Top Colleges, While Struggling Ones Scrape for Applicants". The New York Times. Archived from the original on February 20, 2021. Retrieved March 1, 2021.
- ^ Winerip, Michael (May 4, 2005). "SAT Essay Test Rewards Length and Ignores Errors". The New York Times. Archived from the original on March 16, 2015. Retrieved February 18, 2017.
- ^ Harris, Lynn (May 17, 2005). "Testing, testing". Salon.com. Archived from the original on September 19, 2009.
- ^ "Data (SAT Program Participation And Performance Statistics)". College Entrance Examination Board. Archived from the original on February 21, 2014. Retrieved May 5, 2014.
- ^ "The 2020 SAT Suite of Assessments Annual Report". College Board. 17 September 2020. Retrieved January 16, 2021.
- ^ Jump up to: a b c d Lemann, Nicholas (2004). "A History of Admissions Testing". In Zwick, Rebecca (ed.). Rethinking the SAT: The Future of Standardized Testing in University Admissions. New York: RoutledgeFalmer. pp. 5–14.
- ^ Jump up to: a b Crouse, James; Trusheim, Dale (1988). The Case Against the SAT. Chicago: The University of Chicago Press. pp. 16–39.
- ^ Jump up to: a b "The Problem with the SAT's Idea of Objectivity". 18 May 2019. Archived from the original on 2019-11-12. Retrieved 2019-11-12.
- ^ Jump up to: a b c d e f Hubin, David R. (1988). The SAT – Its Development and Introduction, 1900–1948 (Ph.D.). University of Oregon.
- ^ "G.I Bill History and Timeline". Archived from the original on 27 July 2016. Retrieved 28 July 2016.
- ^ Fuess, Claude (1950). The College Board: Its First Fifty Years. New York: Columbia University Press. Archived from the original on 2017-10-18. Retrieved 2016-08-05.
- ^ Bennet, Randy Elliot. "What Does It Mean to Be a Nonprofit Educational Measurement Organization in the 21st Century?" (PDF). Educational Testing Service. Archived (PDF) from the original on 17 July 2011. Retrieved 28 Mar 2015.
- ^ Jump up to: a b "On Further Examination: Report of the Advisory Panel on the Scholastic Aptitude Test Score Decline" (PDF). College Entrance Examination Board. 1977. Archived from the original (PDF) on October 18, 2014. Retrieved June 24, 2014.
- ^ "frontline: secrets of the sat: where did the test come from?: the 1901 college board". Secrets of the SAT. Frontline. Archived from the original on May 7, 2012. Retrieved October 20, 2007.
- ^ Jump up to: a b "frontline: secrets of the sat: where did the test come from?: the 1926 sat". Secrets of the SAT. Frontline. Archived from the original on October 31, 2007. Retrieved October 20, 2007.
- ^ Jump up to: a b c d e Dorans, Neil. "The Recentering of SAT® Scales and Its Effects on Score Distributions and Score Interpretations" (PDF). Research Report No. 2002-11. College Board. Archived (PDF) from the original on May 31, 2014. Retrieved May 30, 2014.
- ^ Donlon, Thomas; Angoff, William (1971). Angoff, William (ed.). The College Board Admissions Testing Program: A Technical Report on Research and Development Activities Relating to the Scholastic Aptitude Test and Achievement Tests. New York: College Entrance Examination Board. pp. 32–33. Archived from the original on May 31, 2014. Retrieved May 30, 2014. Available at the Education Resources Information Center[1] Archived 2014-05-31 at the Wayback Machine.
- ^ Stedman, Lawrence; Kaestle, Carl (1991). "The Great Test Score Decline: A Closer Look". In Kaestle, Carl (ed.). Literacy in the United States. Yale University Press. p. 132.
- ^ Jump up to: a b Honan, William (March 20, 1994). "Revised and Renamed, S.A.T. Brings Same Old Anxiety". The New York Times. Archived from the original on July 8, 2017. Retrieved February 18, 2017.
- ^ DePalma, Anthony (November 1, 1990). "Revisions Adopted in College Entrance Tests". The New York Times. Archived from the original on April 17, 2017. Retrieved February 18, 2017.
- ^ "Scholastic Assessment Test Score Averages for High-School College-Bound Seniors". National Center for Education Statistics. Archived from the original on May 24, 2014. Retrieved May 23, 2014.
- ^ The College Handbook, 1985–86. New York: College Entrance Examination Board. 1985. p. 953.
- ^ "Yale University Scholastic Assessment Test (SAT) Scores for Freshmen Matriculants Class of 1980 – Class of 2017". Archived from the original (PDF) on July 14, 2014. Retrieved June 4, 2014.
- ^ College-Bound Seniors: 1992 Profile of SAT and Achievement Test Takers. College Entrance Examination Board. 1992. p. 9. Archived from the original on July 14, 2014. Retrieved June 21, 2014. Available at the Education Resources Information Center Archived 2014-07-14 at the Wayback Machine.
- ^ Barron, James (July 26, 1995). "When Close Is Perfect: Even 4 Errors Can't Prevent Top Score on New S.A.T." The New York Times. Archived from the original on July 8, 2017. Retrieved February 18, 2017.
- ^ "SAT I Individual Score Equivalents". College Entrance Examination Board. Archived from the original on September 1, 2014. Retrieved June 29, 2014.
- ^ The Center for Education Reform (August 22, 1996). "SAT Increase – The Real Story, Part II". Archived from the original on July 21, 2011.
- ^ Schoenfeld, Jane (May 24, 2002). "College board drops 'score choice' for SAT-II exams". St. Louis Business Journal. Archived from the original on February 12, 2017. Retrieved March 7, 2018.
- ^ Zhao, Yilu (June 19, 2002). "Students Protest Plan To Change Test Policy". The New York Times. Archived from the original on March 12, 2018. Retrieved March 7, 2018.
- ^ Lewin, Tamar (June 23, 2002). "New SAT Writing Test Is Planned". The New York Times. Archived from the original on May 5, 2014. Retrieved May 5, 2014.
- ^ "Data Layout for SAT and SAT Subject Tests Electronic Score Reports" (PDF). CollegeBoard. Retrieved March 25, 2021.
- ^ "Understanding the New SAT". Inside Higher Ed. 25 May 2005. Archived from the original on 15 September 2016. Retrieved July 3, 2016.
- ^ Arenson, Karen (March 10, 2006). "SAT Errors Raise New Qualms About Testing". The New York Times. Archived from the original on September 1, 2017. Retrieved February 18, 2017.
- ^ Arenson, Karen (April 9, 2006). "Class-Action Lawsuit to Be Filed Over SAT Scoring Errors". The New York Times. Archived from the original on October 23, 2014. Retrieved February 18, 2017.
- ^ Hoover, Eric (August 24, 2007). "$2.85-Million Settlement Proposed in Lawsuit Over SAT-Scoring Errors". The Chronicle of Higher Education. Archived from the original on September 30, 2007. Retrieved August 27, 2007.
- ^ Maslin Nir, Sarah (April 8, 2011). "7,000 Private School Applicants Got Incorrect Scores, Company Says". The New York Times. Archived from the original on September 1, 2017. Retrieved February 18, 2017.
- ^ Rimer, Sara (December 30, 2008). "SAT Changes Policy, Opening Rift With Colleges". The New York Times. Archived from the original on March 12, 2018. Retrieved March 8, 2018.
- ^ "SAT Score Choice". The College Board. 12 January 2016. Archived from the original on March 21, 2018. Retrieved March 7, 2018.
- ^ "Cornell Rejects SAT Score Choice Option". The Cornell Daily Sun. Archived from the original on April 4, 2012. Retrieved February 13, 2008.
- ^ "Standardized Testing Requirements". Cornell University. Retrieved February 23, 2020.
- ^ "Testing". University of Pennsylvania. Retrieved February 23, 2020.
- ^ "Freshman Application Requirements: Standardized Testing". Stanford University. Retrieved February 23, 2020.
- ^ "Standardized Testing Requirements & Policies". Yale University. Retrieved February 23, 2020.
- ^ "SAT® Score-Use Practices by Participating Institution" (PDF). The College Board. Archived (PDF) from the original on April 7, 2009. Retrieved March 9, 2018.
- ^ Anderson, Jenny (March 27, 2012). "SAT and ACT to Tighten Rules After Cheating Scandal". The New York Times. Archived from the original on May 29, 2018. Retrieved May 25, 2018.
- ^ "Test Security and Fairness". The College Board. Archived from the original on September 6, 2015. Retrieved May 22, 2019.
- ^ Jump up to: a b Lewin, Tamar (March 5, 2014). "A New SAT Aims to Realign With Schoolwork". The New York Times. Archived from the original on May 14, 2014. Retrieved May 14, 2014.
- ^ "New, Reading-Heavy SAT Has Students Worried". The New York Times. February 8, 2016. Archived from the original on December 1, 2017. Retrieved July 25, 2017.
- ^ "Key shifts of the SAT redesign". The Washington Post. March 5, 2014. Archived from the original on May 15, 2014. Retrieved May 14, 2014.
- ^ Jump up to: a b Murphy, James S. (May 12, 2016). "How Hard Is the New SAT?". Education. The Atlantic. Archived from the original on October 21, 2020. Retrieved February 22, 2021.
- ^ "Overview of the 2016 SAT sections". Manhattan Review. Retrieved March 25, 2021.
- ^ Jump up to: a b c Allyn, Bobby (August 27, 2019). "College Board Drops Its 'Adversity Score' For Each Student After Backlash". NPR. Retrieved February 2, 2021.
- ^ Rowe, Ian (June 3, 2019). "The College Board's Inclusion of Family Structure Indicators Could Help More Disadvantaged Students". Institute for Family Studies. Retrieved March 6, 2021.
Critics have panned the adversity score as a 'bogus [effort] . . . to rank students on a one-to-100 pseudoscientific index of oppression,' a 'backdoor to racial quotas,' and an approach that will 'only invite a new quest for victimhood.'
- ^ "An Update on Reducing and Simplifying Demands on Students". The College Board. Retrieved January 20, 2021.
- ^ Romalino, Carly Q. (February 17, 2021). "How SAT testing sites are adapting to COVID restrictions: Lower your mask for an ID check". Education. USA Today. Archived from the original on February 19, 2021. Retrieved March 6, 2021.
- ^ Jump up to: a b c "SAT FAQ: Frequently Asked Questions". College Board. Archived from the original on March 25, 2008. Retrieved May 29, 2007.
- ^ Commission on New Possibilities for the Admissions Testing Program (1990). Beyond Prediction. College Entrance Examination Board. p. 9.
- ^ Pitsch, Mark (November 7, 1990). "S.A.T. Revisions Will Be Included In Spring '94 Test". Education Week.
- ^ Jordan, Mary (March 27, 1993). "SAT Changes Name, But It Won't Score 1,600 With Critics". Washington Post.
- ^ Horwitz, Sari (May 5, 1995). "Perfectly Happy With Her SAT; D.C. Junior Aces Scholastic Assessment Test With a 1,600". Washington Post.
- ^ Applebome, Peter (April 2, 1997). "Insisting It's Nothing, Creator Says SAT, Not S.A.T." The New York Times. Archived from the original on April 17, 2017. Retrieved February 18, 2017.
- ^ "What is the Difference Between the SAT and the PSAT?". College Board. Archived from the original on November 12, 2020. Retrieved March 16, 2021.
- ^ Pope, Justin. "Old SAT Exams Get Reused". Washington Post. Archived from the original on 2016-11-05. Retrieved 2017-09-11.
- ^ Renee Dudley; Steve Stecklow; Alexandra Harney; Irene Jay Liu (28 March 2016). "As SAT was hit by security breaches, College Board went ahead with tests that had leaked". Archived from the original on 22 September 2016. Retrieved 4 November 2016.
- ^ Renee Dudley; Steve Stecklow; Alexandra Harney; Irene Jay Liu (28 March 2016). "How Asian test-prep companies quickly penetrated the new SAT". Reuters. Archived from the original on 18 October 2016. Retrieved 4 November 2016.
- ^ Vives, Ruben (28 August 2018). "Taking the SAT is hard enough. Then students learned the test's answers may have been leaked online". Los Angeles Times. Archived from the original on 2018-09-01. Retrieved 2018-09-01.
Further reading[]
- Coyle, T.; Snyder, A.; Pillow, D.; Kochunov, P. (2011). "SAT predicts GPA better for high ability subjects: Implications for Spearman's Law of Diminishing Returns". Personality and Individual Differences. 50 (4): 470–74. doi:10.1016/j.paid.2010.11.009. PMC 3090148. PMID 21562615.
- Gould, Stephen Jay (1996). The Mismeasure of Man (Rev/Expd ed.). W.W. Norton & Company. ISBN 978-0-393-31425-0.
- Hoffman, Banesh (1962). The Tyranny of Testing. Orig. pub. Collier. ISBN 978-0-486-43091-1. (and others)
- Hubin, David R. (1988). The Scholastic Aptitude Test: Its Development and Introduction, 1900–1948. Ph.D. dissertation in American History at the University of Oregon.
- Owen, David (1999). None of the Above: The Truth Behind the SATs (Revised ed.). Rowman & Littlefield. ISBN 978-0-8476-9507-2.
- Sacks, Peter (2001). Standardized Minds: The High Price of America's Testing Culture and What We Can Do to Change It. Perseus. ISBN 978-0-7382-0433-8.
- Zwick, Rebecca (2002). Fair Game? The Use of Standardized Admissions Tests in Higher Education. Falmer. ISBN 978-0-415-92560-0.
- Gladwell, Malcolm (December 17, 2001). "Examined Life: What Stanley H. Kaplan taught us about the S.A.T." The New Yorker.
External links[]
| Wikibooks has a book on the topic of: SAT Study Guide |
| Wikimedia Commons has media related to SAT test. |
- 1901 introductions
- Standardized tests in the United States