San Narciso, Quezon
San Narciso | |
|---|---|
| Municipality of San Narciso | |
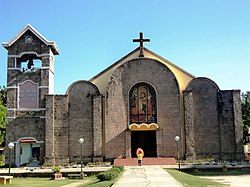 San Narciso Church | |
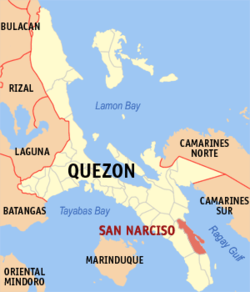 Map of Quezon with San Narciso highlighted | |
show OpenStreetMap | |
 San Narciso Location within the Philippines | |
| Coordinates: 13°34′04″N 122°34′00″E / 13.5677°N 122.5667°ECoordinates: 13°34′04″N 122°34′00″E / 13.5677°N 122.5667°E | |
| Country | Philippines |
| Region | Calabarzon |
| Province | Quezon |
| District | 3rd district |
| Founded | February 2, 1846 [1] |
| Named for | Narcissus of Jerusalem |
| Barangays | 24 (see Barangays) |
| Government | |
| • Type | Sangguniang Bayan |
| • Mayor | Florabelle U. Uy-Yap |
| • Vice Mayor | Elena R. Babao |
| • Representative | Aleta C. Suarez |
| • Municipal Council | show
Members |
| • Electorate | 29,815 voters (2019) |
| Area | |
| • Total | 263.58 km2 (101.77 sq mi) |
| Elevation | 51 m (167 ft) |
| Highest elevation | 305 m (1,001 ft) |
| Lowest elevation | 0 m (0 ft) |
| Population (2020 census) [4] | |
| • Total | 51,058 |
| • Density | 190/km2 (500/sq mi) |
| • Households | 10,638 |
| Economy | |
| • Income class | 3rd municipal income class |
| • Poverty incidence | 35.25% (2015)[5] |
| • Revenue | ₱125,711,643.45 (2016) |
| Service provider | |
| • Electricity | Quezon 1 Electric Cooperative (QUEZELCO 1) |
| Time zone | UTC+8 (PST) |
| ZIP code | 4313 |
| PSGC | |
| IDD : area code | +63 (0)42 |
| Climate type | tropical rainforest climate |
| Native languages | Tagalog |
| Website | www |


San Narciso, officially the Municipality of San Narciso (Tagalog: Bayan ng San Narciso), is a 3rd class municipality in the province of Quezon, Philippines. According to the 2020 census, it has a population of 51,058 people. [4]
Barangays[]
San Narciso has 24 barangays, 4 in Poblacion area.
- Abuyon
- Andres Bonifacio
- Bani
- Binay
- Buenavista
- Busokbusokan
- Calwit
- Guinhalinan
- Lakdayan
- Maguiting
- Manlampong
- Pagkakaisa (Poblacion)
- Maligaya (Poblacion)
- Bayanihan (Poblacion)
- Pagdadamayan (Poblacion)
- Punta
- Rizal
- San Isidro
- San Juan
- San Vicente
- Vigo Central
- Villa Aurin (Pinagsama)
- Villa Reyes
- White Cliff
Climate[]
| hideClimate data for San Narciso, Quezon | |||||||||||||
|---|---|---|---|---|---|---|---|---|---|---|---|---|---|
| Month | Jan | Feb | Mar | Apr | May | Jun | Jul | Aug | Sep | Oct | Nov | Dec | Year |
| Average high °C (°F) | 27 (81) |
28 (82) |
30 (86) |
31 (88) |
31 (88) |
30 (86) |
29 (84) |
29 (84) |
29 (84) |
29 (84) |
29 (84) |
28 (82) |
29 (84) |
| Average low °C (°F) | 21 (70) |
21 (70) |
22 (72) |
23 (73) |
25 (77) |
25 (77) |
25 (77) |
25 (77) |
24 (75) |
24 (75) |
23 (73) |
22 (72) |
23 (74) |
| Average precipitation mm (inches) | 31 (1.2) |
23 (0.9) |
25 (1.0) |
30 (1.2) |
85 (3.3) |
145 (5.7) |
182 (7.2) |
153 (6.0) |
172 (6.8) |
150 (5.9) |
113 (4.4) |
68 (2.7) |
1,177 (46.3) |
| Average rainy days | 11.3 | 8.5 | 9.7 | 11.3 | 18.3 | 23.2 | 26.6 | 25.4 | 25.9 | 24.2 | 19.7 | 15.2 | 219.3 |
| Source: Meteoblue [6] | |||||||||||||
Demographics[]
| Year | Pop. | ±% p.a. |
|---|---|---|
| 1903 | 2,501 | — |
| 1918 | 2,752 | +0.64% |
| 1939 | 5,683 | +3.51% |
| 1948 | 7,006 | +2.35% |
| 1960 | 7,877 | +0.98% |
| 1970 | 17,876 | +8.53% |
| 1975 | 24,556 | +6.57% |
| 1980 | 28,958 | +3.35% |
| 1990 | 33,025 | +1.32% |
| 1995 | 36,535 | +1.91% |
| 2000 | 38,474 | +1.11% |
| 2007 | 39,828 | +0.48% |
| 2010 | 45,386 | +4.87% |
| 2015 | 48,461 | +1.26% |
| 2020 | 51,058 | +1.03% |
| Source: Philippine Statistics Authority [7] [8] [9][10] | ||
Economy[]
| Poverty Incidence of San Narciso | |
| Source: Philippine Statistics Authority[11][12][13][14][15][16] | |
References[]
- ^ https://m.facebook.com/story.php?story_fbid=1211597668955223&id=10000310032131
- ^ Municipality of San Narciso | (DILG)
- ^ "2015 Census of Population, Report No. 3 – Population, Land Area, and Population Density" (PDF). Philippine Statistics Authority. Quezon City, Philippines. August 2016. ISSN 0117-1453. Archived (PDF) from the original on May 25, 2021. Retrieved July 16, 2021.
- ^ Jump up to: a b Census of Population (2020). "Region IV-A (Calabarzon)". Total Population by Province, City, Municipality and Barangay. PSA. Retrieved 8 July 2021.
- ^ https://psa.gov.ph/sites/default/files/City%20and%20Municipal-level%20Small%20Area%20Poverty%20Estimates_%202009%2C%202012%20and%202015_0.xlsx; publication date: 10 July 2019; publisher: Philippine Statistics Authority.
- ^ "San Narciso: Average Temperatures and Rainfall". Meteoblue. Retrieved 27 January 2020.
- ^ Census of Population (2015). "Region IV-A (Calabarzon)". Total Population by Province, City, Municipality and Barangay. PSA. Retrieved 20 June 2016.
- ^ Census of Population and Housing (2010). "Region IV-A (Calabarzon)". Total Population by Province, City, Municipality and Barangay. NSO. Retrieved 29 June 2016.
- ^ Censuses of Population (1903–2007). "Region IV-A (Calabarzon)". Table 1. Population Enumerated in Various Censuses by Province/Highly Urbanized City: 1903 to 2007. NSO.
- ^ "Province of Quezon". Municipality Population Data. Local Water Utilities Administration Research Division. Retrieved 17 December 2016.
- ^ "Poverty incidence (PI):". Philippine Statistics Authority. Retrieved 28 December 2020.
- ^ https://psa.gov.ph/sites/default/files/NSCB_LocalPovertyPhilippines_0.pdf; publication date: 29 November 2005; publisher: Philippine Statistics Authority.
- ^ https://psa.gov.ph/sites/default/files/2003%20SAE%20of%20poverty%20%28Full%20Report%29_1.pdf; publication date: 23 March 2009; publisher: Philippine Statistics Authority.
- ^ https://psa.gov.ph/sites/default/files/2006%20and%202009%20City%20and%20Municipal%20Level%20Poverty%20Estimates_0_1.pdf; publication date: 3 August 2012; publisher: Philippine Statistics Authority.
- ^ https://psa.gov.ph/sites/default/files/2012%20Municipal%20and%20City%20Level%20Poverty%20Estima7tes%20Publication%20%281%29.pdf; publication date: 31 May 2016; publisher: Philippine Statistics Authority.
- ^ https://psa.gov.ph/sites/default/files/City%20and%20Municipal-level%20Small%20Area%20Poverty%20Estimates_%202009%2C%202012%20and%202015_0.xlsx; publication date: 10 July 2019; publisher: Philippine Statistics Authority.
External links[]
- San Narciso Profile at PhilAtlas.com
- Philippine Standard Geographic Code
- Philippine Census Information
- Local Governance Performance Management System
| show Places adjacent to San Narciso, Quezon |
|---|
| Authority control |
|
|---|
This article about a location in Calabarzon region is a stub. You can help Wikipedia by . |
Categories:
- Municipalities of Quezon
- Calabarzon geography stubs