St. Norbert (electoral district)

From Wikipedia, the free encyclopedia

St. Norbert
Manitoba electoral district
StNorbertED2011.jpg
Defunct provincial electoral district
LegislatureLegislative Assembly of Manitoba
District created1979
First contested1981
Last contested2016

St. Norbert is a former provincial electoral division in the Canadian province of Manitoba.

Historical riding[]

The original riding of St. Norbert was established at the time of the province's creation in 1870. For the 1870 provincial election, it was divided into two separate ridings: St. Norbert North and St. Norbert South. Subsequently, it was reduced to a single riding.

St. Norbert was a francophone-majority riding. It was eliminated in 1879, at a time when francophone representation in the province was being reduced.

List of provincial representatives (St. Norbert North)[]

Name Party Took office Left office
Joseph Lemay Government/French Party 1870 1874

List of provincial representatives (St. Norbert South)[]

Name Party Took office Left office
Pierre Delorme Government/French Party 1870 1874

List of provincial representatives (St. Norbert)[]

Name Party Took office Left office
Joseph Dubuc Government/French Party 1874 1878
Pierre Delorme Government/French Party 1878 1879
Pierre Delorme Opposition/French Party 1879 1879

Most recent riding[]

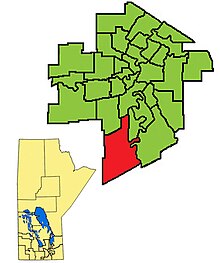
It was recreated by redistribution in 1979, and was contested at the 1981 Manitoba general election. It was abolished at the redistribution of 2018 and ceased to exist under its old name effective at the 2019 Manitoba general election. The riding was located in the southernmost tip of the City of Winnipeg.

St. Norbert was bordered to the east by Seine River, to the south and west by the rural ridings of Dawson Trail and Morris (respectively), and to the north by Riel, Fort Garry (later Fort Richmond) and Fort Whyte. The riding's character is suburban.

St. Norbert's population in 1996 was 19,184. In 1999, the average family income was $59,444, and the unemployment rate was 8.20%. The riding is ethnically diverse: 5% of the riding's residents are German, 4% are Chinese, 3% are East Indian and 2% are Italian. Six per cent of the riding's residents are francophone. Almost 28% of the riding's residents have a university degree.

The service sector accounts for 16% of St. Norbert's industry, with a further 15% in the educational services.

List of provincial representatives[]

Name Party Took office Left office
Gerry Mercier PC 1981 1988
John Angus Lib 1988 1990
Marcel Laurendeau PC 1990 2003
Marilyn Brick NDP 2003 2011
Dave Gaudreau NDP 2011 2016
Jon Reyes PC 2016 2019

Electoral results[]

2016 Manitoba general election
Party Candidate Votes % ±% Expenditures
Progressive Conservative Jon Reyes 4,673 51.02 +6.43 $36,660.34
New Democratic Dave Gaudreau 3,062 33.43 −11.51 $24,532.06
Liberal James Bloomfield 1,251 13.66 +3.65 $38,985.78
Independent Narinder Kaur Johar 174 0.19 $5,367.70
Total valid votes/Expense limit 9160 98.56   $44,386.00
Total rejected ballots 134 1.44  
Turnout 9,294 65.09 +0.84
Eligible voters 14,278    
Source: Elections Manitoba[1][2]
2011 Manitoba general election
Party Candidate Votes % ±% Expenditures
New Democratic Dave Gaudreau 3,966 44.94 −8.80 25,959.60
Progressive Conservative Karen Velthuys 3,935 44.59 +12.65 32,439.47
Liberal Marcel Laurendeau 883 10.01 −4.30 31,742.60
Total valid votes 8,784
Rejected and declined votes 41
Turnout 8,825 64.25 −1.20
Registered voters 13,736
Source: Elections Manitoba[3]


[4]

2007 Manitoba general election
Party Candidate Votes % ±% Expenditures
New Democratic Marilyn Brick 4,044 53.74 +9.08 $18,993.62
Progressive Conservative Tara Brousseau 2,404 31.94 −5.93 $28,159.72
Liberal Wendy Bloomfield 1,077 14.31 +3.58 $19,690.78
Total valid votes 7,525 100.00
Rejected and declined votes 38
Turnout 7,563 65.45
Registered voters 11,555

[5]

2003 Manitoba general election
Party Candidate Votes % ±% Expenditures
New Democratic Marilyn Brick 3,355 48.68 +7.99 $12,670.25
Progressive Conservative Marcel Laurendeau 2,610 37.87 −8.27 $24,397.23
Liberal Jocelyn Greenwood 741 10.75 −3.84 $8,473.22
Green Keith Barber 186 2.70 +2.70 $117.06
Total valid votes 6,892 100.00
Rejected and declined votes 36
Turnout 6,928 58.16
Registered voters 11,911

[6]

1999 Manitoba general election
Party Candidate Votes % ±% Expenditures
Progressive Conservative Marcel Laurendeau 4,152 46.14 +2.24 $26,724.22
New Democratic Marilyn Brick 3,483 38.69 +21.57 $10,804.00
Liberal Mohinder Dhillon 1,313 14.59 -25.39 $17,998.46
Total valid votes 8,947 100.00
Rejected and declined votes 52
Turnout 8,999 72.96
Registered voters 12,380

[7]

1995 Manitoba general election
Party Candidate Votes %
  Progressive Conservative Marcel Laurendeau 4,699 43.90
Liberal Val Thompson 4,172 38.98
New Democratic Pat Peters 1,833 17.12
1988 Manitoba general election
Party Candidate Votes % ±%
Liberal John Angus 6,073 45.91 +
Progressive Conservative Gerry Mercier 5,695 43.05 -
New Democratic Bennetta Benson 1,460 11.04 -
Total valid votes 13,228 100.00 -
Rejected ballots 36
Turnout 13,264 76.95
Eligible voters 17,237
Source: Elections Manitoba[8]

Previous boundaries[]

The 1999–2011 boundaries for St. Norbert highlighted in red

References[]

  1. ^ "Candidates: 41st General Election". Elections Manitoba. March 29, 2016. Retrieved March 31, 2016.
  2. ^ "Election Returns: 41st General Election". Elections Manitoba. 2016. Retrieved August 28, 2018.
  3. ^ "Election Returns: 40th General Election". Elections Manitoba. 2011. Retrieved August 28, 2018.
  4. ^ "2011 results" (PDF). Elections Manitoba. Retrieved May 12, 2014.
  5. ^ "2007 results" (PDF). Elections Manitoba.
  6. ^ "2003 Results" (PDF). Elections Manitoba.
  7. ^ "1999 Results" (PDF). Elections Manitoba.
  8. ^ "Candidates: 34th General Election" (PDF). Elections Manitoba. April 26, 1988. Retrieved October 2, 2018.

Coordinates: 49°47′02″N 97°10′48″W / 49.784°N 97.180°W / 49.784; -97.180

Retrieved from ""