Surava
Surava | |
|---|---|
 | |
 Coat of arms | |
show Location of Surava | |
 Surava | |
| Coordinates: 46°39′N 9°36′E / 46.650°N 9.600°ECoordinates: 46°39′N 9°36′E / 46.650°N 9.600°E | |
| Country | Switzerland |
| Canton | Graubünden |
| District | Albula |
| Area | |
| • Total | 6.68 km2 (2.58 sq mi) |
| Elevation | 904 m (2,966 ft) |
| Population (Dec 2013) | |
| • Total | 196 |
| • Density | 29/km2 (76/sq mi) |
| Time zone | UTC+01:00 (Central European Time) |
| • Summer (DST) | UTC+02:00 (Central European Summer Time) |
| Postal code(s) | 7472 |
| SFOS number | 3515 |
| Surrounded by | Alvaneu, Brienz/Brinzauls, Tiefencastel |
| Website | www SFSO statistics |


Surava is a former municipality in the district of Albula in the canton of Graubünden in Switzerland. On 1 January 2015 the former municipalities of Alvaschein, Mon, Stierva, Tiefencastel, Alvaneu, Brienz/Brinzauls and Surava merged to form the new municipality of Albula/Alvra.[1]
History[]
Surava is first mentioned about 1580 as Surraguas.[2]
Geography[]


Before the merger, Surava had a total area of 7.0 km2 (2.7 sq mi).[3] Of this area, 10.6% is used for agricultural purposes, while 78.3% is forested. Of the rest of the land, 4.3% is settled (buildings or roads) and the remainder (6.8%) is non-productive (rivers, glaciers or mountains).[3]
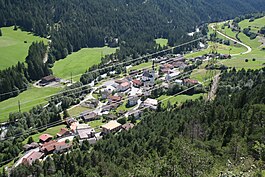
The former municipality is located in the Belfort sub-district of the Albula District. It consists of the linear village of Surava on the right bank of the Albula river. In 1883 the municipality of Brienz-Surava split into Brienz/Brinzauls and Surava.[1]
Demographics[]
Surava had a population (as of 2013) of 196.[3] As of 2008, 7.0% of the population was made up of foreign nationals. Over the last 10 years the population has decreased at a rate of -22%.[3]
As of 2000, the gender distribution of the population was 52.8% male and 47.2% female.[4] The age distribution, as of 2000, in Surava is; 9 people or 12.0% of the population are between 0 and 9 years old. 6 people or 8.0% are 10 to 14, and 7 people or 9.3% are 15 to 19. Of the adult population, 4 people or 5.3% of the population are between 20 and 29 years old. 10 people or 13.3% are 30 to 39, 14 people or 18.7% are 40 to 49, and 10 people or 13.3% are 50 to 59. The senior population distribution is 4 people or 5.3% of the population are between 60 and 69 years old, 3 people or 4.0% are 70 to 79, there are 7 people or 9.3% who are 80 to 89, and there are 1 people or 1.3% who are 90 to 99.[5]
In the 2007 federal election the most popular party was the CVP which received 43.7% of the vote. The next three most popular parties were the SVP (32.6%), the FDP (18.6%) and the SPS (5.1%).[3]
In Surava about 66.2% of the population (between age 25-64) have completed either non-mandatory upper secondary education or additional higher education (either university or a Fachhochschule).[3]
Surava has an unemployment rate of 0.67%. As of 2005, there were 8 people employed in the primary economic sector and about 3 businesses involved in this sector. 22 people are employed in the secondary sector and there are 7 businesses in this sector. 35 people are employed in the tertiary sector, with 8 businesses in this sector.[3]
The historical population is given in the following table:[2][4]
| year | population |
|---|---|
| 1725 | 89 |
| 1850 | 159 |
| 1900 | 148 |
| 1950 | 203 |
| 1960 | 136 |
| 1970 | 93 |
| 1980 | 62 |
| 1990 | 73 |
| 2000 | 150 |
Language[]
Most of the population (as of 2000) speaks German (78.4%), with Romansh being second most common (10.8%) and Albanian being third ( 2.8%).[3]
| Languages in Surava | ||||||
| Languages | Census 1980 | Census 1990 | Census 2000 | |||
| Number | Percent | Number | Percent | Number | Percent | |
| German | 116 | 60.42% | 161 | 76.67% | 196 | 78.40% |
| Romanish | 66 | 34.38% | 45 | 21.43% | 27 | 10.80% |
| Italian | 10 | 5.21% | 2 | 0.95% | 4 | 1.60% |
| Population | 192 | 100% | 210 | 100% | 250 | 100% |
References[]
- ^ Jump up to: a b Amtliches Gemeindeverzeichnis der Schweiz published by the Swiss Federal Statistical Office (in German) accessed 23 September 2009
- ^ Jump up to: a b Surava in German, French and Italian in the online Historical Dictionary of Switzerland.
- ^ Jump up to: a b c d e f g h Swiss Federal Statistical Office accessed 15 January 2015
- ^ Jump up to: a b Graubunden in Numbers Archived 2009-09-24 at the Wayback Machine (in German) accessed 21 September 2009
- ^ Graubunden Population Statistics Archived 2009-08-27 at the Wayback Machine (in German) accessed 21 September 2009
| Wikimedia Commons has media related to Surava. |
External links[]
- Official website (in German)
- Surava in German, French and Italian in the online Historical Dictionary of Switzerland.
| show Authority control |
|---|
- Former municipalities of Graubünden