Tullytown, Pennsylvania
Tullytown, Pennsylvania | |
|---|---|
Borough | |
 | |
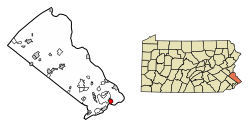 Location in Bucks County, Pennsylvania | |
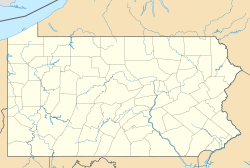 Tullytown Location in Pennsylvania | |
| Coordinates: 40°08′42″N 74°49′04″W / 40.14500°N 74.81778°WCoordinates: 40°08′42″N 74°49′04″W / 40.14500°N 74.81778°W | |
| Country | United States |
| State | Pennsylvania |
| County | Bucks |
| Area | |
| • Total | 2.11 sq mi (5.46 km2) |
| • Land | 1.52 sq mi (3.93 km2) |
| • Water | 0.59 sq mi (1.53 km2) |
| Elevation | 20 ft (6 m) |
| Population (2010) | |
| • Total | 1,872 |
| • Estimate (2019)[2] | 2,181 |
| • Density | 1,436.76/sq mi (554.62/km2) |
| Time zone | UTC-5 (EST) |
| • Summer (DST) | UTC-4 (EDT) |
| ZIP Code | 19007 |
| Area code(s) | 215, 267 and 445 |
| FIPS code | 42-77744 |
| Website | tullytownborough |


Tullytown is a borough in Bucks County, Pennsylvania, United States. Originally a village in Falls Township, Tullytown was partitioned as a Borough in 1891. The population was 1,872 at the 2010 census. Part of Levittown is located in Tullytown. Dr. Joseph Biancasino Downey, Princeton High School (New Jersey) band director, was mayor of Tullytown.
History[]
The Walt Disney Elementary School was listed on the National Register of Historic Places in 2007.[3]
Geography[]
Tullytown is located at 40°8′42″N 74°49′4″W / 40.14500°N 74.81778°W (40.145077, −74.817841).[4]
Wickus Sippus Creek passes through Tullytown.[5]
According to the United States Census Bureau, the borough has a total area of 2.1 square miles (5.4 km²), of which, 1.6 square miles (4.1 km²) of it is land and 0.5 square miles (1.3 km²) of it (24.88%) is water.
Demographics[]
| Historical population | |||
|---|---|---|---|
| Census | Pop. | %± | |
| 1880 | 262 | — | |
| 1900 | 528 | — | |
| 1910 | 622 | 17.8% | |
| 1920 | 572 | −8.0% | |
| 1930 | 658 | 15.0% | |
| 1940 | 562 | −14.6% | |
| 1950 | 648 | 15.3% | |
| 1960 | 2,452 | 278.4% | |
| 1970 | 2,194 | −10.5% | |
| 1980 | 2,277 | 3.8% | |
| 1990 | 2,339 | 2.7% | |
| 2000 | 2,031 | −13.2% | |
| 2010 | 1,872 | −7.8% | |
| 2019 (est.) | 2,181 | [2] | 16.5% |
| Sources:[6][7][8] | |||
As of the 2010 census, the borough was 92.5% Non-Hispanic White, 3.2% Black or African American, 0.2% Native American, 0.4% Asian, and 1.1% were two or more races. 3.0% of the population were of Hispanic or Latino ancestry.[9]
As of the census[7] of 2000, there were 2,031 people, 803 households, and 501 families residing in the borough. The population density was 1,289.2 people per square mile (496.3/km²). There were 819 housing units at an average density of 519.9 per square mile (200.1/km²). The racial makeup of the borough was 97.74% White, 1.48% African American, 0.05% Native American, 0.49% Asian, 0.10% from other races, and 0.15% from two or more races. Hispanic or Latino of any race were 1.38% of the population.
There were 803 households, out of which 29.0% had children under the age of 18 living with them, 46.7% were married couples living together, 10.3% had a female householder with no husband present, and 37.5% were non-families. 33.3% of all households were made up of individuals, and 19.3% had someone living alone who was 65 years of age or older. The average household size was 2.52 and the average family size was 3.24.
In the borough the population was spread out, with 24.5% under the age of 18, 7.9% from 18 to 24, 30.3% from 25 to 44, 20.4% from 45 to 64, and 16.9% who were 65 years of age or older. The median age was 39 years. For every 100 females, there were 92.9 males. For every 100 females age 18 and over, there were 90.6 males.
The median income for a household in the borough was $45,625, and the median income for a family was $57,917. Males had a median income of $35,774 versus $28,352 for females. The per capita income for the borough was $22,206. About 1.6% of families and 4.2% of the population were below the poverty line, including none of those under age 18 and 8.3% of those age 65 or over.
Climate[]
According to the Köppen climate classification system, Tullytown has a Humid subtropical climate (Cfa). Cfa climates are characterized by all months having an average mean temperature > 32.0 °F (0.0 °C), at least four months with an average mean temperature ≥ 50.0 °F (10.0 °C), at least one month with an average mean temperature ≥ 71.6 °F (22.0 °C) and no significant precipitation difference between seasons. Although most summer days are slightly humid in Tullytown, episodes of heat and high humidity can occur with heat index values > 108 °F (42 °C). Since 1981, the highest air temperature was 103.2 °F (39.6 °C) on 07/06/2010, and the highest daily average mean dew point was 75.3 °F (24.1 °C) on 08/13/2016. The average wettest month is July which corresponds with the annual peak in thunderstorm activity. Since 1981, the wettest calendar day was 6.35 inches (161 mm) on 08/27/2011. During the winter months, the average annual extreme minimum air temperature is 1.6 °F (−16.9 °C).[10] Since 1981, the coldest air temperature was −9.6 °F (−23.1 °C) on 01/22/1984. Episodes of extreme cold and wind can occur with wind chill values < −9 °F (−23 °C). The average annual snowfall (Nov-Apr) is between 24 inches (61 cm) and 30 inches (76 cm). Ice storms and large snowstorms depositing ≥ 12 inches (30 cm) occur once every few years, particularly during nor’easters from December through February.
| hideClimate data for Tullytown, Elevation 16 ft (5 m), 1981-2010 normals, extremes 1981-2018 | |||||||||||||
|---|---|---|---|---|---|---|---|---|---|---|---|---|---|
| Month | Jan | Feb | Mar | Apr | May | Jun | Jul | Aug | Sep | Oct | Nov | Dec | Year |
| Record high °F (°C) | 71.8 (22.1) |
77.9 (25.5) |
87.8 (31.0) |
95.1 (35.1) |
96.0 (35.6) |
97.3 (36.3) |
103.2 (39.6) |
101.1 (38.4) |
98.8 (37.1) |
89.2 (31.8) |
81.5 (27.5) |
76.1 (24.5) |
103.2 (39.6) |
| Average high °F (°C) | 40.7 (4.8) |
43.9 (6.6) |
51.9 (11.1) |
64.1 (17.8) |
73.4 (23.0) |
82.7 (28.2) |
86.9 (30.5) |
85.2 (29.6) |
78.3 (25.7) |
67.1 (19.5) |
56.2 (13.4) |
45.1 (7.3) |
64.7 (18.2) |
| Daily mean °F (°C) | 32.4 (0.2) |
34.9 (1.6) |
42.1 (5.6) |
52.8 (11.6) |
62.0 (16.7) |
71.5 (21.9) |
76.1 (24.5) |
74.6 (23.7) |
67.5 (19.7) |
56.0 (13.3) |
46.5 (8.1) |
36.8 (2.7) |
54.5 (12.5) |
| Average low °F (°C) | 24.1 (−4.4) |
25.9 (−3.4) |
32.4 (0.2) |
41.6 (5.3) |
50.6 (10.3) |
60.4 (15.8) |
65.3 (18.5) |
64.1 (17.8) |
56.7 (13.7) |
44.9 (7.2) |
36.8 (2.7) |
28.5 (−1.9) |
44.4 (6.9) |
| Record low °F (°C) | −9.6 (−23.1) |
−2.5 (−19.2) |
4.6 (−15.2) |
18.1 (−7.7) |
32.7 (0.4) |
41.6 (5.3) |
47.7 (8.7) |
42.6 (5.9) |
36.3 (2.4) |
25.3 (−3.7) |
12.1 (−11.1) |
0.5 (−17.5) |
−9.6 (−23.1) |
| Average precipitation inches (mm) | 3.57 (91) |
2.73 (69) |
4.28 (109) |
3.86 (98) |
4.14 (105) |
4.24 (108) |
5.07 (129) |
4.31 (109) |
4.10 (104) |
3.69 (94) |
3.44 (87) |
3.94 (100) |
47.37 (1,203) |
| Average relative humidity (%) | 65.2 | 61.5 | 57.8 | 57.0 | 61.9 | 65.9 | 66.2 | 68.6 | 69.3 | 68.5 | 66.9 | 66.8 | 64.7 |
| Average dew point °F (°C) | 22.0 (−5.6) |
23.0 (−5.0) |
28.3 (−2.1) |
38.0 (3.3) |
48.8 (9.3) |
59.5 (15.3) |
64.0 (17.8) |
63.6 (17.6) |
57.1 (13.9) |
45.8 (7.7) |
36.1 (2.3) |
26.8 (−2.9) |
42.8 (6.0) |
| Source: PRISM[11] | |||||||||||||
Ecology[]
According to the A. W. Kuchler U.S. potential natural vegetation types, Tullytown would have a dominant vegetation type of Appalachian Oak (104) with a dominant vegetation form of Eastern Hardwood Forest (25).[12] The plant hardiness zone is 7a with an average annual extreme minimum air temperature of 1.6 °F (−16.9 °C).[10] The spring bloom typically begins by April 7 and fall color usually peaks by November 4.
References[]
- ^ "2019 U.S. Gazetteer Files". United States Census Bureau. Retrieved July 28, 2020.
- ^ Jump up to: a b "Population and Housing Unit Estimates". United States Census Bureau. May 24, 2020. Retrieved May 27, 2020.
- ^ "National Register Information System". National Register of Historic Places. National Park Service. July 9, 2010.
- ^ "US Gazetteer files: 2010, 2000, and 1990". United States Census Bureau. 2011-02-12. Retrieved 2011-04-23.
- ^ MacReynolds, George, Place Names in Bucks County, Pennsylvania, Doylestown, Bucks County Historical Society, Doylestown, PA, 1942, P1.
- ^ "Census of Population and Housing". U.S. Census Bureau. Retrieved 11 December 2013.
- ^ Jump up to: a b "U.S. Census website". United States Census Bureau. Retrieved 2008-01-31.
- ^ "Incorporated Places and Minor Civil Divisions Datasets: Subcounty Resident Population Estimates: April 1, 2010 to July 1, 2012". Population Estimates. U.S. Census Bureau. Archived from the original on 11 June 2013. Retrieved 11 December 2013.
- ^ https://www.usatoday.com/news/nation/census/profile/PA
- ^ Jump up to: a b "USDA Interactive Plant Hardiness Map". United States Department of Agriculture. Retrieved October 16, 2019.
- ^ "PRISM Climate Group, Oregon State University". Retrieved October 17, 2019.
- ^ "U.S. Potential Natural Vegetation, Original Kuchler Types, v2.0 (Spatially Adjusted to Correct Geometric Distortions)". Retrieved October 3, 2019.
External links[]
| Wikivoyage has a travel guide for Tullytown. |
 Media related to Tullytown, Pennsylvania at Wikimedia Commons
- Official website
- Tullytown Borough Boundary Map
| show Municipalities and communities of Bucks County, Pennsylvania, United States |
|---|

| show Authority control |
|---|
- Populated places established in 1816
- Boroughs in Bucks County, Pennsylvania
- Pennsylvania populated places on the Delaware River