1970 United States census
| Nineteenth census of the United States | ||
|---|---|---|
| ||
 U.S. Census Bureau seal | ||
 1970 U.S. census logo | ||
| General information | ||
| Country | United States | |
| Results | ||
| Total population | 203,392,031 ( | |
| Most populous | California 19,953,134 | |
| Least populous | Alaska 302,173 | |
The United States census of 1970, conducted by the Census Bureau, determined the resident population of the United States to be 203,392,031, an increase of 13.4 percent over the 179,323,175 persons enumerated during the 1960 census. This was the first census since 1810 in which New York was not the most populous state – California overtook it in population in November 1962. This was also the first census in which all states recorded a population of over 300,000, and the first in which a city in the geographic South recorded a population of over 1 million (Houston).
Data availability[]
Microdata from the 1970 census are freely available through the Integrated Public Use Microdata Series. Aggregate data for small areas, together with electronic boundary files, can be downloaded from the National Historical Geographic Information System. These data were originally created and disseminated by DUALabs. Personally identifiable information will be available in 2042.[1]
State rankings[]
| Rank | State | Population as of 1970 census |
Population as of 1960 census |
Change | Percent change |
|---|---|---|---|---|---|
| 1 | 19,953,134 | 15,717,204 | 4,235,930 |
27.0% | |
| 2 | 18,236,967 | 16,782,304 | 1,454,663 |
8.7% | |
| 3 | 11,793,909 | 11,319,366 | 474,543 |
4.2% | |
| 4 | 11,196,730 | 9,579,677 | 1,617,053 |
16.9% | |
| 5 | 11,113,976 | 10,081,158 | 1,032,818 |
10.2% | |
| 6 | 10,652,017 | 9,706,397 | 945,620 |
9.7% | |
| 7 | 8,875,083 | 7,823,194 | 1,051,889 |
13.4% | |
| 8 | 7,168,164 | 6,066,782 | 1,101,382 |
18.2% | |
| 9 | 6,789,443 | 4,951,560 | 1,837,883 |
37.1% | |
| 10 | 5,689,170 | 5,148,578 | 540,592 |
10.5% | |
| 11 | 5,193,669 | 4,662,498 | 531,171 |
11.4% | |
| 12 | 5,082,059 | 4,556,155 | 525,904 |
11.5% | |
| 13 | 4,676,501 | 4,319,813 | 356,688 |
8.3% | |
| 14 | 4,648,494 | 3,966,949 | 681,545 |
17.2% | |
| 15 | 4,589,575 | 3,943,116 | 646,459 |
16.4% | |
| 16 | 4,417,731 | 3,951,777 | 465,954 |
11.8% | |
| 17 | 3,923,687 | 3,567,089 | 356,598 |
10.0% | |
| 18 | 3,922,399 | 3,100,689 | 821,710 |
26.5% | |
| 19 | 3,804,971 | 3,413,864 | 391,107 |
11.5% | |
| 20 | 3,641,306 | 3,257,022 | 384,284 |
11.8% | |
| 21 | 3,444,165 | 3,266,740 | 177,425 |
5.4% | |
| 22 | 3,409,169 | 2,853,214 | 555,955 |
19.5% | |
| 23 | 3,218,706 | 3,038,156 | 180,550 |
5.9% | |
| 24 | 3,031,709 | 2,535,234 | 496,475 |
19.6% | |
| 25 | 2,824,376 | 2,757,537 | 66,839 |
2.4% | |
| 26 | 2,590,516 | 2,382,594 | 207,922 |
8.7% | |
| 27 | 2,559,229 | 2,328,284 | 230,945 |
9.9% | |
| 28 | 2,246,578 | 2,178,611 | 67,967 |
3.1% | |
| 29 | 2,216,912 | 2,178,141 | 38,771 |
1.8% | |
| 30 | 2,207,259 | 1,753,947 | 453,312 |
25.8% | |
| 31 | 2,091,533 | 1,768,687 | 322,846 |
18.3% | |
| 32 | 1,923,295 | 1,786,272 | 137,023 |
7.7% | |
| 33 | 1,745,944 | 1,302,161 | 443,783 |
34.1% | |
| 34 | 1,744,237 | 1,860,421 | -116,184 |
-6.2% | |
| 35 | 1,483,493 | 1,411,330 | 72,163 |
5.1% | |
| 36 | 1,059,273 | 890,627 | 168,646 |
18.9% | |
| 37 | 1,017,055 | 951,023 | 66,032 |
6.9% | |
| 38 | 992,048 | 969,265 | 22,783 |
2.4% | |
| 39 | 946,725 | 859,488 | 87,237 |
10.1% | |
| 40 | 769,913 | 632,772 | 137,141 |
21.7% | |
| – | 756,510 | 763,956 | -7,446 |
-1.0% | |
| 41 | 737,681 | 606,921 | 130,760 |
21.5% | |
| 42 | 712,567 | 667,191 | 45,376 |
6.8% | |
| 43 | 694,409 | 674,767 | 19,642 |
2.9% | |
| 44 | 665,507 | 680,514 | -15,007 |
-2.2% | |
| 45 | 617,761 | 632,446 | -14,685 |
-2.3% | |
| 46 | 548,104 | 446,292 | 101,812 |
22.8% | |
| 47 | 488,738 | 285,278 | 203,460 |
71.3% | |
| 48 | 444,330 | 389,881 | 54,449 |
14.0% | |
| 49 | 332,416 | 330,066 | 2,350 |
0.7% | |
| 50 | 300,382 | 226,167 | 74,215 |
32.8% |
City rankings[]
| Rank | City | State | 1960 Population | 1970 Population | 10-year Change[2] | Region (2014)[3] |
|---|---|---|---|---|---|---|
| 1 | New York | New York | 7,781,984 | 7,894,862 | +1.45% | Northeast |
| 2 | Chicago | Illinois | 3,550,404 | 3,366,957 | -5.17% | Midwest |
| 3 | Los Angeles | California | 2,479,015 | 2,811,801 | +13.42% | West |
| 4 | Philadelphia | Pennsylvania | 2,002,512 | 1,948,609 | -2.69% | Northeast |
| 5 | Detroit | Michigan | 1,670,144 | 1,514,063 | -9.35% | Midwest |
| 6 | Houston | Texas | 938,219 | 1,232,802 | +31.40% | South |
| 7 | Baltimore | Maryland | 939,024 | 905,787 | -3.54% | South |
| 8 | Dallas | Texas | 679,684 | 844,401 | +24.23% | South |
| 9 | Washington | District of Columbia | 763,956 | 756,510 | -0.97% | South |
| 10 | Cleveland | Ohio | 876,050 | 750,903 | -14.29% | Midwest |
| 11 | Indianapolis | Indiana | 476,258 | 744,624 | +56.35% | Midwest |
| 12 | Milwaukee | Wisconsin | 741,324 | 717,099 | -3.27% | Midwest |
| 13 | San Francisco | California | 740,316 | 715,674 | -3.33% | West |
| 14 | San Diego | California | 573,224 | 696,769 | +21.55% | West |
| 15 | San Antonio | Texas | 654,153 | South | ||
| 16 | Boston | Massachusetts | 641,071 | Northeast | ||
| 17 | Memphis | Tennessee | 623,530 | South | ||
| 18 | St. Louis | Missouri | 622,236 | Midwest | ||
| 19 | New Orleans | Louisiana | 593,471 | South | ||
| 20 | Phoenix | Arizona | 581,562 | West | ||
| 21 | Columbus | Ohio | 539,677 | Midwest | ||
| 22 | Seattle | Washington | 530,831 | West | ||
| 23 | Jacksonville | Florida | 528,865 | South | ||
| 24 | Pittsburgh | Pennsylvania | 520,117 | Northeast | ||
| 25 | Denver | Colorado | 514,678 | West | ||
| 26 | Kansas City | Missouri | 475,539 | 507,087 | +6.63% | Midwest |
| 27 | Atlanta | Georgia | 487,455 | 495,039 | +1.56% | South |
| 28 | Buffalo | New York | 462,768 | Northeast | ||
| 29 | Cincinnati | Ohio | 452,524 | Midwest | ||
| 30 | Nashville-Davidson | Tennessee | 448,003 | South | ||
| 31 | San Jose | California | 445,779 | West | ||
| 32 | Minneapolis | Minnesota | 434,400 | Midwest | ||
| 33 | Fort Worth | Texas | 393,476 | South | ||
| 34 | Toledo | Ohio | 383,818 | Midwest | ||
| 35 | Portland | Oregon | 382,619 | West | ||
| 36 | Newark | New Jersey | 382,417 | Northeast | ||
| 37 | Oklahoma City | Oklahoma | 366,481 | South | ||
| 38 | Oakland | California | 361,561 | West | ||
| 39 | Louisville | Kentucky | 361,472 | South | ||
| 40 | Long Beach | California | 358,633 | West | ||
| 41 | Omaha | Nebraska | 347,328 | Midwest | ||
| 42 | Miami | Florida | 334,859 | South | ||
| 43 | Tulsa | Oklahoma | 331,638 | South | ||
| 44 | Honolulu | Hawaii | 324,871 | West | ||
| 45 | El Paso | Texas | 322,261 | South | ||
| 46 | Saint Paul | Minnesota | 309,980 | Midwest | ||
| 47 | Norfolk | Virginia | 307,951 | South | ||
| 48 | Birmingham | Alabama | 300,910 | South | ||
| 49 | Rochester | New York | 296,233 | Northeast | ||
| 50 | Tampa | Florida | 277,767 | South | ||
| 51 | Wichita | Kansas | 276,554 | Midwest | ||
| 52 | Akron | Ohio | 275,425 | Midwest | ||
| 53 | Tucson | Arizona | 262,933 | West | ||
| 54 | Jersey City | New Jersey | 260,545 | Northeast | ||
| 55 | Sacramento | California | 254,413 | West | ||
| 56 | Austin | Texas | 251,808 | South | ||
| 57 | Richmond | Virginia | 249,621 | South | ||
| 58 | Albuquerque | New Mexico | 243,751 | West | ||
| 59 | Dayton | Ohio | 243,601 | Midwest | ||
| 60 | Charlotte | North Carolina | 241,178 | South | ||
| 61 | St. Petersburg | Florida | 216,232 | South | ||
| 62 | Corpus Christi | Texas | 204,525 | South | ||
| 63 | Yonkers | New York | 204,297 | Northeast | ||
| 64 | Des Moines | Iowa | 200,587 | Midwest | ||
| 65 | Grand Rapids | Michigan | 197,649 | Midwest | ||
| 66 | Syracuse | New York | 197,208 | Northeast | ||
| 67 | Flint | Michigan | 193,317 | Midwest | ||
| 68 | Mobile | Alabama | 190,026 | South | ||
| 69 | Shreveport | Louisiana | 182,064 | South | ||
| 70 | Warren | Michigan | 179,260 | Midwest | ||
| 71 | Providence | Rhode Island | 179,213 | Northeast | ||
| 72 | Fort Wayne | Indiana | 177,671 | Midwest | ||
| 73 | Worcester | Massachusetts | 176,572 | Northeast | ||
| 74 | Salt Lake City | Utah | 175,885 | West | ||
| 75 | Gary | Indiana | 175,415 | Midwest | ||
| 76 | Knoxville | Tennessee | 174,587 | South | ||
| 77 | Arlington | Virginia | 174,284 | South | ||
| 78 | Madison | Wisconsin | 173,258 | Midwest | ||
| 79 | Virginia Beach | Virginia | 172,106 | South | ||
| 80 | Spokane | Washington | 170,516 | West | ||
| 81 | Kansas City | Kansas | 168,213 | Midwest | ||
| 82 | Anaheim | California | 166,701 | West | ||
| 83 | Fresno | California | 165,972 | West | ||
| 84 | Baton Rouge | Louisiana | 165,963 | South | ||
| 85 | Springfield | Massachusetts | 163,905 | Northeast | ||
| 86 | Hartford | Connecticut | 158,017 | Northeast | ||
| 87 | Santa Ana | California | 156,601 | West | ||
| 88 | Bridgeport | Connecticut | 156,542 | Northeast | ||
| 89 | Tacoma | Washington | 154,581 | West | ||
| 90 | Columbus | Georgia | 154,168 | South | ||
| 91 | Jackson | Mississippi | 153,968 | South | ||
| 92 | Lincoln | Nebraska | 149,518 | Midwest | ||
| 93 | Lubbock | Texas | 149,101 | South | ||
| 94 | Rockford | Illinois | 147,370 | Midwest | ||
| 95 | Paterson | New Jersey | 144,824 | Northeast | ||
| 96 | Greensboro | North Carolina | 144,076 | South | ||
| 97 | Riverside | California | 140,089 | West | ||
| 98 | Youngstown | Ohio | 139,788 | Midwest | ||
| 99 | Fort Lauderdale | Florida | 139,590 | South | ||
| 100 | Evansville | Indiana | 138,764 | Midwest |
Conclusions[]
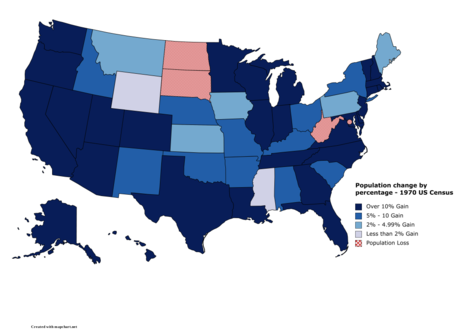
California took over as the most populous state; New York had previously been ranked number one. While the entire country increased to more than 204 million persons, four states lost population, with West Virginia leading the list, down 8 and a half percent from 1960.[4]
On April 25, 1973, the Census Bureau announced the results of a reanalysis of the 1970 census. The report estimated that the census undercounted approximately 5.33 million people, for a net undercount rate of 2.5%. This would have made the population approximately 208.7 million. Of those undercounted, an estimated 3.45 million were white, and 1.88 million were black.[5]
Notes[]
- ^ PIO, US Census Bureau, Census History Staff. "The "72-Year Rule" – History – U.S. Census Bureau". www.census.gov. Archived from the original on October 4, 2013. Retrieved October 26, 2013.
- ^ Population of the 100 Largest Cities and Other Urban Places in the United States: 1790 to 1990, U.S. Census Bureau, 1998, archived from the original on September 2, 2017
- ^ "Regions and Divisions". U.S. Census Bureau. Archived from the original on December 3, 2014. Retrieved September 9, 2014.
- ^ "1970 Year in Review". UPI.com. Archived from the original on May 4, 2009. Retrieved April 8, 2009.
- ^ Kovach, Bill (April 26, 1973). "Census Bureau Reports It Overlooked 5,300,000 People in 1970". The New York Times. Retrieved April 27, 2021.
External links[]
- Historic US Census data
- 1971 U.S Census Report, with estimated 1970 census results
- 1970 Census of Population
| show Authority control |
|---|
- 1970 in the United States
- United States census
- 1970 censuses