Umzinyathi District Municipality
uMzinyathi | |
|---|---|
District municipality | |
 Seal | |
 Location in South Africa | |
| Country | South Africa |
| Province | KwaZulu-Natal |
| Seat | Dundee |
| Local municipalities | |
| Government | |
| • Type | Municipal council |
| • Mayor | Mbangiseni Shadrack Yengwa |
| Area | |
| • Total | 8,589 km2 (3,316 sq mi) |
| Population (2011)[2] | |
| • Total | 510,838 |
| • Density | 59/km2 (150/sq mi) |
| Racial makeup (2011) | |
| • Black African | 96.6% |
| • Coloured | 0.5% |
| • Indian/Asian | 1.3% |
| • White | 1.4% |
| First languages (2011) | |
| • Zulu | 91.0% |
| • English | 3.1% |
| • Sotho | 2.3% |
| • Afrikaans | 1.0% |
| • Other | 2.6% |
| Time zone | UTC+2 (SAST) |
| Municipal code | DC24 |
uMzinyathi is one of the 11 district municipalities ("districts") of KwaZulu-Natal province in South Africa. The seat of uMzinyathi is Dundee. The majority of its 456 452 people speak IsiZulu (2001 Census). The district code is DC24
Geography[]
Neighbours[]
Umzinyathi is surrounded by:
- Amajuba in the north (DC25)
- Zululand in the north-east (DC26)
- uThungulu in the east (DC28)
- iLembe in the south-east (DC29)
- uMgungundlovu in the south-west (DC22)
- Uthukela in the west (DC23)
Local municipalities[]
The district contains the following local municipalities:
| Local municipality | Population | % |
|---|---|---|
| Msinga | 168 022 | 36.81% |
| Nqutu | 145 033 | 31.77% |
| Umvoti | 92 292 | 20.22% |
| Endumeni | 51 110 | 11.20% |
Demographics[]
The following statistics are from the 2001 census.
| Language | Population | % |
|---|---|---|
| IsiZulu | 422 801 | 92.63% |
| Sesotho | 13 241 | 2.90% |
| English | 12 025 | 2.63% |
| Afrikaans | 4 843 | 1.06% |
| IsiNdebele | 937 | 0.21% |
| IsiXhosa | 645 | 0.14% |
| Sepedi | 634 | 0.14% |
| Other | 618 | 0.14% |
| SiSwati | 459 | 0.10% |
| Setswana | 172 | 0.04% |
| Xitsonga | 51 | 0.01% |
| Tshivenda | 31 | 0.01% |
Gender[]
| Gender | Population | % |
|---|---|---|
| Female | 255 660 | 56.01% |
| Male | 200 792 | 43.99% |
Ethnic group[]
| Ethnic group | Population | % |
|---|---|---|
| Black African | 439 889 | 96.37% |
| White | 7 336 | 1.61% |
| Indian/Asian | 6 593 | 1.44% |
| Coloured | 2 634 | 0.58% |
Age[]
| Age | Population | % |
|---|---|---|
| 000 - 004 | 60 159 | 13.18% |
| 005 - 009 | 67 630 | 14.82% |
| 010 - 014 | 66 994 | 14.68% |
| 015 - 019 | 59 156 | 12.96% |
| 020 - 024 | 36 022 | 7.89% |
| 025 - 029 | 27 821 | 6.10% |
| 030 - 034 | 22 830 | 5.00% |
| 035 - 039 | 22 211 | 4.87% |
| 040 - 044 | 18 051 | 3.95% |
| 045 - 049 | 16 182 | 3.55% |
| 050 - 054 | 13 935 | 3.05% |
| 055 - 059 | 10 810 | 2.37% |
| 060 - 064 | 10 531 | 2.31% |
| 065 - 069 | 7 612 | 1.67% |
| 070 - 074 | 7 345 | 1.61% |
| 075 - 079 | 4 253 | 0.93% |
| 080 - 084 | 3 252 | 0.71% |
| 085 - 089 | 896 | 0.20% |
| 090 - 094 | 391 | 0.09% |
| 095 - 099 | 274 | 0.06% |
| 100 plus | 97 | 0.02% |
Politics[]
Election results[]
Election results for Umzinyathi in the South African general election, 2004.
- Population 18 and over: 224 263 [49.13% of total population]
- Total votes: 122 689 [26.88% of total population]
- Voting % estimate: 54.71% votes as a % of population 18 and over
| Party | Votes | % |
|---|---|---|
| Inkhata Freedom Party | 79 544 | 64.83% |
| African National Congress | 29 618 | 24.14% |
| Democratic Alliance | 6 884 | 5.61% |
| African Christian Democratic Party | 1 917 | 1.56% |
| United Democratic Movement | 739 | 0.60% |
| Freedom Front Plus | 645 | 0.53% |
| New National Party | 577 | 0.47% |
| Azanian People's Organisation | 351 | 0.29% |
| Minority Front | 303 | 0.25% |
| Independent Democrats | 291 | 0.24% |
| PJC | 240 | 0.20% |
| Pan African Congress | 226 | 0.18% |
| United Christian Democratic Party | 202 | 0.16% |
| SOPA | 181 | 0.15% |
| CDP | 173 | 0.14% |
| KISS | 172 | 0.14% |
| UF | 148 | 0.12% |
| NA | 147 | 0.12% |
| EMSA | 133 | 0.11% |
| TOP | 128 | 0.10% |
| NLP | 70 | 0.06% |
| Total | 122 689 | 100.00% |
See also[]
References[]
- ^ "Contact list: Executive Mayors". Government Communication & Information System. Archived from the original on 14 July 2010. Retrieved 22 February 2012.
- ^ a b "Statistics by place". Statistics South Africa. Retrieved 27 September 2015.
- ^ "Statistics by place". Statistics South Africa. Retrieved 27 September 2015.
External links[]
| Metropolitan | 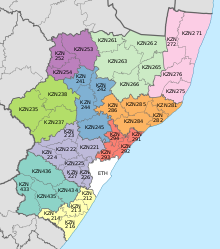 | ||||||||||||||||||||
|---|---|---|---|---|---|---|---|---|---|---|---|---|---|---|---|---|---|---|---|---|---|
| District and local |
| ||||||||||||||||||||
List of municipalities in KwaZulu-Natal | |||||||||||||||||||||
Coordinates: 28°10′S 30°13′E / 28.167°S 30.217°E

This KwaZulu-Natal location article is a stub. You can help Wikipedia by . |
Categories:
- District Municipalities of KwaZulu-Natal
- Umzinyathi District Municipality
- KwaZulu-Natal geography stubs